Spatial behavior of prices in the Russian Federation in 2003-2012

Author: Stupnikova Anna Vladimirovna
Journal: Economic and Social Changes: Facts, Trends, Forecast @volnc-esc-en
Section: Young researchers
Article in issue: 3 (33) т.7, 2014.
Free access
The heterogeneity of economic development and specifics of the spatial position of regions implies that the regional markets in the country are characterized by varying degrees and trends of price dynamics. The multidirectional and disproportionate changes in the prices in the regional markets, in turn, show that integration in the national market is poor. The work presents the results of research into the spatial behavior of prices in the Russian Federation in 2003-2012, carried out mainly using the descriptive analysis of consumer prices based on the identification of the measures of dispersion of price indicators - standard deviation and the range of variation. The analysis of consumer price indices dynamics shows that the year 2008 is a period of greatest price growth, and also proves that the prices for services and foodstuffs are subject to the highest fluctuations. The analysis of the prices for the fixed set of goods and services shows that consumer prices in the Russian Federation subjects during the analyzed period changed unevenly; however, beginning from 2009 there is a positive trend of reducing fluctuations in their growth rates...
Spatial behavior of prices, price volatility, spatial market integration
Short address: https://sciup.org/147223602
IDR: 147223602 | UDC: 338.57 | DOI: 10.15838/esc/2014.3.33.19
Text of the scientific article Spatial behavior of prices in the Russian Federation in 2003-2012
Nowadays, “space” is one of the key categorical concepts in the research devoted to integration processes in different spheres of public activity and in different regions [1].
The study of market integration is aimed at assessment of spatial behavior of prices. Prices and their dynamics are an important indicator of efficiency of the economic system and optimal allocation of limited resources. Large differences in prices between regions of the country, their volatility and disproportionate changes can indicate weak integration of the national market and violation of the conditions of common economic space. According to one of the approaches to the assessment of spatial market integration, often applied in empirical studies, two markets will be integrated, if prices change in similar direction and proportion [12].
Large distances between regional markets, leading to substantial transport costs, and such factors as poor infrastructure, a lack or a poor condition of roads, communications, administrative restrictions, cause multidirectional and disproportionate price changes in some regions of the country and disintegration of the national market space. The territorial vastness of the Russian Federation and heterogeneity of the socio-economic development of its regions suggest that consumer prices behave differently, and regional markets are characterized by different degrees of integration at the national level. In this paper we try to test this hypothesis using the statistical analysis of consumer prices dynamics and to identify which RF regions have differed in prices behavior to a greater degree for the last decade. The analysis results give grounds for the conclusion about the degree of integration of the national market and selection of those regions that are least integrated at the national level.
It should be noted that in the scientific literature there is a limited number of papers that present an in-depth statistical analysis of the dynamics of consumer prices in the RF. Moreover, most of these works are connected with the assessment of prices behavior in the transition period. Foreign researchers have been interested in this issue as well. So, for example, P. De Masi and V. Koen, who have studied the trends of regional disparities in prices in Russia in the early post-reform period, have found out that the significant differences in regional prices, characteristic for the study period, can not caused by a large distance between regions and limited market integration in the country [10]. Similar findings have been obtained in the study carried out by B. Gardner and K. Brooks [11]. According to D. Berkowitz and D.N. DeJong, the reason for significant inter-regional differences in prices are “anti-market” regions, or regions of “a red belt”, which, unlike other regions, are characterized by the specific price behavior [9].
The most important domestic studies are conducted by A.A. Tsyplakov and K.P. Glu-shchenko. The research of A.A. Tsyplakov, presenting the statistical analysis of the dynamics of regional price levels for the post-reform period, has revealed that in 1994–1999 there were regional differences in the dynamics of prices, but they were relatively small [8].
K.P. Glushchenko, having indicated significant differences in the levels of prices for goods between different territories of the country in 1990–2000s, has disclosed weak integration of the Russian consumer market in this period [2]. On the basis of evaluation of the dynamics of the Russian market integration in 1992–2000, the author has come to the conclusion that in 1994–1999, after reaching a peak of the Russian market fragmentation in 1993– 1994, the general trend is the convergence of prices and strengthening of integration processes [3]. However, later, taking into account such an indicator of the market integration as the strict law of one price, K.P. Glushchenko makes the conclusion about relatively weak integration of the Russian market in 1994–2000 [6].
The research, estimating spatial dynamics of consumer prices in Russia in 2003–2012, is carried out to assess the level of the country’s economic space integration in the conditions of market economy and to identify the regions, deviating more from the general trend of price behavior. To achieve this goal we have identified:
– what product groups are characterized by the highest price changes;
– what federal districts and RF subjects are characterized by the greatest price volatility;
– what are the differences in the prices dynamics of certain commodity groups in federal districts and RF subjects.
The descriptive analysis of prices is a basic research tool. The most commonly used descriptive methods are frequency distribution, measures of central tendency, measures of variability (dispersion) and measures of relative position. To estimate spatial dynamics of the price range, we use measures of dispersion, such as standard variation and variation range, evaluating the extent of variation of variable values in the variational series.
The initial data for the analysis are relative prices indicators, consumer price indices (CPI), and absolute ones, cost of a fixed set of goods and services and cost of the minimum set of food products. Selection of multiple indicators, representing the prices, is connected with the specific character of statistical observation. The consumer price index is used in many works devoted to the analysis of spatial prices behavior and the assessment of market integration. At the same time, it is possible to note both advantages and disadvantages of this indicator. The index gives an opportunity to analyze the prices behavior for the three groups of goods – food, non-food and services. But this figure is not ideal for the spatial analysis of prices as weights, determined by the structure of consumer expenses of the population and used for calculating the CPI, are different among the regions.
Calculation of the cost of a fixed set of goods and services and the cost of a minimum set of food products is based on common norms of consumption that can be used in the research of interregional differentiation of consumer prices levels. However, the indicator of the cost of a fixed set of goods and services does not allow us to make conclusions about spatial dynamics of separate groups of goods.
The sources of price indicators are databases of consumer prices presented on the website of the Federal State Statistics Service [7].
The time period of the analysis is indicated from 2003 to 2012. Most empirical researches provide the results of estimation of spatial behavior of prices in the period of their liberalization, as well as in the period of ruble devaluation and in the 1998 economic crisis. Thus, these works reveal the prices behavior, determined by the post-reform shocks, the transition to market economy and its formation. This article assesses the dynamics of consumer prices in conditions of relatively stable economy, which has completed the transition to the market.
The dynamics of the consumer price growth rate in 2003–2012 had no definite trend, there were both periods of growth and periods of decline. The variations in the rate of consumer price increase amounted to 7.2%. The lowest index value (6.1%) was observed in 2011. The highest index value in 2008 can be explained by the impact of the global financial crisis. The slowdown in consumer price growth by 3% in 2003–2006 and 7.2% in 2009–2011 discloses some stability in the economy in the indicated periods. However, in 2012, the rate of consumer price growth increased again, exceeding the minimum index value for the period by 0.5%.
To determine the dynamics of the price growth of separate commodity groups we have used monthly values of consumer price indices of food products, manufactured goods and services. By comparing these indicators we have found out that services prices experienced the greatest fluctuations and seasonal influence in the examined period. So, annually, except for 2012, there was sharp price growth in January. The greatest value of the interval of services price fluctuations amounted to almost 9% in 2008. The maximum price range was 2.3% in 2005.
Services prices immobility can cause their high volatility but not significant differences in prices of such mobile products, as food. This type of product is of interest in the spatial analysis of price fluctuations.
If you compare price fluctuations in the groups of food and non-food items, you can see that they are much more vivid in the first group in the analyzed period. Thus, the price range of food products amounted to 0.9% in relation to the average value in the analyzed period, of non-food – only 0.2%. The greatest price ranges of food products, in relation to the average value, were in 2003, 2007 and 2012.
Spatial behavior of prices in 2003–2012 was estimated by comparison of the indicators, representing prices in Federal districts and separate subjects of the Russian Federation. The research does not consider the North-Caucasian Federal District, as Rosstat has been publishing data on the considered indicators of the district only since 2009. Therefore, we have studied prices behavior in 7 federal districts and 76 subjects of the Russian Federation, including Moscow and Saint Petersburg.
Comparison of the general price index in federal districts in dynamics has not lead to selection of districts with excessive growth or decline of prices in the study period. In general, they were changing quite synchronously in federal districts, there were no large differences in their dynamics.
On the basis of annual consumer price indices we have calculated minimum and maximum variations of the price growth rate from the average national level ( tab. 1 ). The calculation results have confirmed the insignificance of their dispersion in federal districts. In the analyzed period the greatest variation was observed in 2007 (from -2.27 to +1.23%) and the lowest – in 2012 (from -0.64 to +0.31%). However, it should be noted that in the Far Eastern Federal district we have observed extreme (minimum or maximum) limit variations from the average national level. This prices behavior stems from the fact that the district includes almost all remote regions of the country, which differ significantly from other regions by the level and dynamics of prices.
It is quite obvious that the differences in price growth in the RF subjects are
Table 1. Variation of the price growth rate in federal districts and RF subjects from the Russian average level, %
Indicator 2003 2004 2005 2006 2007 2008 2009 2010 2011 2012 In federal districts Interval 2.85 2 3.1 1.6 3.5 1.5 1.94 2.9 1.6 0.95 Minimum value/FD -1.65/ UFD -1.33/ UFD -0.72/ VFD -0.4/ SFD -2.27/ FEFD -0.68/ UFD -0.88/ VFD -1.1/ FEFD -0.31/ NWFD -0.64/ FEFD Maximum value/ FD 1.2/ NWFD 0.67/ VFD 2.38/ FEFD 1.2/ UFD 1.23/ VFD 0.82/ NWFD 0.89/ FEFD 1.06/ UFD 0.7/ FEFD 0.31/ CFD In RF subjects Interval 9.42 8.3 14 6.4 9.1 9.4 11.29 11.16 6.16 4.7 Minimum value/RF Subject -3.04/ Republic of Mordovia -2.33/ Omsk Oblast -3.42/ Chuvash Republic -3.5/ Jewish Autonomous Oblast -4.47/ Nenets Autonomous Okrug -3.38/ Chukotka Autonomous Okrug -2.87/ Nenets Autonomous Okrug -7.38/ Chukotka Autonomous Okrug -3.04/ Yamalo-Nenets Autonomous Okrug -2.62/ Yamalo-Nenets Autonomous Okrug Maximum value/RF Subject 6.38/ Krasnoyarsk Krai 5.97/ Nenets Autonomous Okrug 10.58/ Kamchatka Krai 2.9/ Sakha (Yakutia) Republic 4.63/ Ryazan Oblast 6.02/ Magadan Oblast 8.42/ Chukotka Autonomous Okrug 3.78/ Republic of Kalmykia 3.12/ Magadan Oblast 2.08/ Magadan Oblast Calculated by: Federal'naya sluzhba gosudarstvennoi statistiki, Tsentral'naya baza statisticheskikh dannykh [Federal State Statistics Service, the Central Base of Statistical Data]. Available at: /rosstat/ru/statistics/tariffs/# characterized by long intervals and. In the period under analysis the maximum price range was observed in 2005 (from -3,42% in the Chuvash Republic to +of 10.58% in Kamchatka Krai), and the lowest – in 2012 (from -2,62% in Yamalo-Nenets Autonomous Okrug to +2,08% in the Magadan Oblast). From 2009 to 2012 there was a positive trend, as the fluctuation interval of the price growth rate narrowed from 11.3 to 4.7%. The extreme fluctuations values in the annual price growth rate are more often determined by the Magadan Oblast, Chukotka and Nenets Autonomous okrugs.
The general trend of price dynamics can be specified by considering the changes in prices of certain goods. As services are immobile goods, we can take into account only consumer price indices of food and non-food items.
The greatest consumer price growth for food products was observed in 2008, when they grew by 16.5% in average, the lowest growth of prices was registered in 2011 and amounted to 3.87%
The calculation of minimum and maximum price growth rates for food products in federal districts has revealed that most of these indicators were typical for the region. Thus, the maximum rate of consumer prices growth for food products was typical for the Far Eastern Federal District in 2003, 2005, 2009 and 2011.
Table 2. Variation of the price growth rate for food products in federal districts and RF subjects from the Russian average level, %
Indicator 2003 2004 2005 2006 2007 2008 2009 2010 2011 2012 In federal districts Interval 4.46 2.9 4 2.8 5.3 2.2 3.82 4.95 2.81 2.34 Minimum value/FD -2.31/ SFD -1.49/ UFD -1.17/ VFD -0.97/ VFD -3.96/ FEFD -0.65/ CFD -1.26/ VFD -3.62/ FEFD -0.66/ CFD -1.63/ FEFD Maximum value/ FD 2.15/ FEFD 1.41/ SFD 2.83/ FEFD 1.83/ UFD 1.34/ NWFD 1.55/ SFD 2.56/ FEFD 1.33/ SFD 2.15/ FEFD 0.71/ SFD In RF subjects Interval 15.07 11.2 10.8 11.3 15 13.5 14 16.31 7.99 6.47 Minimum value/ RF Subject -7.75/ Yamalo-Nenets Autonomous Okrug -2.99/ Amur Oblast -3.67/ Chuvash Republic -4.37/ Jewish Autonomous Oblast -10.06/ Chukotka Autonomous Okrug -9.15/ Chukotka Autonomous Okrug -4.42/ Nenets Autonomous Okrug -12.26/ Chukotka Autonomous Okrug -3.74/ Voronezh Oblast -4.53/ Nenets Autonomous Okrug Maximum value/ RF Subject 7.32/ Chukotka Autonomous Okrug 8.21/ Republic of Kalmykia 7.13/ Chukotka Autonomous Okrug 6.93/ Sakha (Yakutia) Republic 4.94/ Ryazan Oblast 4.35/ Republic of Kalmykia 9.58/ Chukotka Autonomous Okrug 4.05/ Ivanovo Oblast 4.25/ Republic of Buryatia 1.94/ Voronezh Oblast Calculated by: Federal'naya sluzhba gosudarstvennoi statistiki, Tsentral'naya baza statisticheskikh dannykh [Federal State Statistics Service, the Central Base of Statistical Data]. Available at: /rosstat/ru/statistics/tariffs/#
The assessment of fluctuations in the annual price growth rate for food products in Federal districts in relation to the average national level indicates that the price differences are generally insignificant ( tab. 2 ). The 5.3% maximum variation was registered in 2007, with the variation from the average Russian level being in the range from -3.96% (FEFD) to +1.34% (NWFD). The 2.2% minimum variation was observed in 2008, with the variation being in the range from -0.65% (CFD) to +1.55% (SFD). Extreme fluctuation values in the annual rate of price growth in 2003–2012 are more characteristic of the Far Eastern Federal District, which confirms the specific character of the region regarding the prices behavior.
In the context of RF subjects the differences in food price growth rates are more significant. In the analyzed period the average fluctuations interval, determined by minimum and maximum variations of the price growth rates from the national average in the RF subjects, is 3.5 times higher than this indicator, calculated at the level of federal districts. The 16.31% maximum interval was measured in 2010, the 6.47% minimum interval – in 2012. There is no definite tendency to decrease differences in growth rates in the studied period. Chukotka Autonomous Okrug had extreme fluctuation values in the annual price growth rate more frequently.
Differences in the growth rates of consumer prices for non-food products in federal districts are in two times lower than for food. The 3.3% maximum fluctuation value was recorded in 2005 (The Ural Federal District (UFD). The greatest growth of prices for non-food products was more typical for the FEFD and the UFD. However, in the Far Eastern Federal District the growth rate of non-food prices differs from national trends to a lesser extent than in the case of food prices.
Quantitative assessment of fluctuations in the price growth rates for non-food products in federal districts against the average Russian level has showed that price fluctuations are low ( tab. 3 ). The 3.3% maximum interval was in 2005, when the variation from the Russian average was observed in the range from -1.01% (NWFD) to +2.3% (in the UFD). The minimum 1% interval was in 2007, when the variation was in the range from -0.4% (SFD) to +0.6% (VFD). Extreme fluctuation values of growth rate of non-food prices are more often measured in the Ural, Southern and Far Eastern Federal districts.
However, in the context of the RF subjects the differences in growth rates of non-food prices were more significant: the average fluctuation value in the analyzed period amounted to 10.6%. The maximum interval amounted to 14.8% in 2005 and per cent, the minimum – to 7.8% in 2011. At the same time, there is no definite tendency to decrease differences in growth rates. The extreme fluctuation values of non-food prices are more frequently observed in Nenets Autonomous Okrug. All the stated above conclusions about spatial prices behavior are based on a consumer price
Table 3. Variation of the price growth rate for non-food products in federal districts and RF subjects from the Russian average level, %
Indicator 2003 2004 2005 2006 2007 2008 2009 2010 2011 2012 In federal districts Interval 2.49 1.3 3.3 1.8 1 2.5 2.08 1.31 1.19 1.07 Minimum value/FD -0.64/ CFD -0.77/ NFD -1.01/ NWFD -0.61/ NFD. NWFD -0.44/ NFD. FEFD -0.56/ UFD -0.8/ NWFD -0.46/ SFD -0.56/ SFD -0.65/ SFD Maximum value/ FD 1.85/ SFD 0.53/ CFD 2.29/ UFD 1.19/ UFD 0.56/ VFD 1.94/ FEFD 1.28/ FEFD 0.85/ UFD 0.63/ UFD 0.42/ FEFD In RF subjects Interval 12.38 13 14.8 11.8 7.9 10 11.73 8.67 7.78 8.15 Minimum value/ RF Subject -3.41/ Novosibirsk Oblast -3.67/ Chukotka Autonomous Okrug -3.61/ Republic of Tatarstan -6.21/ Nenets Autonomous Okrug -3.34/ Nenets Autonomous Okrug -4.16/ Nenets Autonomous Okrug -5.15/ Nenets Autonomous Okrug -2.97/ Kamchatka Krai -3.66/ Yamalo-Nenets Autonomous Okrug -2.44/ Chelyabinsk Oblast Maximum value/ RF Subject 8.97/ Khanty– Mansi Autonomous Okrug 9.33/ Nenets Autonomous Okrug 11.19/ Yamalo-Nenets Autonomous Okrug 5.59/ Astrakhan Oblast 4.56/ Perm Krai 5.84/ Kursk Oblast 6.58/ Khanty– Mansi Autonomous Okrug 5.7/ Sakhalin oblast 4.12/ Jewish Autonomous Oblast 5.71/ Magadan Oblast Calculated by: Federal'naya sluzhba gosudarstvennoi statistiki, Tsentral'naya baza statisticheskikh dannykh [Federal State Statistics Service, the Central Base of Statistical Data]. Available at: /rosstat/ru/statistics/tariffs/# index. However, a regional CPI is not very convenient for interregional comparisons. Weight of goods included the prices that are presented in the CPI are different for in each region, therefore, the regional indexes are not quite comparable [5].
For more accurate estimates of differences in regional growth rates we have used such an indicator as the cost of a fixed set of consumer goods and services. This figure is identical for all regions and covers 83 items of goods and services, including 30 kinds of food, 41 – of non-food items and 12 services. It should be noted that the bulk of spending on consumption accounts for goods and services included in this set.
To estimate price variations in federal districts we have singled out minimum and maximum variations in the growth rates of the cost of a fixed set of consumer goods and services from the average national level in federal districts (tab. 4). The 3.1% interval minimum value was in 2003–2012, the 4.3% maximum – in 2005 and 2010. The lowest fluctuation from the average national level in federal districts was observed in 2006 and amounted to 1.7%. In general, it can be concluded that the differences in price growth rates in federal districts, compared with the average Russian level in the studied period, were insignificant and did not have a clear tendency to increase
Table 4. Variation of the price growth rate for the cost of a fixed set of consumer goods and services in federal districts and RF subjects from the Russian average level, %
Indicator 2003 2004 2005 2006 2007 2008 2009 2010 2011 2012 In federal districts Interval 3.65 1.78 4.29 1.73 5.07 3.13 3.04 4.27 2.27 1.76 Minimum value/FD -2.11 / SFD -1.27/ UFD -1.5/ NFD -0.62/ FEFD -3.71/ FEFD -1.61/ NFD -1.34/ SFD -3.57/ FEFD -0.76/ SFD -0.81/ FEFD Maximum value/ FD 1.54/ NFD 0.51/ CFD 2.79/ FEFD 1.11/ UFD 1.36/ NWFD 1.52/ UFD 1.7/ FEFD 0.7/ VFD 1.51/ FEFD 0.95/ NFD In RF subjects Interval 17.87 15.37 23.64 11.09 14.89 14.59 15.42 16.77 10.98 10.87 Minimum value/ RF Subject -6.25/ Republic of Mordovia -5.76/ Astrakhan Oblast -5.98/ Irkutsk Oblast -5.87/ Nenets Autonomous Okrug -8.56/ Chukotka Autonomous Okrug -4.76/ Republic of Buryatia -5.33/ Nizhny Novgorod Oblast -11.22/ Chukotka Autonomous Okrug -5.81/ Altai Republic -5.33/ Nenets Autonomous Okrug Maximum value/ RF Subject 11.62/ Komi Republic 9.61/ Republic of Buryatia 17.66/ Kamchatka Krai 5.22/ Tambov Oblast 6.33/ Ryazan Oblast 9.83/ Nenets Autonomous Okrug 10.09/ Altai Republic 5.55/ Republic of Mordovia 5.17/ Jewish Autonomous Oblast 5.54/ Altai Republic Calculated by: Federal'naya sluzhba gosudarstvennoi statistiki, Tsentral'naya baza statisticheskikh dannykh [Federal State Statistics Service, the Central Base of Statistical Data]. Available at: /rosstat/ru/statistics/tariffs/# or decrease. The minimum and maximum variation of the growth rate of the cost of a fixed set of consumer goods and services in federal districts was often determined by the values of this indicator in the Far Eastern Federal District.
The average fluctuation in the growth rate of the cost of a fixed set of consumer goods and services in the context of the RF subjects (15.1%) exceeds the same indicator calculated at the level of federal districts in five times. Thus, the greatest interval value amounted to 23.6% in 2005, the lowest – 10.9 in 2012. It confirms the conclusion, obtained from the analysis of the CPI, that there are rather large differences in price growth rates in the context of the RF subjects.
As Rosstat does not publish data on the cost of the components of a fixed set of goods and services, the analysis of dynamics of consumer price levels on the basis of this indicator is limited to the general assessment. However, comparing the cost of a fixed set of goods and services in different regions, it is possible to calculate a territorial price index. Comparison of territorial price indices in federal districts in 2003–2012, calculated as the ratio of the cost of a fixed set of goods in different federal districts to the respective average indicator, indicates significant differences in values and dynamics of the index for the Far Eastern Federal District (fig. 1) .
The analysis of differences in the cost of a fixed set of goods and services in the
Figure 1. Dynamics of territorial price indices in 2003–2012
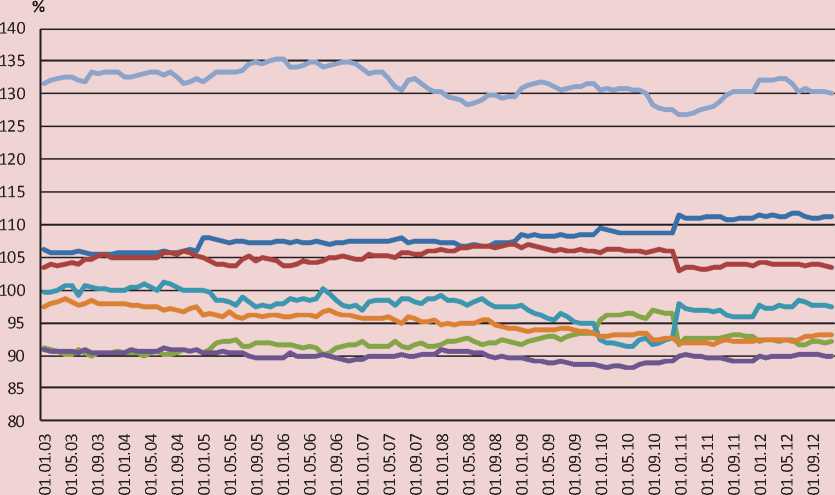
CFD/RF NWFD/RF SFD/RF VFD/RF
UFD/RF NFD/RF FEFD/RF
Calculated by: Federal State Statistics Service data. Available at:
context of RF subjects has showed that the maximum value of the territorial price index complies with the following hard-to-reach regions: Chukotka Autonomous Okrug – 202.2%, the Sakhalin Oblast – 151.4%, the Kamchatka Oblast – 168%, the Sakha (Yakutia) Republic – 138.5%, the Magadan Oblast – 141.8%. There are other regions where the cost of a fixed set of goods and services exceeds the national average by 30%. They are Khabarovsk Krai (130.1%), Yamalo-Nenets Autonomous Okrug (149.3%), Khanty-Mansi Autonomous Okrug (135.9%), and Moscow (145.6%). The regions where the cost of a fixed set of goods and services is below 15% and more in comparison with the national average are the following: the Oryov Oblast (81.8%), and the Republic of Bashkortostan (84.7%), the Mari El Republic (81.7%), the Republic of Tatarstan (84.6%), the Udmurt Republic (85%), the Chuvash Republic (82.8%) and the Orenburg Oblast (84.3%).
The average value of the territorial price index, calculated at the level of RF subjects, was 102% in 2003–2012. The maximum value of the standard deviation of the territorial price index was 24.9% in 2006, the minimum – 20.7% in 2012.
Figure 2. Dynamics of differences in regional price levels in 2003–2012
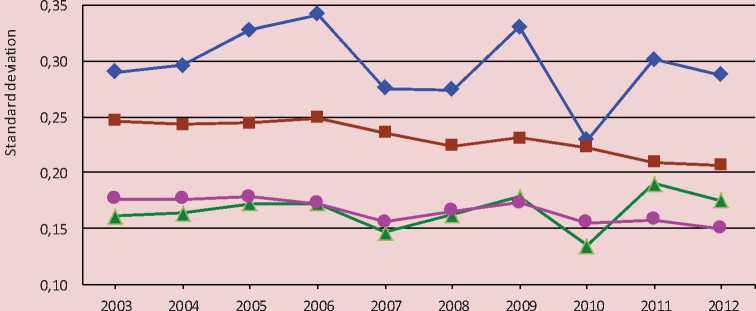
• Minimum set of food products (in Russia as a whole)
■ Fixed set of goods and services (in Russia as a whole)
* Minimum set offood products (without hard-to-reach regions
• Fixed set of goods and services (without hard-to-reach regions)
Calculated by: Federal State Statistics Service data. Available at: ; 1923006
To evaluate the dynamics of consumer prices for food products we have used another statistic indicator – the cost of a minimum set of food products.
The CPI analysis has revealed greater volatility in food prices. To verify the results, we have compared the values of the minimum set of food products with the dynamics of territorial levels of prices (fig. 2) .
The trajectory of the variations of territorial price levels, calculated on the basis of a fixed price for goods and services, indicates a downward trend in the territorial distribution of the price index. So, in 2003 the level was 25%, and in 2012 – 21%. Except for hard-to-reach regions the variation is in the range of 15–18%.
The volatility of food price differences, calculated on the basis of the cost of the minimum set of food products, is much higher. In 2003–2012 the average level of variation was 30%, without hard-to-reach regions – 17%, and deviations up and down from it in the first case were approximately 5%, and the second – 3%. Thus, it confirms the conclusion about larger dynamics of food prices in comparison with the dynamics of a general price level.
Taking into account the assessment of changes in the value of the minimum set of food products in different regions, it was found that the highest volatility of food prices is usually characteristic of regions with higher average price levels. So, in 2003–2012 the dynamics of variations in price levels, calculated on the basic of the cost of the minimum set of food products, at the level of 8% and more is measured in such regions, as Nenets Autonomous Okrug – 9.65% (the average level of prices –183%, the Sakha (Yakutia) Republic 8.68% (150%), Kamchatka Krai – 8,65% (171.7%), Primorsky Krai – 9,45% (132.2%), the Khabarovsk Oblast – 8.5% (130.2%), the Amur Oblast – 8.49% (113.22%), the Magadan Oblast – 10.27% (167.36%), the Sakhalin Oblast – 12.14% (153,17%), Chukotka Autonomous Okrug – 30.27% (279.51%). Large variations in food prices in the Sakha (Yakutia) Republic, Kamchatka Krai, Magadan and Sakhalin oblasts, and Autonomous Okrug are caused by the inaccessibility of these regions. However, the fact that food prices in the Far Eastern Federal District are characterized by high volatility seems quite interesting and unexpected.
Conclusion
The spatial analysis of the statistical indicators dynamics in 2003–2012, such as a consumer price index, the cost of a fixed set of goods and services and the cost of the minimum set of food products, has led to the following conclusions:
-
1. The highest price growth, followed by the period of decline, was observed in 2008 due to the financial crisis.
-
2. Prices for services and food products have the highest fluctuations in time. Firstly, it is caused by their immobility and less competitive markets, secondly, –the
-
3. Deviation of the consumer price growth rates and the cost of a fixed set of consumer goods and services from the average national level is insignificant in federal districts, with the largest deviations being typical for the FEFD, UFD and SFD; consequently, these regions are the least integrated at the national level.
-
4. Consumer prices at the level of RF subjects change unevenly, however, since 2009 the fluctuations in their growth rates have been decreasing.
-
5. The highest price volatility is observed in the RF hard-to-reach subjects that is why, these regions are the least integrated at the national level.
-
6. The highest price volatility is characteristic of the Far Eastern Federal District, which includes remote regions of the country. However, the highest volatility of food prices is typical not only for hard-to-reach regions of the Far East Federal district, but also for border regions of the district, indicating weak integrity of their food market at the national level.
seasonality of agricultural production to a certain extent. The lowest growth of prices for non-food goods is due to the greater competitiveness of their markets and the greater share of imports.
The last conclusion is quite interesting, since it raises new questions concerning the causes of the situation. Allegedly, they can be of different nature, including the following: influence of external markets, especially China markets, a high share of transport costs in the price of goods, low economies of scale due to limited local markets and monopolists’ impact.
Sited works
-
1. Vityaz’ P.A., Shcherbin V.K. Problems of designing new types of integration spaces. Economic and Social Changes: Facts, Trends, Forecast , 2013, no.3, pp. 28-45.
-
2. Glushchenko K.P. Consumer Prices in Russia in 1992–2000: Spatial Aspect. Region: Economics and Sociology , 2001, no.2, pp. 46-71.
-
3. Glushchenko K.P., Ivanov E.Yu., Nizhegorodtsev R.M. Modeling and Evaluation of the Dynamics of Integration of the Russian Market. Information and Economics: Theory, Models, Technology: Collected Scientific Works . Barnaul: Izd-vo Altaiskogo gos. un-ta, 2002. Pp. 200-206.
-
4. Glushchenko K.P. Integration of the Russian market. Empirical Analysis . Moscow: EERC, 2004. 84 p.
-
5. Glushchenko K.P. Regions of Russia in the First Half-Year of 2004. Region: Economics and Sociology , 2004, no.4, pp. 212-223.
-
6. Glushchenko K.P. The Law of One Price in the Russian Economic Space. Applied Econometrics , 2010, no.1, pp. 3-19.
-
7. Federal State Statistics Service, the Central Base of Statistical Data . Available at: http://www.gks.ru/wps/ wcm/connect/rosstat_main /rosstat/ru/statistics/tariffs/#
-
8. Tsyplakov A.A. Statistical Analysis of the Dynamics of Regional Price Levels . Available at: http://www. nsu.ru/exp/ref/Media:4edf329cc871dec 519000 3821-Tsyplakov.pdf
-
9. Berkowitz D., DeJong D.N. The Border inside the Russian Economic Space. Region: Economics and Sociology , 2000, no.1, pp. 85-99.
-
10. De Masi P., Koen V. Relative Price Convergence in Russia. IMF Staff Papers, 1996, Vol. 43(1), pp. 97-122.
-
11. Gardner B., Brooks K. Food Prices and Market Integration in Russia: 1992–93. American Journal of Agricultural Economics , 1994, no.76, pp. 641-646.
-
12. Goodwin B.K., Schroeder T.C. Cointegration Tests and Spatial Price Linkages in Regional Cattle Markets. American Journal of Agricultural Economics, 1991, no.73, pp. 452-464.
References Spatial behavior of prices in the Russian Federation in 2003-2012
- Federal'naya sluzhba gosudarstvennoi statistiki, Tsentral'naya baza statisticheskikh dannykh . Available at: http://www.gks.ru/wps/wcm/connect/rosstat_main/rosstat/ru/statistics/tariffs/#
- Vityaz' P.A., Shcherbin V.K. Problemy konstruirovaniya novykh tipov integratsionnykh prostranstv . Ekonomicheskie i sotsial'nye peremeny: fakty, tendentsii, prognoz , 2013, no.3, pp. 28-45.
- Glushchenko K.P. Potrebitel'skie tseny v Rossii v 1992-2000 gg.: prostranstvennyi aspekt . Region: ekonomika i sotsiologiya , 2001, no.2, pp. 46-71.
- Glushchenko K.P., Ivanov E.Yu., Nizhegorodtsev R.M. Modelirovanie i otsenka dinamiki integrirovannosti rossiiskogo rynka . Informatsiya i ekonomika: teoriya, modeli, tekhnologii: sb. nauch. trudov . Barnaul: Izd-vo Altaiskogo gos. un-ta, 2002. Pp. 200-206.
- Glushchenko K.P. Integrirovannost' rossiiskogo rynka. Empiricheskii analiz . Moscow: EERC, 2004. 84 p.
- Glushchenko K.P. Regiony Rossii v pervom polugodii 2004 goda . Region: ekonomika i sotsiologiya , 2004, no.4, pp. 212-223.
- Glushchenko K.P. Zakon edinoi tseny v rossiiskom ekonomicheskom prostranstve . // Prikladnaya ekonometrika , 2010, no.1, pp. 3-19.
- Federal'naya sluzhba gosudarstvennoi statistiki, Tsentral'naya baza statisticheskikh dannykh . Available at: http://www.gks.ru/wps/wcm/connect/rosstat_main/rosstat/ru/statistics/tariffs/#
- Tsyplakov A.A. Statisticheskii analiz dinamiki regional'nykh urovnei tsen . Available at: http://www.nsu.ru/exp/ref/Media:4edf329cc871dec519000 3821-Tsyplakov.pdf
- Berkowitz D., DeJong D.N. Granitsa vnutri rossiiskogo ekonomicheskogo prostranstva . Region: ekonomika i sotsiologiya , 2000, no.1, pp. 85-99.
- De Masi P., Koen V. Relative Price Convergence in Russia. IMF Staff Papers, 1996, Vol. 43(1), pp. 97-122.
- Gardner B., Brooks K. Food Prices and Market Integration in Russia: 1992-93. American Journal of Agricultural Economics, 1994, no.76, pp. 641-646.
- Goodwin B.K., Schroeder T.C. Cointegration Tests and Spatial Price Linkages in Regional Cattle Markets. American Journal of Agricultural Economics, 1991, no.73, pp. 452-464.
