Spatial co-location patterns on weather and forest fire data

Author: Imas S. Sitanggang, Sergi Roseli, Lailan Syaufina
Journal: International Journal of Information Technology and Computer Science @ijitcs
Article in issue: 9 Vol. 10, 2018.
Free access
One of problems that can increase the risk of forest fire occurrences in Indonesia is drought which is affected by weather conditions. Therefore, weather conditions and forest fire are strongly related. Spatial co-location pattern can be applied to identify the weather conditions that are vulnerable to fires based on the distance between weather observation points and hotspot occurrences. The purpose of this study is to apply the co-location miner algorithm on the weather and hotspot data in Rokan Hilir Riau Indonesia and to analyze the generated co-location patterns. Experimental results show that precipitation which co-located with hotspot occurrences are 0.08–6.69 mm/day. In addition, the temperature which co-located with hotspot occurrences are 22°C–29.17°C. Inside the intervals, hotspots will occur in the radius of 9.724 km from the precipitation and temperature observation points. In 2008, many hotspots were found on the three areas in the study area with the average of precipitation around 3.65–3.71 mm/day and temperature around 24.44°C–25.23°C.
Co-location pattern, forest and land fire, hotspot, Rokan Hilir, spatial data mining
Short address: https://sciup.org/15016293
IDR: 15016293 | DOI: 10.5815/ijitcs.2018.09.02
Text of the scientific article Spatial co-location patterns on weather and forest fire data
Published Online September 2018 in MECS DOI: 10.5815/ijitcs.2018.09.02
Indonesia forest resource is the second largest tropical forest in the world after Brazil. The forest has rich of biodiversity which is very important in maintaining environmental balance as the lungs of the world. Since the last two decades, Indonesia forest has faced frequent problem such as forest fire. Generally, the cause of forest fire problem can be classified in two groups which are natural and human factors. Many studies revealed that human activities have been the most important of fire causes in Indonesia, intentionally or unintentionally [1, 2, 3]. Such listed causes as arson, the facilitation of access to resources, and the clearing of land for swiddens and plantations have been identified as direct factors that caused of ignition events. Climate factor plays important role as supporting factor in influencing the forest fire occurences and fire behavior in Indonesia [4]. Weather factor affects fuel moisture content as well as soil humidity and fire spread. Therefore, forest fire supported factors need to be studied intensively to have better understanding in forest fire prevention, particularly for fire early warning system purposes.
Hotspot has been an indicator for forest fire or land fire occurrences. Hotspot is observed by remote sensing technology using satellite of Natural Oceanic Atmospheric Administration (NOAA) with Advanced Very High Resolution Radiometer (AVHRR) sensor which provides temperature information in a certain area. On satellite image, a pixel which has high screen temperature indicates fire called a hotspot.
A hotspot can represent the possible areas which are burnt but the areas which are actually burnt can’t be known [5]. The number of hotspot varies and is influenced by observation time (the number of fire activity in the night is low with the highest in the evening), weather (sensor which is used can’t penetrate cloud and smoke), and the organization provides the data (there is no exact threshold value for temperature to identify hotspot). Seemingly, not all hotspot is actual fire. Therefore, hotspot data verification need to be conducted to have accuracy figure of the hotspot. The information can be used to detect forest fire earlier.
Rokan Hilir is one of the regencies which has frequent forest and land fire problem in Riau Province. On August 2013, there were 468 hotspot in Riau, 51 of them found in Rokan Hilir [6]. It was the third highest hotspot among all the regencies in Riau. Most of forest fire in Riau occurred in peatland. In fact, dry peatland areas become one of the factors which increase forest fire risk in Riau. Dry peatland may be caused by several factors including human involvements, such as canal establishment which are used to drying peatland area. The condition will be worsen when prolonged dry season experienced by the area and hence a little fire source may come to spread out.
Studies on forest fire prediction have been done by many researchers. A statistical method and numerical procedure were applied in [7] to develop a probability model for estimating occurrences of large forest fires. In addition to statistical methods, data mining can be used in forest fires modelling. Spatial data mining application to hotspot occurrences has been conducted in several studies, for example clustering and classification. The applications can be very useful to prevent forest fire. Among other methods in data mining for analyzing spatial data is spatial co-location pattern mining which study relationship between the different objects in spatial scope. The relationship between weather condition and forest fire encourage the writer to apply spatial colocation pattern mining to weather and hotspot data for the co-location patterns between weather condition and hotspot occurrences to be identified. Co-location patterns can be used to identify the forest fire prone area as the important information in fire prevention. The benefit of this research is to support the relevant stakeholder on decision making process for forest fire prevention more effectively. The effectiveness of that decision making process can be improved by knowing the weather conditions based on the co-location that contribute to hotspot occurrences, hence the prevention efforts can be done earlier.
-
II. Spatial Co-location Pattern
Spatial co-location patterns represent subsets of boolean spatial features whose instances are often located in close geographic proximity [8]. The patterns also represent relationship between events which occurred in different neighbor location. Final output which is resulted from spatial co-location pattern is spatial co-location rules.
There are several approaches which can be used to discover co-location rules, they are spatial statistics and association rules approach [9]. Spatial statistics approach use measures of spatial correlation to characterize the relationship between different types of spatial features. That measurements including chi-square test, correlation coefficient, and spatial regression model. Meanwhile association rules approach focus on the transaction data generation. Association rules approach is one of data mining approaches to do co-location pattern mining [8]. One of the algorithms which can be used to discover colocation patterns is the co-location miner algorithm.
Co-location miner algorithm is an algorithm to generate all the co-location patterns and co-location rules that have prevalence values and conditional probabilities above the minimum prevalence and minimum conditional probability which has been selected [8]. Co-location patterns are used to generate co-location rules which form some predictions about features occurrences with certain interestingness. In the co-location miner algorithm, in the beginning, each data will be initialized to co-location set which has k=1 size, k is the number of co-location set member. Then, co-location rules which has size k=2 will be generated and it will be done several times until it reaches size k=the number of features which are used in the data. For each size k > 1 there will be participation index measurements which are used to generate colocation patterns at size k using spatial join neighbor relationship. Participation index values can be known by measuring the participation ratio in the beginning for size-k co-location c = {f1,….., fk}. The formula of participation ratio is as follows [8]:
, гл _ nfi(|table_instance(c)|
PrVC,ji) |table_instace(fj)|
π symbolizes the neighborhood relationship between the objects in the features which are observed, c is colocation, f i is the ith feature which is observed, |table_instance| represents number of objects in the dataset which save the values of c and fi in equation (1).
After measuring the participation ratio values, participation index can be measured by calculating the minimum value between participation ratio (pr) as follows [8]:
P i( c) = min k=1 {pr ( c,f i) } (2)
for size- k colocation c = {f 1 ,….,f k ). Participation index (pi) shows the signification from co-location patterns which are generated, pi is measured from pr which shows the influence of a certain feature to co-location patterns generation. If in the pi measurement, the maximum pr is selected then the pi value will be high. That matter will make the pi value refraction. It can be happened because the small pr value will be covered by the high one so the pi value that shows pattern signification will be refracted. Co-location rules generation are done by measuring conditional probability from each pattern which are generated beforehand and comparing it to the minimum conditional probability as threshold value. The formula of conditional probability measurement is as follows [8]:
|nc1(table instance({c1uc2}))| |table_instace({c1})|
π symbolizes the neighborhood relationship between the objects in the features which are observed, c 1 and c 2 are the co-location pattern of size-1 and size-2 respectively.
-
III. Research Method
-
A. Data and Data Source
This study used hotspot and weather data in Rokan Hilir. Riau province Indonesia in the year of 2008. The weather data including precipitation (mm/day) and temperature (K) monthly data are represented as grid. The weather data were obtained from Meteorological Climatological and Geophysical Agency (BMKG) in.csv format which are the modeling results and have been processed by Ref. [10] and hotspot data were obtained from FIRMS MODIS Fire/Hotspot, NASA/University of Maryland. Spatial data processing was performed to the data using co-location pattern mining method called the co-location miner algorithm introduced by Ref. [9] with the measurement of participation index and conditional probability as its threshold [8].
-
B. Research Steps
The steps conducted in the co-location miner algorithm implementation to discover the co-location patterns are data selection, co-location miner algorithm implementation, and co-location pattern analysis.
-
1) Data Selection
Data selection was done to the precipitation, temperature, and hotspot data in Rokan Hilir. This step was done by selecting some attributes based on the analysis needs. There were also some attributes adddition to the data in order to make the connectivity among the data in database which can make the implementation process easier. All of the data which are used in this research are managed by DBMS PostgreSQL 9.1.
The former database had three tables which are hotspot, precipitation, and temperature tables. At first, hotspot data has nine attributes which are lat, long, satellite, orbit, time, date, source, province, and region_city. Then satellite, orbit, time, source, and province attributes were deleted from hotspot data. After that, a query was applied to select record data based on the area study, it was select * from hotspot where region_city=’ROKAN HILIR’. There were two attributes which were added into the hotspot table. That attributes were hid as the primary key for hotspot table and month as the marker of monthly hotspot occurrences. Table I shows examples of hotspot data which were used in this study.
Precipitation data has 17 attributes which are gid, long, lat, the_geom, rnd01, rnd02, rnd03, rnd04, rnd05, rnd06, rnd07, rnd08, rnd09, rnd10, rnd11, rnd12, and rnd_ave. Attributes which has rnd as prefix are the precipitation values on a certain point and month, for example rnd01 is the precipitation value on January 2008. On the other hand, rnd_ave is the annual precipitation value average from a certain point. In the precipitation data, the_geom attribute was deleted because it was not needed on the colocation pattern analysis in this study.
Temperature data has 17 attributes which are tid, long, lat, the_geom, tscrn01, tscrn02, tscrn03, tscrn04, tscrn05, tscrn06, tscrn07, tscrn08, tscrn09, tscrn10, tscrn11, tscrn12, and tscrn_ave. Attributes which has tscrn as prefix are the temperature values on a certain point and month, for example tscrn01 is the temperature value on January 2008. On the other hand, tscrn_ave is the annual precipitation value average from a certain point. In the temperature data, the_geom attribute was deleted because it is not needed on the co-location pattern analysis in this research.
-
2) Co-location Miner Algorithm Implementation
In this step, co-location miner algorithm was implemented to precipitation, temperature, and hotspot data in Rokan Hilir using the programming language Python 3.3. The co-location miner algorithm implementation resulted the co-location patterns between hotspot occurences and weather condition which happen in Rokan Hilir. Then this patterns were used to generate co-location rules.
-
3) Co-location Patterns Analysis
In this step, the final results which were co-location patterns and co-location rules were discovered as the results of co-location miner algorithm implementation. Then that final results were analyzed so the relationship between weather condition and hotspot occurrences in Rokan Hilir could be known based on the co-location pattern mining approach. In the process, the results were visualized using Quantum GIS 2.0.1 to make the analysis easier.
-
IV. Results and Discussion
The results of data selection which were stored in database were used for the co-location pattern mining. Data records in the three former tables (hotspot table, precipitation table, and temperature table) which were stored in database were considered as co-location pattern size-1 so there were three types of co-location patterns, they were hotspot, precipitation, and temperature. In the implementation process of co-location miner algorithm, it is important to decide neighborhood relationship between the objects in each features which are observed. In this research, neighborhood relationship was decided based on the object distances. To generate co-location patterns size-2, Euclid distance with combinatorial approach were measured. Each objects in each features were paired and the Euclid distance between them were used to decide whether they were neighbor or not. That processes were done because only the neighbor objects that could form co-location.
Table 1. Example of Hotspot Data
|
hid |
lat |
long |
date |
region_city |
month |
|
1 |
1.454 |
100.833 |
20080101 |
ROKAN HILIR |
1 |
|
2 |
1.598 |
100.797 |
20080105 |
ROKAN HILIR |
1 |
|
377 |
1.364 |
101.012 |
20081203 |
ROKAN HILIR |
12 |
In this study, certain object pair was called co-located if the distance between them was less than 0.0875 which means that the object pair was neighbor. The value 0.0875 is the distance between the object points in precipitation and temperature data divided by two. Precipitation and temperature data which are grid data have the same coordinate values, the difference between the two is the feature which is observed, which are precipitation and temperature values. In this research, precipitation and temperature variable were considered as the cause factor of hotspot occurrences so in this case, the thing that will be analyze is co-location patterns between the cause factor and the aftermath. Maximum distance value 0.0875 was selected with an assumption that certain hotspot occurrence would be affected by its nearest neighbor which was an object from precipitation and temperature variable so a half from the total distance between the observation points of precipitation and temperature would show the precipitation and temperature value which affected hotspot occurrences around them. In this matter, maximum distance can be said as the limit distance value from a certain object in precipitation and temperature affection to hotspot occurrences. Fig. 1 and Fig. 2 show the observation location of precipitation and temperature values and the location of hotspot occurrences in Rokan Hilir in the year of 2008.
After the co-location size-1 were generated, colocation candidate of size-2 were generated by pairing each hotspot objects to the one in the precipitation table and temperature table. If the co-location candidates which were generated were not the nearest neighbor, that candidate would be removed from the co-location size-2 tables. After the co-location patterns size-2 were generated, participation index value would be measured by measuring the participation ratio value first for each co-location pattern size-2. Participation ratio (pr) was measured by using equation (1) and participation index (pi) was measured by using equation (2) to the colocation patterns from the co-location size-2.
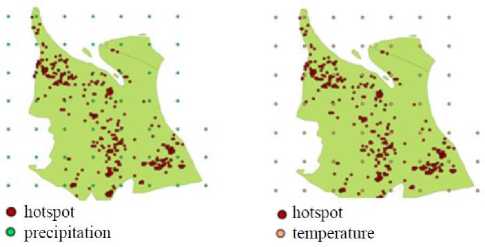
Fig.1. Precipitation and hotspot
Fig.2. Temperature and hotspot
Participation index is used to prune the co-location candidates by comparing the participation index value and minimum prevalence which decided by user. This pruning was done to decrease the amount of co-location candidates which were generated for the next co-location size by increasing or decreasing minimum prevalence value. There were some experiments which were done to get the best threshold for minimum prevalence by changing the value of it. Table II shows the amount of possible co-location pattern objects size-3 which were generated from co-location size-2 when the minimum prevalence value was changing.
Based on the result in Table II, it could be known that minimum prevalence value’s change from 0.1 to 0.4 was not affect the amount of co-location patterns which were generated in co-location size-3. On the other hand, minimum prevalence value’s change from 0.5 and above would affect the amount of co-location patterns in colocation size-3. In spite of that, minimum prevalence value > 0.5 would result the same amount of co-location patterns as the one that resulted by using 0.5 as the minimum prevalence. The usage of precipitation and temperature data which are grid data cause the colocation pattern objects which are generated between hotspot-precipitation and hotspot-temperature have the same amount because of the same observation point between the two features. Participation index value that each co-location pattern size-2 had, could show that if minimum prevalence value ≥ 0.419, there was no colocation pattern size-3 that would be generated because there was no co-location pattern size-2 which meet the threshold value. Therefore the best minimum prevalence which was selected was the value that less than 0.419 so co-location pattern size-3 could be generated. Meanwhile the exact value of minimum prevalence did not really matter as long as it less than 0.419 because they would result the same amount of co-location patterns. In this discussion, the minimum prevalence value 0.2 was used.
Table 2. Results of Minimum Prevalence Experiment
|
Minimum prevalence |
Co-location pattern size-2 |
Co-location pattern size-3 |
|
|
HotspotPrecipitation |
HotspotTemperature |
HotspotPrecipitationTemperature |
|
|
0.1 |
282 |
282 |
282 |
|
0.2 |
282 |
282 |
282 |
|
0.4 |
282 |
282 |
282 |
|
0.5 |
282 |
282 |
0 |
|
0.6 |
282 |
282 |
0 |
After pruning process using minimum prevalence, the result would be used as co-location size-3 candidates. In this matter, co-location pattern size-3 would be generated from co-location pattern size-2 which were hotspotprecipitation and hotspot-temperature. Co-location pattern candidates which were generated would be evaluated based on the neighbor relationship then colocation pattern size-3 would be resulted.
In this study, co-location pattern mining was done until co-location pattern size-3 was generated because there were only three features which were observed which were hotspot, precipitation, and temperature. Therefore after co-locaion pattern size-3 were obtained, the colocation rules would be generated. Those co-location rules were generated in each iteration in the co-location patterns generation by measuring conditional probability value for each possible rules in each iteration and comparing it with the minimum conditional probability value as a threshold. In Table III, the conditional probability (cp) value for Hotspot ^ Precipitation was 0.748 and for Precipitation ^ Hotspot was 0.419. Table III shows conditional probability value that each possible co-location rule had.
Table 3. Co-location Rules and its Conditional Probability
|
Conditional probability |
Co-location rule |
|
0.748 |
Hotspot ^ Precipitation |
|
0.419 |
Precipitation ^ Hotspot |
|
0.748 |
Hotspot ^ Temperature |
|
0.419 |
Temperature ^ Hotspot |
|
0.911 |
Hotspot, Precipitation ^ Hotspot, |
|
Temperature |
|
|
0.911 |
Hotspot, Temperature ^ Hotspot, |
|
Precipitation |
Table 4. Co-location Rules and its Minimum Conditional Probability
|
Minimum conditional probability |
Co-location rules |
|
0.1 |
Hotspot ^ Precipitation Precipitation ^ Hotspot Hotspot ^ Temperature Temperature ^ Hotspot |
|
Hotspot, Precipitation ^ Hotspot, Temperature Hotspot, Temperature -> Hotspot, Precipitation |
|
|
Hotspot ^ Precipitation Precipitation ^ Hotspot |
|
|
0.3 |
Hotspot -> Temperature Temperature ^ Hotspot |
|
Hotspot, Precipitation ^ Hotspot, Temperature Hotspot, Temperature ^ Hotspot, Precipitation |
|
|
Hotspot ^ Precipitation |
|
|
0.5 |
Hotspot -> Temperature Hotspot, Precipitation ^ Hotspot, Temperature Hotspot, Temperature ^ Hotspot, Precipitation |
|
0.8 |
Hotspot, Precipitation -> Hotspot, Temperature Hotspot, Temperature ^ Hotspot, Precipitation |
There were some experiments which were done to get the best threshold for minimum conditional probability by changing the value of it. Table IV shows the co-location rules which were generated for different minimum conditional probability value. Based on the result in Table IV, the value that less than 0.5 would be selected as minimum conditional probability value, for example 0.3. On the other side, conditional probability value 0.5 resulted “Hotspot ^ Precipitation” and “Hotspot ^ Temperature” rule from the co-location pattern size-1. Hotspot takes a role as the cause in both of the rules, meanwhile in this research, the one that would be observed and analyzed was the influence of precipitation and temperature towards hotspot occurrences. By using 0.5 as minimum conditional probability, the two rules could not be generated meanwhile by using 0.8 as minimum conditional probability, only the rules which were generated from co-location pattern size-2 that would be obtained. The most important thing is that in colocation pattern mining using co-location miner algorithm, the rules which are generated are only the feature which are observed generally as shown in Table IV not the exact objects of the features. It could be that way because in the pruning process using conditional probability, the values which were considered was the amount of object occurrences from a certain feature in the generated colocation patterns. The conditional probabilities were measured for each iteration since the second iteration.
Indonesia is divided into three climate areas based on the annual rainfall cycle [11]. Fig. 3 shows the three distribution areas in Indonesia based on the rainfall cycle.
Based on climate distribution areas, Rokan Hilir is included in region B as semi monsoon climate, which has two rainfall peak periods, namely: October-December and March-May.
Climate or weather affects forest fuel moisture [4]. Forest fuel originated from vegetation, living and dead materials. Ref. [12] shows that weather elements such as temperature, relative humidity, evaporation, the length of the sun radiation, sun radiation intensity, wind speed, and precipitation affect the water content of forest fuel. Fuel moisture content is affected by drought strongly. Drought information can be used to determine the risk of forest fire [4]. Drought is strongly correlated with precipitation and temperature so the two weather factors can be used as hotspot occurrences indicator. The relationship between weather condition and hotspot occurrences can be seen from the correlation values between them. The correlation between hotspot and precipitation is -0.067 and the correlation between hotspot and temperature is 0.232. Majority hotspots in Rokan Hilir were found on peatland which has irreversible drying characteristic when extensively exposed to the sun radiation made it difficult to absorb water when dry.
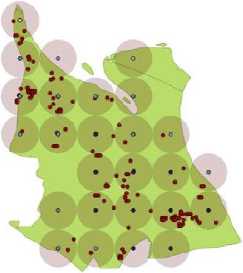
By using the minimum prevalence value 0.2 and minimum conditional probability 0.3, there are 282 colocation pattern objects and 6 co-location rules. Fig. 4 and Fig. 5 show the result of co-location patterns between hotspot, precipitation, and temperature in August 2008.
-
• Hotspot Precipitation
О 2.8-3.6tnm/day о 3.6-4.4mm/day
-
• 4.4 - 5.2 mm/day
Fig.4. Co-location pattern (hotspot and precipitation) plotting August 2008
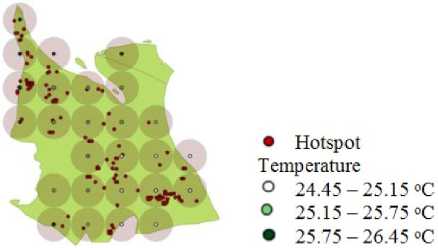
Fig.5. Co-location pattern (hotspot and temperature) plotting August 2008
The highest hotspot found in August in 2008 of about 125 hotspots. It corresponds to the annual rainfall cycle for Rokan Hilir, whereby August has low precipitation. In majority, the hotspots are co-located with the weather observation point which has precipitation value between 3.6 – 4.4 mm/day and 4.4 – 5.2 mm/day and temperature value between 25.15 – 25.75 oC and 25.75 – 26.45 oC.
Table V shows precipitation and temperature values which are highly co-located with hotspots from January
|
until December 2008. |
That values can be used as a high |
amount of water content in forest fuel. |
||||||||||
|
hotspot occurrences indicator and implicated towards the |
||||||||||||
|
Table 5. Precipitation (mm/day) and temperature (oC) values which |
are highly co-located with hotspots in Rokan Hilir 2008 |
|||||||||||
|
Month |
||||||||||||
|
Pattern |
January |
February |
||||||||||
|
Precipitation |
Temperature |
Precipitation |
Temperature |
|||||||||
|
min |
max |
avg |
min |
max |
avg |
min |
max |
avg |
min |
max |
avg |
|
|
1 |
0.5 |
5.9 |
3.9 |
21.55 |
27.45 |
24.55 |
0.4 |
5.9 |
3.7 |
21.85 |
26.85 |
24.35 |
|
2 |
0.3 |
6.3 |
3.7 |
21.85 |
28.85 |
25.15 |
0.6 |
5.9 |
3.7 |
21.85 |
26.65 |
24.35 |
|
3 |
0.6 |
5.9 |
3.7 |
21.85 |
26.65 |
24.35 |
0.4 |
5.3 |
3.4 |
21.85 |
27.55 |
24.75 |
|
March |
April |
|||||||||||
|
Precipitation |
Temperature |
Precipitation |
Temperature |
|||||||||
|
min |
max |
avg |
min |
max |
avg |
min |
max |
avg |
min |
max |
avg |
|
|
1 |
0.6 |
5.9 |
3.7 |
21.85 |
26.65 |
24.35 |
0.4 |
5.9 |
3.7 |
21.85 |
26.85 |
24.35 |
|
2 |
0.5 |
5.7 |
3.7 |
21.65 |
27.45 |
24.55 |
0.5 |
5.9 |
3.8 |
21.55 |
27.35 |
24.55 |
|
May |
June |
|||||||||||
|
Precipitation |
Temperature |
Precipitation |
Temperature |
|||||||||
|
min |
max |
avg |
min |
max |
avg |
min |
max |
avg |
min |
max |
avg |
|
|
1 |
0.5 |
5.9 |
3.9 |
21.55 |
27.45 |
24.55 |
0.4 |
5.9 |
3.7 |
21.85 |
26.85 |
24.35 |
|
2 |
0.4 |
5.9 |
3.7 |
21.85 |
26.85 |
24.35 |
0.4 |
5.8 |
3.8 |
21.55 |
27.55 |
24.55 |
|
3 |
0.3 |
6.3 |
3.7 |
21.85 |
28.85 |
25.15 |
0.4 |
5.3 |
3.4 |
21.85 |
27.55 |
24.75 |
|
July |
August |
|||||||||||
|
Precipitation |
Temperature |
Precipitation |
Temperature |
|||||||||
|
min |
max |
avg |
min |
max |
avg |
min |
max |
avg |
min |
max |
avg |
|
|
1 |
0.6 |
5.9 |
0.6 |
5.9 |
0.6 |
5.9 |
0.6 |
5.9 |
0.6 |
5.9 |
0.6 |
5.9 |
|
2 |
0.3 |
6.3 |
0.3 |
6.3 |
0.3 |
6.3 |
0.3 |
6.3 |
0.3 |
6.3 |
0.3 |
6.3 |
|
3 |
0.5 |
5.9 |
0.5 |
5.9 |
0.5 |
5.9 |
0.5 |
5.9 |
0.5 |
5.9 |
0.5 |
5.9 |
|
September |
November |
|||||||||||
|
Precipitation |
Temperature |
Precipitation |
Temperature |
|||||||||
|
min |
max |
avg |
min |
max |
avg |
min |
max |
avg |
min |
max |
avg |
|
|
1 |
0.6 |
5.9 |
0.6 |
5.9 |
0.6 |
5.9 |
0.6 |
5.9 |
0.6 |
5.9 |
0.6 |
5.9 |
|
2 |
0.4 |
5.9 |
0.4 |
5.9 |
0.4 |
5.9 |
0.4 |
5.9 |
0.4 |
5.9 |
0.4 |
5.9 |
|
December |
||||||||||||
|
Precipitation |
Temperature |
|||||||||||
|
min |
max |
avg |
min |
max |
avg |
|||||||
|
1 |
0.6 |
5.9 |
3.9 |
21.55 |
26.95 |
24.35 |
||||||
|
2 |
0.5 |
5.9 |
3.8 |
21.45 |
27.75 |
24.65 |
||||||
Based on the co-location patterns which are generated between hotspot, precipitation, and temperature, it is known that precipitation values which are highly colocated with hotspot occurrences are between 0.08-6.69 mm/day meanwhile the temperature values are between 21.41oC – 29.12oC. From that result, it can be concluded that hotspot will occur around the weather observation points which have precipitation and temperature values in that range with radius 0.0875 degree or around 9.724 km.
During 2008, there are 26 precipitation and temperature observation points which are co-located with 282 hotspots. From the result of co-location pattern mining, it is known that there are some precipitation and temperature observation points which are highly colocated with hotspot occurrences, the location of that observation points are shown in Table VI.
Information about the locations along with the precipitation values which are obtained from co-location pattern mining can be used to know about the fire prone areas in Rokan Hilir for better fire prevention. The weather condition which form the most co-location pattern with hotspot can also be determined through the result of co-location pattern mining as shown in Table VI. Fig. 6 shows the plotted location of precipitation and temperature observation.
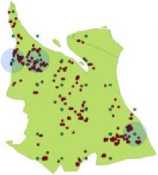
Fig.6. Plot of three precipitation and temperature observation points which are highly co-located with hotspot in Rokan Hilir
• hotspot
• precipitation and temperature
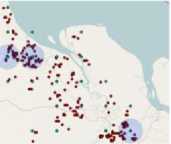

Table 6. The location of three precipitation and temperature observation points which are highly co-located with hotspot occurrences in Rokan Hilir 2008
|
Coordinate |
Precipitation Temperature Hotspot Village/ average (mm/day) average (oC) amounts Subdistrict |
|
(100.514, 2.06587 (101.2339, 1.52695 |
3.69 24.85 44 Sungai Kubu/Kubu 3.66 24.40 40 Ujung Tanjung/ Tanah Putih |
|
(100.334, 2.06587) |
Sungai 3.71 25.18 31 Daun/Pasir Limau Kapas |
V. Summary
The weather condition correspond to high hotspot number around the weather observation points in radius 9.724 km can be determined using the co-location miner algorithm. Besides, the fire prone areas with high hotspot has also been determined. The information is very important for decision making process in forest fire prevention. The result of this study shows that the precipitation values which are co-located with hotspot occurrences are in the range of 0.08 – 6.69 mm/day, meanwhile the temperature are in the range of 22oC – 29.17oC. Based on the co-location patterns which were generated from hotspot, precipitation, and temperature data in 2008, there are three areas in Rokan Hilir that should be concerned, namely: Desa Sungai Kubu Kecamatan Kubu, Desa Ujung Tanjung Kecamatan Tanah Putih, and Desa Sungai Daun Kecamatan Pasir Limau Kapas. In those areas, hotspots found around the weather observation points which have average precipitation value around 3.65 – 3.71 mm/day and average temperature around 24.44oC – 25.23oC so the possibility of forest fire in that areas are higher than that of in Rokan Hilir. It seems that minimum prevalence and minimum conditional probability threshold were not really affect the generated co-location patterns in this case because of the precipitation and temperature grid data usage in this study. It is difficult to see the pruning influence in the co-location miner algorithm because the two data will have the same minimum prevalence value when they are co-located with hotspot since they are located on the same spots.
References Spatial co-location patterns on weather and forest fire data
- G. Applegate, U. Chokkalingam, and S. Suyanto, “The underlying causes and impact of fires in Southeast Asia, final report,” Center for International Forestry Research, 2001.
- C.J.P Colfer, “Ten propositions to explain Kalimantan’s fires – a view from the field,” in Colfer CJP, Resosudarmo IAP, editors. Which Way Forward? Forests, Policy and People in Indonesia. Washington, D.C., and Bogor, Indonesia: Resources for the Future, an RFF Book, 2002, pp. 309–324.
- S. Suyanto, “Fire, deforestation and land tenure in the north-eastern fringes of Bukit Bukit Barisan Selatan National Park, Lampung.” Center for International Forestry Research (CIFOR), 2000, Available from: http://www.cifor.cgiar.org/fire/pdf/pdf71.pdf
- L. Syaufina. “Kebakaran hutan dan lahan di Indonesia perilaku api, penyebab, dan dampak kebakaran [Forest and land fire in Indonesia fire behavior, causes, and fire impact],” Malang (ID): Bayumedia Publishing (in Bahasa), 2008.
- S.C. Heryalianto, “Studi tentang sebaran titik panas (hotspot) sebagai penduga kebakaran hutan dan lahan di Propinsi Kalimantan Barat tahun 2004,” Thesis, Bogor (ID): Institut Pertanian Bogor, (in Bahasa), 2006.
- BNPB, “Data titik panas Provinsi Riau versi satelit NOAA-18, (Bulan Agustus 2013),” 2013 [accessed on 2014 Jun 5]. Available from: http://geospasial.bnpb.go.id/monitoring/hotspot/. (in Bahasa)
- Y. Shi, “A Probability Model for Occurrences of Large Forest Fires,” I.J. Engineering and Manufacturing, vol. 2(1), 2012, pp. 1-7.
- S. Shekhar, Y. Huang, and H. Xiong, “Discovering co-location patterns from spatial datasets: a general approach,” IEEE Transactions on Knowledge and Data Engineering, vol.16(12), 2004, pp. 1472-1485.
- S. Shekhar and Y. Huang, “Discovering spatial co-location patterns: a summary results,” Advances in Spatial and Temporal Databases, 2001.
- I.S. Sitanggang, R. Yaakob, N. Mustapha, and A.N. Ainuddin, “Predictive models for hotspots occurrences using decision tree algorithms and logistic regression,” Journal of Applied Sciences, Vol. 13(2), 2013, pp. 252-261.
- E. Aldrian and R.D. Susanto, “Identification of three dominant rainfall regions within Indonesia and their relationship to sea surface temperature,” International Journal of Climatology, vol. 23, 2003, pp. 1435–1452.
- W. Rastioningrum, “Hubungan unsur-unsur iklim dengan kadar air dalam proses pengeringan bahan bakar di hutan sekunder Jasinga dan perilaku api,“. Thesis, Bogor (ID): Institut Pertanian Bogor, (in Bahasa), 2004.
