Speckle images of the vessels and hydrodynamic phantoms in optical coherence tomography

Author: Chereshnev V.O., Proskurin S.G.
Journal: Cardiometry @cardiometry
Section: Original research
Article in issue: 29, 2023.
Free access
The results of a study of a series of sequential images of a vessel and a hydrodynamic phantom of biological tissues obtained using a Spectral Domain Optical Coherence Tomography (SP OCT) are presented. Acquired data were processed and histograms of speckle distributions were created. They demonstrated differences in the intensity distribution for three different areas of the OCT image: (1) free space, (2) wall of the vessel, and (3) the flow of scatterers. Using an optimization algorithm the histograms were approximated by various distribution functions, best result was demonstrated by the beta distribution with the determination coefficient R2 ~ 0.95. The resulting distributions quantitatively demonstrate effect of tissue heterogeneity. They show significant differences in the values of the shape and scale parameters, corresponding to the obtained beta distribution parameters, which were α ~ 1.7, β ~ 20.5 for free space, α ~ 3.1, β ~ 5.5 for the wall region of the phantom, α ~ 2.6, β ~ 1.7 for the flow of the scattering liquid. Variance matrices of the OCT images, which show correlation of speckles between adjacent pixels and those of the successive images were also obtained. Brighter areas of the variance matrix indicate a dynamic speckle structure in OCT images, while low brightness of the areas indicates static speckle structure, on the contrary.
Optical coherence tomography, hydrodynamic phantom, image processing, pixel intensity distribution, speckle structure, variance matrix
Short address: https://sciup.org/148327842
IDR: 148327842 | DOI: 10.18137/cardiometry.2023.29.4046
Text of the scientific article Speckle images of the vessels and hydrodynamic phantoms in optical coherence tomography
phy. Cardiometry; Issue No. 29; November 2023; p. 40-46; DOI: 10.18137/cardiometry.2023.29.4046; Available from: http://www.
Structure and parameters study of nonstationary flows in biological objects requires the development of specific methods that make it possible to obtain quantitative information in the real time, keeping the integrity of biological objects (non-invasively). Accurate information acquisition about the flows is difficult due to by the complex structure of the objects, optical heterogeneity, and different sizes of inclusions. The problem also lies in choosing the level of permissible power density of the probing optical radiation in order to avoid the inhibitory effect on the investigated objects. A Doppler system must be capable of recording velocities in the range of 1-500 μm/s with probe volume of the order of 5 μm3. The described characteristics are best met by optical research methods, Optical Coherence Tomography [1, 2] in particular.
Optical coherence tomography (OCT) is a non-in-vasive biomedical imaging technique that shows great potential for real-time imaging of biological flows and tissues at high resolution down to the micron scale. No other diagnostic method can currently provide such accuracy and speed of constructing multidimensional images during in vivo studies. That is why OCT took special place in biological studies of biological objects and living organisms [3].
OCT demonstrates particular success in early diagnostics and monitoring the skin cancer. By constructing cross-sectional images of the skin with a resolution of several microns, OCT allows one to visualize the structure of the epidermis, dermis, subcutaneous layers and subcutaneous vessels, which makes it possible to identify the earliest changes in the development of various cancers [4]. OCT can also be used to differentiate different types of cancer, including basal cell carcinoma (BCC), squamous cell carcinoma (SCC), and melanoma. OCT images of BCC and SCC often show the presence of abnormal cells and disordered structures in the skin layers. In contrast, OCT images of melanoma often show uneven pigmentation and changes in epidermal thickness. OCT can also be used to monitor the effectiveness of the treatment such as topical therapy and photodynamic therapy. Monitoring microstructure changes in skin and vasculature over time using OCT allows one to assess the treatment response and identify any residual cancer tissue [5, 6] and microvasculature changes.
In addition to diagnostics of skin malignancies, the important application of OCT is subcutaneous blood vessels visualization. It became possible to see them in vivo applying raster averaging and increasing coherence probing depth (CPD) [7]. It is necessary to identify abnormal vascular structures associated with a variety of diseases such as diabetes and atherosclerosis. OCT can detect changes in vessel wall thickness and lumen diameter, as well as the presence of plaques and other abnormalities, allowing for early diagnosis and treatment of these conditions. For example, when studying diabetes, OCT can be used to measure the thickness of the blood vessels in the retina, an important indicator of diabetic retinopathy, a condition that can lead to blindness if left untreated. OCT can also be used to measure carotid artery wall thickness, which is a strong predictor of cardiovascular events in patients with diabetes. In the study of atherosclerosis, OCT can be used to visualize the thickness and structure of the intima-media complex, as well as to detect lipid deposits and other signs of plaque growth in the arterial wall [7, 8].
OCT relies on the use of low-coherence light sources, such as superluminescent diodes or mode-locked lasers, to create interference patterns between back-scattered light from tissue and a reference beam. These patterns are recorded by the detector and analyzed to create images of the microstructure of the tissue. Interference of coherent light scattered by various tissue structures, including cells, organelles and extracellular matrix, causes speckle structures to appear on OCT images [9], which in practice significantly complicates the differentiation of tissue types. To reduce speckle influence, it is customary to use methods of averaging, wavelet transform, and image post-processing [10-12]. However, OCT speckle structure analysis can give additional information about tissue layers in vivo [13–15].
The purpose of the work is to study the patterns of speckle intensity distributions in images of phantoms, biological tissues and scattering liquids obtained using Optical Coherence Tomography.
Materials and methods
For the study, a spectral optical coherence tomography system (OCT 1300 E, Institute of Applied Phys- ics RAS, Russia) with the following characteristics was used: central wavelength 1300 nm; source spectrum width 50 nm; SLD source power 0.6 mW; depth resolution (in air) 10-15 μ; scanning range (vertical axis) 1.25 mm.
Phantoms with optical properties close to real biological tissues and possessing capillary networks were used as models of biological objects. The phantoms were made on the basis of PVC plastisol with scattering TiO2 nanoparticles. Their optical properties were assessed by spectrophotometric measurements.
B-scans of the tissue phantoms obtained using OCT are shown in Figure 1.
a)
b)
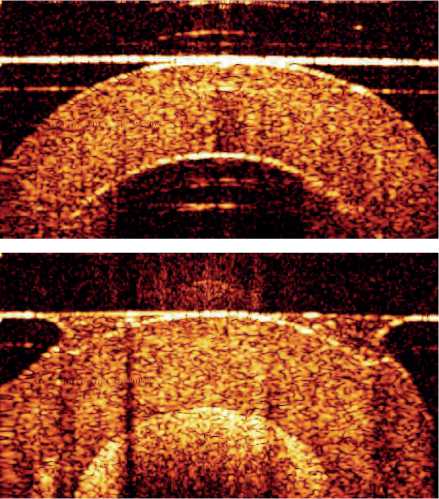
Figure. 1 – OCT images of the phantoms without a flow of scat-terers (a) and with a flow of scatterers in the liquid (b), size of the images ~2×2 mm. Patchy structure shows speckles and demonstrate different optical properties
The optical properties of a sample under the study, including its scattering and absorption coefficients, refractive index and anisotropy parameter, have a direct impact on speckle fluctuations in OCT images. Tissues with higher scattering coefficients tend to have more speckle fluctuations due to more scattering events in the probe volume. In turn, tissues with a higher absorption coefficient should have a speckle structure of lower intensity, since fewer photons are able to penetrate the tissue and be reflected back to the detector [16, 17]. In addition to scattering and absorption, the anisotropy parameter can also influence the speckle structure. This is because at a high anisotropy parameter, scattered photons are more likely to con- structively interfere, resulting in a more uniform intensity distribution. From the above it follows that the intensity and structure of speckles should be directly related to the optical properties of tissues and can be assessed throughout appropriate analysis.
To test this hypothesis, a histogram has been made, which is a statistical probability representation of the speckle intensity values of OCT images depending on the frequency of occurrences. In this context, the results of histogram analysis are mostly influenced by the speckles of OCT images because homogeneous tissue structures will produce a narrow pixel intensity distribution, while heterogeneous speckle structures will produce a broader speckle intensity distribution.
To construct a histogram, many areas of the same size were selected, corresponding to areas of free space, the walls of the hydrodynamic phantom and the biological fluid flow phantom. Subsequently, the resulting histograms were averaged over several consecutively recorded images to minimize errors and find the correct form of the pattern, and were also approximated using the least squares method with various functions, in particular the gamma distribution, which has already demonstrated effectiveness in differentiating various structures [18-22], which is a generalization of the χ2 distribution (1) and, accordingly, the exponential distribution:
a f 1)2 I 2 J a -i —
X2( X ) = X 2 e 2, (1)
rf a )
12 J where n is the number of degrees of freedom:
x = £ X^, f (x, a, p) = x' pae"ex, (2)
Г(а)
Г - is the Euler gamma function: Г(а) =
And also beta distribution:
j x а 1 e Xdx .
f ( x , а , P , A , B ) =
1 Г ( а + Р ) f x - A ^ f B - x Y
B - A Г ( а ) Г ( р ) ( B - A J ( B - A J
A < x < B .
The parameters α and β are known as the shape and scale parameters, respectively, A , B are the left and right boundaries of the change in x .
When examining patterns in speckle distributions, it is also important to consider that fluid movement can cause changes in the scattering properties of the fluid, which can affect the speckle structure in OCT images. In a stagnant liquid, the interference pattern will be stationary, which will lead to a static speckle structure, while in a fluid flow, movement can cause a change in the scattering pattern, which will lead to dynamic changes in the speckle structure. In order to characterize dynamic changes in the speckle structure of OCT images, it is proposed to construct a variance matrix of OCT images:
— ^ (x, - x )2 n = , n -1
where n was selected experimentally to obtain the best image contrast.
Results and discussion
As a result of the OCT image processing of the hydrodynamic phantom, histograms of pixel intensities were obtained, characterizing the distribution of speckles for different parts of the phantom, Figure 2.
The resulting histogram of speckle distribution for the free space (FS) is presented in Fig. 2, a, b with a blue line, its corresponding distributions are presented in Fig. 2, a, b, c, where red corresponds to the gamma distribution (GD), green the color corresponds to the beta distribution (BD). The histogram of speckle distribution for the phantom wall region (PW) is presented in Fig. 2, d), e) by a blue line, its corresponding distributions are presented in Fig. 2, d), e), f), where the red color corresponds to the gamma distribution, green color corresponds to the beta distribution. The histogram of speckle distribution for the flow region with scatterers (FF) is presented in Fig. 2, g), h) with a blue line, its corresponding distributions are presented in Fig. 2, g), h), i), where red color corresponds to the gamma distribution, green color corresponds to beta distribution. The initial data (ID) and the corresponding beta and gamma distributions are presented in Fig. 2, j), k), l), respectively, where the purple color corresponds to the distributions for the free space region, the green color corresponds to the distributions for the phantom wall region, and the red color corresponds to distributions for the flow region.
Approximation of histograms with various distribution functions shows that the distribution of speckles in OCT images of biological tissue phantoms is
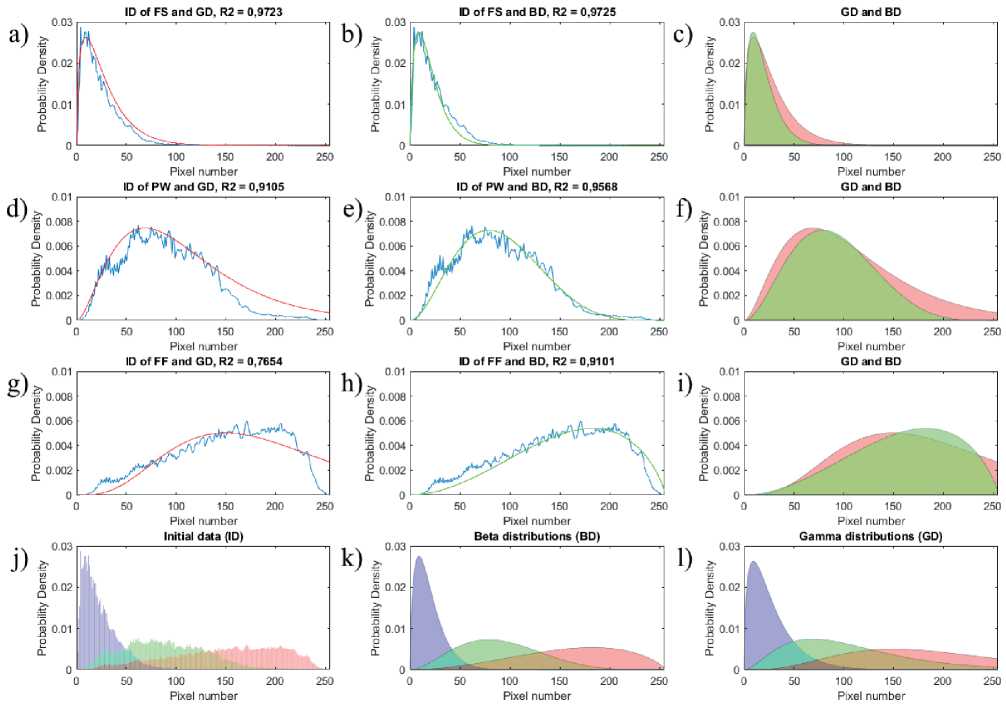
Figure. 2 – Histograms of speckle intensities, approximated by the beta and gamma distributions (description in the text)
more consistent with the correct form of the beta distribution, while comparison with the gamma distribution function [15, 18] demonstrates a worse result, R 2 ~ 0.85. The resulting histograms and corresponding beta distributions are presented in Figure 2.
Intensity histograms of averaged OCT signals presented in Figure 2 demonstrate clear differences in the distribution of speckle intensities and beta distribution parameters, which were α ~ 1.7, β ~ 20.5 for the free space region, α ~ 3.1, β ~ 5.5 for the phantom wall region , α ~ 2.6, β ~ 1.7 for the phantom region with the fluid flow. For the free space region, approximation by the beta distribution demonstrated the determination coefficient identical to the gamma distribution, which is R2 ~ 0.97. For the phantom wall, the beta distribution approximation showed a slightly better result, R2 ~ 0.96, while the gamma distribution corresponded to R2 ~ 0.91. Considerable approximation increase in the accuracy, ~ 20%, using the beta distribution function was found in the region of the scattering flow, which was R2 ~ 0.91 for the beta distribution, R2 ~ 0.77 for the gamma distribution. The increase in the approximation accuracy and identification of the correct shape and parameters of the distri- bution is due to the fact that, constructing histograms it was possible to select significant part of the image with subsequent averaging.
The resulting histograms correspond to the results of Monte Carlo simulations of OCT images [23], which revealed that the trajectory and fluctuations of photons depend on several parameters, including scattering and absorption coefficients, refractive index, anisotropy coefficient, and incident light intensity. These parameters affect the transport and distribution of photons within the sample and therefore the resulting OCT signal.
One of the determining factors of a pixel intensity histogram construction will be the tissue scattering coefficient, which is the degree of scattering of photons when they penetrate a biological object. From OCT image simulation results, it is known that as the scattering coefficient increases, more photons scatter and interfere with each other, which should result in a wider speckle intensity distribution shape, which is confirmed by the experimental results.
The tissue absorption coefficient should also have a direct influence on the resulting distribution. Absorption coefficient represents the ability of a tissue to
Issue 29. November 2023 | Cardiometry | 43
absorb light and is related to the amount of light that penetrates into and out of the tissue. Objects with a higher absorption coefficient have less backscattered light intensity, which shifts the speckle intensity histogram to the left. We can observe a similar result in the resulting histogram.
When studying speckles in OCT images, it is important to take into account that the movement of the liquid should lead to a dynamic speckle structure, for the assessment of which the OCT image variance matrix was constructed, presented in Figure 3.
The resulting variance matrices of OCT images reflect the correlation of speckles between neighboring pixels and pixels of subsequent images. Brighter areas of the variance matrix indicate a dynamic speck- le structure in the original images, which may indicate movement of the investigated area in the sample. Darker areas, on the contrary, indicate a static speckle structure and lack of dynamics. Threshold processing of the resulting matrices confirmed that areas of high intensity correspond to the region of scatterers in the flow. It is important to note that dynamic speckle patterns can be caused by various physiological factors, such as pulsation of blood flow, deviation of the sample from the area of interest as a result of breathing or heartbeat, which will also require the development of special methods.
The dependences of the mean and median intensity values of the variance matrix on the number of studied images were analyzed and show in the Table 1.
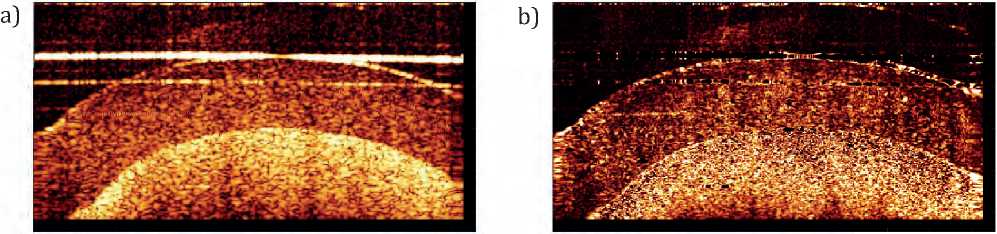
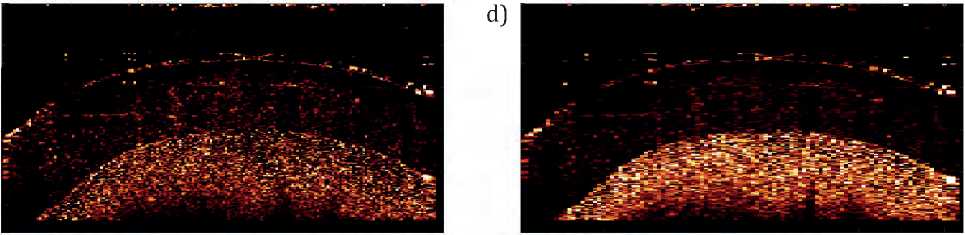
Figure. 3 – Variance matrices of hydrodynamic phantoms of OCT images: a – original image, b – variance matrix calculated from 10 pixels of subsequent images, c – variance matrix calculated from 10 pixels of subsequent images and 3 neighboring ones, d -variance matrix , calculated from 10 pixels of subsequent images and 5 neighboring ones, image size 2x2 mm
Table 1
Results of calculating the average and median intensity values of the variance matrix for the areas of free space, phantom wall and fluid flow.
|
Number of images |
Average intensity values, a. u. |
Median intensity values, a.u. |
||||
|
Free space |
Phantom wall |
Fluid flow |
Free space |
Phantom wall |
Fluid flow |
|
|
0 |
- |
- |
- |
- |
- |
- |
|
1 |
144 216.93 |
528 418.33 |
4 652 536.67 |
24 984.68 |
131 043.38 |
1 133 877.68 |
|
2 |
86 094.08 |
531 606.14 |
2 627 156.53 |
20 492.80 |
234 832.52 |
1 335 386.26 |
|
3 |
62 079.67 |
431 451.49 |
1 821 042.20 |
13 861.61 |
177 129.07 |
863 805.46 |
|
4 |
52 587.74 |
311 493.09 |
1 625 830.54 |
15 041.69 |
140 267.03 |
977 985.12 |
|
Number of images |
Average intensity values, a. u. |
Median intensity values, a.u. |
||||
|
Free space |
Phantom wall |
Fluid flow |
Free space |
Phantom wall |
Fluid flow |
|
|
5 |
44 656.55 |
317 193.15 |
1 438 430.53 |
14 890.30 |
180 895.23 |
988 886.05 |
|
6 |
50 907.79 |
286 082.34 |
1 299 400.73 |
14 380.87 |
171 244.20 |
926 869.32 |
|
7 |
48 098.66 |
305 069.60 |
1 193 834.36 |
13 921.63 |
191 840.82 |
936 416.29 |
|
8 |
49 262.86 |
301 805.75 |
1 117 936.59 |
13 134.30 |
198 272.95 |
888 767.27 |
|
9 |
51 434.61 |
303 560.18 |
1 090 088.27 |
12 793.61 |
198 174.92 |
841 302.33 |
|
10 |
45 839.63 |
312 919.21 |
1 032 264.93 |
12 942.90 |
219 869.79 |
812 371.55 |
|
12 |
44 271.15 |
337 516.31 |
972 577.57 |
11 773.41 |
248 088.75 |
804 613.80 |
|
14 |
45 262.66 |
358 558.61 |
911 454.67 |
11 392.30 |
262 677.97 |
769 264.13 |
|
16 |
45 356.15 |
370 802.79 |
883 008.61 |
11 152.19 |
268 069.83 |
753 629.01 |
|
18 |
44 941.37 |
362 952.49 |
848 476.17 |
11 268.65 |
266 438.35 |
736 133.73 |
|
20 |
43 643.63 |
357 632.57 |
824 882.08 |
10 816.86 |
272 898.28 |
726 475.80 |
|
22 |
42 352.06 |
355 182.15 |
805 755.30 |
10 754.63 |
278 011.28 |
716 440.10 |
|
24 |
42 236.07 |
351 616.05 |
791 605.52 |
10 531.75 |
279 922.54 |
713 508.82 |
|
26 |
42 874.93 |
348 444.53 |
772 364.93 |
10 060.35 |
286 858.03 |
704 184.16 |
|
28 |
42 116.98 |
349 102.70 |
767 016.94 |
9 928.46 |
287 221.97 |
702 006.76 |
|
30 |
42 073.72 |
348 625.46 |
756 258.77 |
10 005.56 |
290 276.34 |
696 941.10 |
The results of calculating the mean and median values of the intensity of the variance matrix demonstrate clear differences in the intensity of the regions of free space, the phantom wall and the fluid flow. The use of four or more images acquires a statistically stable result and can be further used in the future to analyze various types of tissues and flows.
Conclusion
This paper presents the results of OCT image processing, during which OCT images of hydrodynamic phantoms were processed using a computer algorithm. The use of B-scan video series to study the distributions of various areas of OCT images made it possible to obtain more accurate histograms of speckle distribution with appropriate adjustments and to vary the shape and size of the analyzed area. It was revealed that the distribution of speckles corresponds to the correct form of the beta distribution, the parameters of which were α ~ 1.7, β ~ 20.5 for the free space region, α ~ 3.1, β ~ 5.5 for the phantom wall region, α ~ 2 ,6, β ~ 1.7 for the region of scattering fluid flow. Using a sequence of B-scans also makes it possible to construct a variance matrix, indicating the presence of dynamic speckle structures in the original images. With a multiparameter approach, the correlation of biologi- cal events with the biophysical metric parameter space can become more realistic.
The presented processing and analysis of the speckle patterns of the OCT images based on fitting the beta distribution and constructing variance matrices demonstrate high efficiency in differentiating various types of structures and constructing structural OCT images. The presented method has the potential to detect changes in tissue structure caused by diseases (skin cancer) or due to functional changes (blood flow pulsations). It is also possible to detect the boundaries of heterogeneous structures with subsequent visualization of a 3D object (C-scan).
Further work will be focused on the quantitative assessment of speckle structures, analysis of the correlation of beta distribution parameters, intensity values of the variance matrix with the optical characteristics of biological tissues and flows in order to differentiate the objects and construct OCT color images.
References Speckle images of the vessels and hydrodynamic phantoms in optical coherence tomography
- Tuchin VV. Tissue Optics: Light Scattering Methods and Instruments for Medical Diagnosis. SPIE Proc., 2007: 841 p.
- Kiseleva EB, Yashin KS, Moiseev AA. Quantitative Cross-Polarization Optical Coherence Tomography Detection of Infiltrative Tumor Margin in a Rat Glioma Model: a Pilot Study. Modern Technologies in Medicine. 2018(10): 6-14.
- Aznabaev BM, Mukhamadeev TR, Dibaev TI. Optical coherence tomography + angiography in the diagnosis, therapy and surgery of eye diseases. Moscow: August Borg. 2017: 347 p. [in Russian]
- Plekhanov AA, Gubarkova EV, Sovietsky AA. Optical Coherence Elastography for Non-Invasive Monitoring of Tumor Elasticity under Chemotherapy: Pilot Study. Modern Technologies in Medicine, 2018(10): 43-51.
- Holm K, et al. Optical coherence tomography for presurgical delineation of basal cell carcinomas on the face – A comparison with histopathology. J of cutaneous pathology, 2023;50(5):441-449.
- Silver FH, Shah RG, Richard M, Benedetto D. Use of Vibrational Optical Coherence Tomography to Image and Characterize a Squamous Cell Carcinoma. J Dermatol Res Ther, 2023. (5):067
- Proskurin SG. Raster scan and averaging for speckle reduction in optical coherence tomography. Quantum Electronics, 2012;42(6):495-9.
- Rzaeva KA, Utegenov RB, Shokirova ZK. Possibilities of intravital methods of intravascular visualization of an unstable atherosclerotic plaque as the main substrate of acute coronary syndrome. Endovascular Surgery, 2021;8(1):7-19. [in Russian]
- Almasian M, van Leeuwen T, Faber D. OCT Amplitude and Speckle Statistics of Discrete Random Media. Scientific Reports, 2017(7.10.1038):s41598-017-14115-3.
- Wang C, et al. Multi-frame speckle reduction in OCT using supercontinuum pumped by noiselike pulses. J of Innovative Optical Health Sciences. 2019(12): 1950009.
- Kim J, et al. Speckle reduction in OCT with multimode source fiber. SPIE Proc. 5317, Optical Fibers and Sensors for Medical Applications, 2004.
- Dolganova IN, et al. Nanoparticle-enabled experimentally trained wavelet-domain denoising method for optical coherence tomography. J of Biomedical Optics, 2018(23):091406-1-9.
- Balmages I, et al. Use of the speckle imaging sub-pixel correlation analysis in revealing a mechanism of microbial colony growth. Sci Rep, 2023;13(1):2613-1-13
- Lin C, et al. Multi-Mode Fiber-Based Speckle Contrast Optical Spectroscopy: Analysis of Speckle Statistics. Optics Letters, 2023;48(6):1427-1430.
- Moiseev A, et al Pixel classification method in optical coherence tomography for tumor segmentation and its complementary usage with OCT microangiography. J of Biophotonics, 2018;11(4).
- Wang R, Tuchin VV. Advanced Biophotonics: Tissue Optical Sectioning, 2016:733 p.
- Brenner T, et al. Two-dimensional simulation of optical coherence tomography images. Sci Rep, 2019(9):12189
- Kirillin MY, et al. Speckle statistics in OCT images: Monte Carlo simulations and experimental studies. Optics letters, 2014(39):3472-3475.
- Mao J, et al. Monte Carlo-based full-wavelength simulator of Fourier-domain optical coherence tomography. Biomedical Optics Express, 2022;13(19):6317-34.
- Ge G, Rolland J, Parker K. A local Burr distribution estimator for speckle statistics. Biomedical Optics Express, 2022;13(4):2334-45.
- Chereshnev VO, Romanenko IM, Kuleshov IV, Proskurin SG. Differentiation of skin structures, blood vessels and blood by constructing a variation matrix of OCT images. Modern High-Tech Technologies, 2019(10):319-323. [in Russian]
- Ossowski P, Raiter A, Szkulmowska A, Wojtkowski M. Detection of small biological objects by phase-sensitive optical coherence tomography. Progress in Biomedical Optics and Imaging - SPIE Proc., 2015.
- Frolov SV, Potlov AY, Petrov DA, Proskurin SG. Monte Carlo simulation of a biological object with optical coherent tomography structural images using a voxel-based geometry of a medium. Quantum Electronics, 2017(47):347-354.
