Speed and change of direction differences in pre- and adolescent youth soccer players

Author: Kyranoudis A., Kyranoudis E., Triantos I., Milonas I., Mitrotasios M.
Journal: Человек. Спорт. Медицина @hsm-susu
Section: Спортивная тренировка
Article in issue: 2 т.21, 2021.
Free access
Speed and change of direction (CoD) are important factors in the soccer, develop from childhood and determine the performance of soccer players. Aim. The purpose of this study was to examine the development of speed and CoD in pre- and adolescent soccer players and also to examine any differences on CoD performance associated with CoD right (CoDR) or left side (CoDL). Materials and Methods. The study involved 75 soccer players divided into 3 different age groups (U12, U14 and U16). The players performed a 20m sprint in straight line and CoD on both sides using the Arrowhead Agility Test (AAT). Results. Significant differences between ages were recorded in speed (F(2.72) = 118.9; p = 0.000)) and CoDR (F(2.72) = 8.668; p = 0.000), with U16 being superior to other ages, while significant difference in CoDL was observed between U14 and U16 with U12 (p = 0.007 and p = 0.000, respectively) but not between U14 and U16 (p = 0.159). Conclusion. Speed and CoD appear to develop with age, but CoDL, as measured by AAT, appears to be influenced by the use of dominant foot (DL).
Agility, arrowhead agility test, sprint, sports performance
Short address: https://sciup.org/147233708
IDR: 147233708 | UDC: 796.332 | DOI: 10.14529/hsm210217
Навыки развития скорости и смены направления движения у юных футболистов разных возрастных групп
Навыки развития скорости и смены направления движения являются важными требованиями для игры в футбол, вырабатываются с детства и определяют результативность игроков. Цель: изучить навыки развития скорости и смены направления движения у футболистов детского и подросткового возраста, а также изучить любые различия, связанные с результативностью смены направления движения в зависимости от выбора стороны (правая/левая). Материалы и методы. В исследовании приняли участие 75 футболистов, разделенных на 3 возрастные подгруппы (до 12 лет, до 14 лет и до 16 лет). Игроки выполнили 20-метровый спринт по прямой и продемонстрировали смену направления движения в обе стороны в рамках теста на ловкость. Результаты. Значительные различия между возрастными группами были зарегистрированы как для навыка развития скорости (F(2,72) = 118,9; p = 0,000), так и для смены направления движения (F(2,72) = 8,668; p = 0,000), при этом возрастная группа до 16 лет превосходила все остальные. Для навыка смены направления движения статистически значимые различия были зафиксированы между игроками до 14 и 16 лет с игроками до 12 лет (p = 0,007 и p = 0,000 соответственно). Между игроками до 14 лет и игроками до 16 лет статистически значимых отличий выявлено не было (p = 0,159). Заключение. Навыки развития скорости и смены направления движения, по-видимому, вырабатываются с возрастом, но навык смены направления движения, как показали результаты теста на ловкость, скорее всего, зависит от использования доминирующей стопы.
Text of the scientific article Speed and change of direction differences in pre- and adolescent youth soccer players
The ability to change direction (CoD) and speed in pre-designed movements is referred as CoD speed (or simply CoD) [21]. During a soccer game, a player performs approximately 700 CoD at various angles [3]. CoD ability is considered an important physical property, that determines a successful game performance [7, 17], while in professional soccer CoD seems to influence the result of the game [26].
Maximum speed in team sports, such as soccer, is also considered a key element for success [27], with 96 % of sprints in a soccer game to be less than 30 m and approximately half of them (49 %) less 10 m [26]. Even in younger ages, soccer players run at speeds over 18 km/h for 2 to 3 seconds duration at frequency of approximately 120 seconds between them [4].
Both properties, speed and CoD, improve from 5 years of age to adulthood [15] with peak improvement around the same age with Peak Height Velocity (PHV), which fluctuates between 13.8 and 14.2 years old for the boys [20]. Increased hormone secretion, maturation of neuromuscular system [15], increased strength through increased muscle mass [28] and anthro- pometric factors (height, weight, leg length) [16], are considered factors to improve speed and CoD performance with increasing age.
There are several studies that have examined speed and CoD performance in pre- and adolescence [16, 18, 22]. They agree that sprint speed and CoD improve with age. In the Rommers et al study [22] both 5m acceleration and maximum speed (30 m) improved between different ages. Similar improvement was recorded by Mathisen and Pettersen [16] on 10 m and 20 m sprint between the ages of 10–12, 13–14 and 15–16 years. Furthermore, many studies have also examined CoD performance at different ages [21] with conflicted results. This, among other limitations, maybe due to the variety of tests used to evaluate CoD [8] and the complexity of the tests themselves associated with measuring the angles and number of changes as well as their duration and distance [5, 11]. Mathisen and Pettersen [16] used a 20 m test which included 90° and 180° changes of direction and short sprint distances (5 m), Rommers et al [22] used the T-test which contains turns at the same angles, but the total distance covered is 30 m, while Negra et al [18] used Illinois Agility Test (IAT) which includes
180° turns, but the total test distance is approximately 60 m. Nevertheless, these tests have not the appropriate ecological validity compared with the specific physical soccer requirements [21].
The Arrowhead Agility Test (AAT) is a test specifically designed for soccer [25]. Players run a total distance of 37 m having previously performed 3 turns of approximately 45°, 90° and 135° [13, 21] (Fig. 1). The validity, reliability and ecological validity of this test compared with the specific physical soccer requirements have been confirmed [13, 21]. To the best of our knowledge, it does not seem to exist a relevant literature on the evaluation of CoD performance using ATT in childhood and adolescence.
Youth and professional players have a dominant (DL) or preferred leg. DL is considered the limb that controls and shoots the ball better and easier than the other one, which has a more stabilizing role and is considered as Non-Domi-nant Leg (NDL). Due to the frequent use of DL it is possible to cause a strength imbalance between two limbs [6, 12], which plays an important role in sports, such as soccer [6]. DL strength superiority is very important for CoD performance, as the strong limb favors this ability in the opposite side [23, 29]. However, although, few studies have examined the CoD with various tests [22, 23], they have not focused on the lower limbs imbalance and the effect of CoD in pre- and adolescent youth soccer players at the same time.
Therefore, the purpose of the present study was to evaluate 20 m sprint speed, which is closer to the natural responses in younger ages (10–11 years old) [4] and CoD using ATT in pre-and adolescence. A secondary purpose was to examine any differences in CoD performance between the ages associated with CoD right or left.
Materials and Methods
Participants
The sample consisted of 75 young football players aged 10 and 16 years. The participants were divided according to their chronological age into 3 groups, based on the division proposed by the Hellenic Football Federation in 2-year age categories: 10–11 years (U12), 12–13 years (U14) and 14–15 years (U16). The physical characteristics of the participants are shown in Table 1. The participants in U12 and U14 groups took part in 3 training sessions per week of 75–80 minutes each and a soccer game, while the U16 participants took part in 4 training sessions per week of 90 minutes each and a soccer game. Both participants and their representatives were informed about the research and signed a relevant authorization. This study was held in accordance with the principles of the Code of Ethics for Research of the Democritus University of Thrace, Greece. All the procedures were in accordance with the Declaration of Helsinki.
Experimental procedure
Anthropometrics of barefoot participants were collected before the tests to the nearest 0.5 cm (height) and 0.5 kg (weight) (Seca 750, Seca,
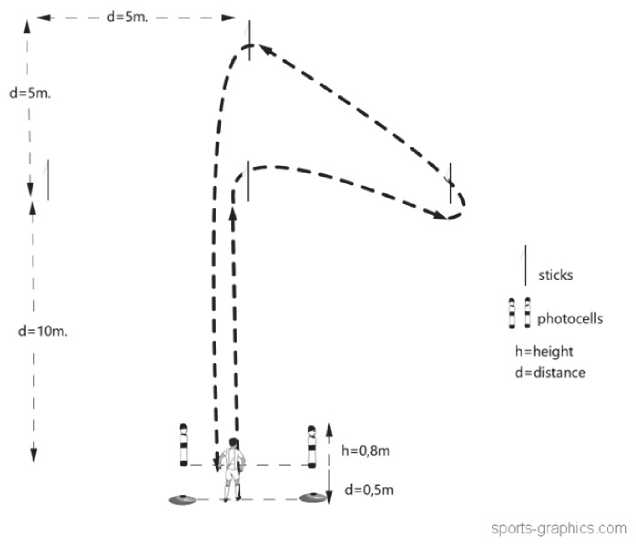
Fig. 1. The Arrowhead Agility Test (AAT) (designed by easy-sports-graphics)
Table 1
Physical Characteristics of U12, U14 and U16 Male Youth Soccer Players (mean ± SD)
|
Variable |
U12 (n = 25) |
U14 (n = 25) |
U16 (n = 25) |
|
Age (years) |
10.8 ± 0.6 |
12.8 ± 0.6¶ |
14.9 ± 0.6*# |
|
Height (cm) |
144.8 ± 6 |
157.5 ± 6.3¶ |
170.9 ± 8.6*# |
|
Weight (kg) |
40.7 ± 9.5 |
51.8 ± 11.8¶ |
60.4 ± 14.1*# |
Note. * Significant differences between U16 and U12; # Significant differences between U16 and U14; ¶ Significant differences between U14 and U12; p < 0.05.
Table 2
Speed and Change of Direction Performance in U12, U14 and U16 Male Youth Soccer Players
|
Variable |
U12 (n = 25) |
U14 (n = 25) |
U16 (n = 25) |
|
Speed (sec) |
4.25 ± 0.35 |
4.26 ± 0.23 |
3.22 ± 0.21*# |
|
CoDR (sec) |
9.69 ± 0.87 |
9.42 ± 0.54 |
8.93 ± 0.44*# |
|
CoDL (sec) |
9.91 ± 0.84 |
9.34 ± 0.55¶ |
8.98 ± 0.46* |
Note. * Significant differences between U16 and U12; # Significant differences between U16 and U14; ¶ Significant differences between U14 and U12; p<0.05; CoDR: Change of Direction Right; CoDL: Change of Direction Left
Hamburg, Germany). The tests performed in the natural grass field. The outside temperature was (23.6 ± 0.3) °C and the humidity was (56 ± 2) %. Prior to the tests, participants performed a 10-minute warm – up included jogging, skipping, heeling, sidesteps, running backwards, alternative knee lifts, zigzag back and forth and 2 sub maximal sprints. For both tests, 20 m sprint speed and ATT, Photocells Newtest Powertimer 300 (PC Upgrade Kit, FIN 90220 Οulu, Finland) were used. On the 20 m sprint speed participants started 0.5 m before the first photocell gate and they finished, at top speed, 5 m after the second gate, in order not to have any reduction of the speed. Each participant performed 2 attempts with 2 minutes break between and analyzed the best time. On the ATT test, the participants started from the same starting point as before and they performed 4 attempts, two to the right direction (CoDR) and two to the left (CoDL), alternatively, starting first to the right with 4 minutes break between them. Again, the best time in any direction was used for analysis. For the better test performance 1.2 m height poles were used. In both tests participants were encouraged to do their best.
Statistical Analysis
For the comparison between sprint speed and CoD at each age group, paired T-test was used. Multivariate analysis of variance (MANOVA) was used to evaluate any differences in test performance according to the age groups. In case of significant differences, Bonferonni post hoc test was also used. All tests were conducted in SPSS 20.0 software (IBM corp., Amork, NY). The significance level set at p < 0.05.
Results
Descriptive statistics (mean ±, standard devi-ation-SD) in speed and CoD are presented in Table 2. A paired samples t-test showed a significant correlation between speed and CoD in all age groups (p = 0.000). The multivariate analysis of variance-MANOVA revealed a significant main effect of the “age” factor on all dependent variables, speed F (2,72) = 118.9 (p = 0.000), CoDR F (2,72) = 8.668 (p = 0.000) and CoDL F (2,72) = 13.31 (p = 0.000). Post hoc Bonferonni multiple comparisons concluded that U16 differed significantly from all age groups in speed and CoDR, while a significant difference was found between U16 and U14 with U12 in CoDL, but not between U16 and U14.
Discussion
The present study examined differences in 20m sprint speed and changes of direction (CoD) in both directions (CoDR and CoDL) between U12, U14 and U16 age groups. Both variables improved with age. Alongside, CoD was examined to the right and to the left through the ATT, with U16 dominates to all other age groups in speed and in CoDR, while in CoDL there was no significant difference between U16 and U14.
The results of this study showed that 20m sprint speed improved with age, with U16 showing the greatest improvement. Similar results showed Rommers et al [22], Mathisen and Pettersen [16] and Jakovlevic et al [8]. Sprint performance seems to reveal the highest increase around the PHV between 13.8 and 14.2 years and then appears a plateau [20]. The oldest soccer players in our sample were on average 14.9 years, so relative close to the PHV. However, the fact that players of U16 group were taller than the others may justify better performance on 20 m sprint speed. Mathisen and Pettersen [16] recorded a greater correlation between height and speed at 13–14 and 15–16 years than at younger ones. Thus, height seems to influence the speed much more in older youngsters as there is an increase of the stride length with the increase of the height [19].
Muscle strength is positively correlated with body size [9]. In Mathisen and Pettersen study [16] there was a moderately positive correlation (r = 0.33) between body mass and 20 m sprint speed at the age of 15–16 years and slightly lower correlation (r = 0.27) at 13–14 years old, while it was insignificant in 10–12 years old pre-ado-lescents. Based on the previous studies, it makes sense that the older a player gets, the better his speed performance. Mathisen and Pettersen [16] also report that 13–16 years old, who are taller and heavier, perform better on sprints. Maximum isometric force is proportional to muscle size irrespective of the age and is greater in the adolescent than the pre-adolescent youth players [28]. The children’s weakness to produce more power than the older ones, it is possibly due to the immature neuromuscular system that is unable to recruit the appropriate motor units [28].
Similar to speed, CoD performance has also shown improvement with increasing age. Malina et al [15] indicate that agility develops rapidly at the age of 5–8 and continues to increase till the age of 18 years. Similar to speed, the agility, both as general CoD or as a reaction to a stimulus, reaches a peak around the PHV point [20]. The results of this study are also in agreement with Mathisen and Pettersen [16] and Jakovlevic et al [8], who recorded improvement in CoD in pre- and adolescent soccer and basketball players, respectively. Mathisen and Pettersen [2015] support that agility is significantly correlated (r = 0.28) with height at the age of 13–14 years, but not with ages before or after PHV. Increased levels of testosterone and developing hormones [15], better intermuscular coordination [2], the maturity of neuromuscular system with better motor units recruitment [28], improvement of anaerobic ability during high intensity exercises [14, 24] and also the extra years of training compared to previous ages [24] probably contribute to better CoD performance in older ages. Young et al [30], also, mention that straight line sprinting, leg muscle strength and running technique are identified as factors that may contribute to CoD speed.
Another important finding of the present research was the differences between ages on CoDL. While there was an age-related improvement on CoDR between U12, U14, U16, there was a significant difference on CoDL between U16 and U14 with U12, but not between U16 and U14. As mentioned before, the pre-adolescent youth players have less developed anaerobic capacity than older ones [24], a fact that possibly justifies the difference of U12 with older ages. However, no difference was observed between U16 and U14, which is probably due to the use of DL instead of NDL.
In general, the common use of DL possibly causes strength imbalances between two legs that can reach up to 14 % [6, 12, 23]. This is probably due to the greater muscle mass of DL [10], which is highly correlated with muscle fascicle length [1], which was reported to be greater in DL junior soccer players [10] and it may be associated with greater force output with their DL. In the present study, the majority of participants (62 out of 75) had their right leg as DL. As a result, CoDR was more favored, because in ATT the right turn with left leg was followed by two other turns that required the use of DL (in this case the right leg). But in CoDL it does not seem to happen the same. This is in line with the findings of Young et al [29], who report a slower change of direction with the use of NDL after an explosive training. This indicates that a greater strength in the dominant leg leads to better CoD on the opposite side [23], a fact that does not seem to appear with ΝDL. Agility was significantly correlated with body height at age 13–14 years but not at post PHV. Philippaerts et al [20] recorded a plateau to the performance on standing long jump (explosive strength) after PHV, while on vertical jump they observed a decrease 6 and 12 months after peak on PHV. The age of U16 soccer players who were on average 6–12 months after PHV in combination with the fact that left leg was not DL, possibly justifies the lack of differences between U16 and U14.
AAT is a reliable field test for the evaluation of CoD for soccer players [21]. To the authors’ knowledge, it does not seem to exist any relevant literature on the concomitant use of ATT in the ages before and after PHV. Although the purpose of the present study was not to correlate the test with different ages, it showed that performance improves with ages on both sides. However, ATT seems to be more appropriate for the evaluation of lower limbs strength asymmetry, although further research is needed. Last but not least, it seems that ATT can provide data to help the coaches of developmental ages to organize appropriate programs for CoD improvement on both sides.
Conclusions
The results of the present study showed that speed and CoD performance increase with ages using ATT. However, the differences on CoD in both directions (right and left) did not progress similarly. CoDR appears to be influenced by the use of the DL in contrast to CoDL. Developmental coaches should properly evaluate similar results in order to design appropriate programs to improve sprint speed and CoD capacities to limit any lower extremities muscle imbalances of pre-and adolescent youth soccer players.
References Speed and change of direction differences in pre- and adolescent youth soccer players
- Abe T. Fascicle Length of Leg Muscles in Monozygous Twins. Medicine and Science in Sports and Exercise, 2000, vol. 32, p. 243. DOI: 10.1097/00005768-200006000-00014
- Asadi A., Arazi H., Ramirez-Campillo R. et al. Influence of Maturation Stage on Agility Performance Gains After Plyometric Training: A Systematic Review and Meta-Analysis. Journal of Strength and Conditioning Research, 2017, vol. 17, no. 9, pp. 2609-2617. DOI: 10.1519/ JSC.0000000000001994
- Bloomfield J., Polman R., O'Donoghue P. Physical Demands of Different Positions in FA Premier League Soccer. Journal of Sports Science and Medicine, 2007, vol. 6, pp. 63-70.
- Castagna J.B., D'Ottavio S., Abt G. Activity Profile of Young Soccer Players During Actual Match Play. Journal of Strength and Conditioning Research, 2003, vol. 17, pp. 775-780. DOI: 10.1519/1533-4287(2003)017-0775: apoysp-2.0.co;2
- Condello G., Kernozek T.W., Tessi-tore A., Foster C. Biomechanical Analysis of a Change of Direction Task in Collegiate Soccer Players. International Journal of Sports Physical and Performance, 2016, vol. 11, pp. 96-101. DOI: 10.1123/ijspp2014-0548
- Fousekis K., Tsepis E., Vagenas, G. Lower Limb Strength in Professional Soccer Players: Profile, Asymmetry, and Training Age. Journal of Sports Science and Medicine, 2010, vol. 9, no. 3, pp. 364-373.
- Goral K. Examination of Agility Performances of Soccer Players According to their Playing Positions. Sports Journal, 2015, vol. 6, pp. 1-9. DOI: 10.17682/sportjournal/2015.004
- Jakovljevic S.T, Karalejic M.S, Pajic Z.B., Macura M.M. Speed and Agility of 12- and 14-year-old Elite Male Basketball Players. Journal of Strength and Conditioning Research, 2012, vol. 26, pp. 2453-2459. DOI: 10.1519/JSC. 0b013e31823f2b22
- Jaric S. Role of Body Size in the Relation Between Muscle Strength and Movement Performance. Exercise and Sport Sciences Review, 2003, vol. 31, pp. 8-12. DOI: 10.1097/00003677200301000-00003
- Kearns CF., Isokawa M., Abe T. Architectural Characteristics of Dominant Leg Muscles in Junior Soccer Players. European Journal of Applied Physiology, 2001, vol. 85, pp. 240-243. DOI: 10.1007/s004210100468
- Koklu Y., Alemdaroglu U., Ozkan A. et al. The Relationship Between Sprint Ability, Agility and Vertical Jump Performance in Young Soccer Players. Science & Sports, 2015, vol. 30, no. 1, pp. 1-5. DOI: 10.1016/j.scispo.2013. 04.006
- Lehance C., Binet J., Bury T., Croi-sier J.L. Muscular Strength, Functional Performances and Injury Risk in Professional and Junior Elite Soccer Players. Scandinavian Journal of Medicine & Science in Sports, 2009, vol. 19, no. 2, pp. 243-251. DOI: 10.1111/ j.1600-0838.2008.00780
- Lockie RG., Javilvand F. Reliability and Criterion Validity of the Arrowhead Change-of-Direction Speed Test for Soccer. Physical Education and Sport, 2017, vol. 15, no. 1, pp. 139-151. DOI: 10.22190/FUPES1701139L
- Loturco I., Jeffreys I., Cal Abad C.C. et al. Change-of-Direction, Speed and Jump Performance in Soccer Players: a Comparison Across Different Age-Categories. Journal of Sports Science, 2020, vol. 20, no. 11, pp. 1279-1285. DOI: 10.1080/02640414.2019.1574276
- Malina R.M., Bouchard C., Bar-Or O. Growth, Maturation and Physical Activity. Champaign, IL: Human Kinetics, 2004. DOI: 10.5040/9781492596837
- Mathisen G., Pettersen S.A. Anthropo-metric Factors Related to Sprint and Agility Performance in Young Male Soccer Players. Open Access Journal of Sports Medicine, 2015, vol. 6, pp. 337-342. DOI: 10.2147/OAJSM.S91689
- Muniroglou S., Subak E. Acomparison of 5, 10, 30 Meters Sprint, Modified T-test, Arrowhead and Illinois Agility Tests on Football Referees. Journal of Education and Training Studies, 2018, vol. 6, no. 8, pp. 70-76. DOI: 10.11114/jets.v6i8.3360
- Negra Y., Chaabene H., Amara S., Jaric S. Evaluation of the Illinois Change of Direction Test in Youth Elite Soccer Players of Different Age. Journal of Human Kinetics, 2017, vol. 58, no. 1, pp. 215-224. DOI: 10.1515/hukin-2017-0079
- Papaiakovou G., Giannakos A., Michai-lidis C., Patikas D. The Effect of Chronological Age and Gender on the Development of Sprint Performance During Childhood and Puberty. Journal of Strength and Conditioning Research, 2009, vol. 23, pp. 2568-2573. DOI: 10.1519/ JSC.0b013e3181c0d8ec
- Philippaerts R.M., Vaeyens R., Jans-sens M., van Renterghem B. The Relationship Between Peak Height Velocity and Physical Performance in youth Soccer Players. Journal of Sports Science, 2006, vol. 24, no. 3, pp. 221-230. DOI: 10.1080/02640410500189371
- Rago V., Brito J., Figueiredo P., Ermidis G. The Arrowhead Agility Test: Reliability, Minimum Detectable Change, and Practical Applications in Soccer Players. Journal of Strength and Conditioning Research, 2020, vol. 34, no. 2, pp. 483-494. DOI: 10.1519/JSC. 0000000000002987
- Rommers N., Mostaert M., Goossens L., Vaeyens R. Age and Maturity Related Differences in Motor Coordination Among Male Elite Youth Soccer Players. Journal of Sports Science, 2018, vol. 37, no. 2, pp. 196-203. DOI: 10.1080/ 02640414.2018.1488454
- Rouissi M., Chtara M., Owen A., Chaa-lali A. Effect of Leg Dominance on Change of Direction Ability Amongst Young Elite Soccer Players. Journal of Sports Science, 2016, vol. 4, no. 6, pp. 542-548. DOI: 10.1080/02640414. 2015.1129432
- Slimani M., Nikolaidis P.T. Anthropo-metric and Physiological Characteristics of Male Soccer Players According to their Competitive Level, Playing Position and Age Group: A Systematic Review. Journal of Sports Medicine and PhysicalFitness, 2019, vol. 59, no. 1, pp. 141-163. DOI: 10.23736/S0022-4707.17.07950-6
- SPARQ. Available at: http://trainer. scoutingsolutions.com/websitefiles/32/file/ SPARQ%20protocol_detail_m_soccer2.pdf (accessed 1.04.2018)
- Stolen T., Chamari K., Castagna C., Wisloff U. Physiology of Soccer. Sports Medicine, 2005, vol. 35, no. 6, pp. 501-536. DOI: 0112-1642/05/0006-0501/$34
- Taskin H. Evaluating Sprinting Ability, Density of Acceleration and Speed Dribbling Ability of Professional Soccer Players with Respect to Their Positions. Journal of Strength and Conditioning Research, 2008, vol. 22, no. 5, pp. 1481-1486. DOI: 10.1519/JSC.0b013e318 181fd90
- Tonson A., Ratel S., Le Fur Y., Coz-zone P. Effect of Maturation on the Relationship Between Muscle Size and Force Production. Medicine and Science in Sports and Exercise, 2008, vol. 40, no. 5, pp. 918-925. DOI: 10.1249/ MSS.0b013e3181641bed
- Young W.B., James R., Montgomery I. Is Muscle Power Related to Running Speed with Changes of Direction? Journal of Sports Medicine and Physical Fitness, 2002, vol. 42, no. 3, pp.282-288.
- Young W.B., Dawson B., Henry G.R. Agility and Change of Direction Speed are Independent Skills: Implications for Training for Agility in Invasion Sports. International Journal of Sports Science and Coaching, 2015, vol. 10, pp. 159-169. DOI: 10.1260/1747-9541.10.1.159
