Sports talent search: genes versus motor tests

Author: Imonek J., Idek R.
Journal: Человек. Спорт. Медицина @hsm-susu
Section: Спортивная тренировка
Article in issue: 3 т.21, 2021.
Free access
Aim. The aim of this study was to explain the role of physical fitness testing and genetic analysis in identifying sports talents. Materials and Methods. The research sample included 169 pupils (97 male; mean age = 7.438 y. and 72 female; mean age = 7.227 y.) attending 3 elementary schools in the region of Nitra, Slovakia. All pupils underwent 9 physical tests to determine their general physical abilities. Each performance of pupils in tests was allotted points. Subsequently, 30 pupils with the highest points were selected to undergo 2ml saliva sampling (GeneFix Saliva Collectors) for genetic analysis. Samples were analyzed using the HiScan (Illumina inc, San Diego, USA) apparatus, which allowed for analyzing 400 000 polymorphisms in a human gene. The values of individual genetic score are compared with histogram of genetic score distribution in European population. Softwares Genomestudio (Illumina inc, San Diego, USA) and TANAGRA 1.4.50 were used for data analysis. Results. Based on the analysis we offered parents and coaches comprehensive information about children´s prerequisites for certain type of sports, particularly anaerobic capacity, motivation for sports, muscle pain sensitivity, and type of energy metabolism. Conclusion. Results of the genetic analysis and measurement of motor abilities of selected children aged 7-8 years suggest that genetic testing of young athletes offers a suitable method of identifying performance prerequisites just before their development. Genetic tests can inform trainers and athletes on the type of physical activity (endurance or speed) suitable for the given individual. The results of fitness tests can provide them only with partial information on the momentary state of fitness of children. Genetic analysis may be considered a suitable and practical alternative for fitness-oriented testing of population.
Genetic analysis, fitness tests, 7-year-old pupils, sports talent identification, prerequisites for sport
Short address: https://sciup.org/147236687
IDR: 147236687 | UDC: 796.012.475 | DOI: 10.14529/hsm210320
Выявление спортивных талантов: генетика и двигательные тесты
Цель. Целью данного исследования было объяснение роли тестирования физической подготовленности и генетического анализа в выявлении спортивных талантов. Материалы и методы. Выборка исследования включала 169 учеников (97 мальчиков, средний возраст - 7,438 года и 72 девочки, средний возраст - 7,227 года), посещающих 3 начальные школы в г. Нитра. Все ученики сдали 9 физических тестов на определение общих физических способностей. За выполнение тестов каждому ученику начислялись очки. Впоследствии были отобраны 30 учеников с наивысшей оценкой, у которых забиралась слюна для генетического анализа в объеме 2 мл (GeneFix Saliva Collectors). Образцы исследовались с использованием прибора HiScan (Illumina Inc., Сан-Диего, США), который позволяет анализировать 400 000 полиморфизмов в гене человека. Значения индивидуальных генетических показателей сравнивались с гистограммой распределения генетических показателей в европейской популяции. Для анализа данных использовали программное обеспечение Genomestudio (Illumina Inc., Сан-Диего, США) и TANAGRA 1.4.50. Результаты. На основе проведенного анализа родителям и тренерам была предоставлена конкретная информация о предрасположенности детей к определенным видам спорта с учетом их типа энергетического обмена, анаэробных возможностей, спортивной мотивации и чувствительности к мышечной боли. Заключение. Результаты генетического анализа и исследования физических способностей детей в возрасте 7-8 лет позволяют предположить, что генетическое тестирование юных спортсменов подходит для определения предрасположенности детей к определенным видам спорта еще до непосредственного проявления физических качеств. Генетические тесты могут дать информацию о типе физической активности (на выносливость или скорость), которая подходит для человека. Результаты фитнес-тестов предоставляют ограниченную информацию о текущем состоянии здоровья ребенка. Генетический анализ может рассматриваться как удобная и практичная альтернатива для спортивной ориентации населения.
Text of the scientific article Sports talent search: genes versus motor tests
Sports performance is a multifactorial polygenic trait influenced by sports training, environmental and genetic predisposition. Elite athletes are more or less extreme products of genetic variability and their exceptionality consists in that they are markedly different from the common average. Among the most significant factors influencing muscular strength are: muscle fibre proportions, nutrition, genetic predisposition, age, length of muscles, and an individual´s soma-totype. During the growth of an athlete series of important factors concur. Among them are: cultural background, motivation, social conditions, professional coaching and sports tradition in the given country. Physical fitness of each individual is primarily limited by his/her genotype. As to the type of an individual, it is possible to specify, with a high degree of accuracy, whether the individual can reach through an in0tensive training top sports performance in endurance or explosive (speed-strength) sports events, or otherwise the training is only a redundant load without an expected effect [29].
The problem of practical selection and development of talented athletes is that many coaches and sport scientists have not always used this process effectively. We can often see that coaches do not use adequate test batteries for the assessment of physical, physiological and psychological properties of young athletes. Selection of tested items into the test battery does not always reflect the structure of sports performance in the given kind of sport. The data obtained by measurement often lack the corresponding variables to compare with. It is therefore more important to use smaller number of parameters, the weight of which, however, is greater regarding the final sports performance.
Anaerobic capacity
During hypoxia, HIF1A accumulates and forms a heterodimer (HIF1) with HIF1B. HIF1A-and/or -B-responsive genes are involved in angiogenesis, glucose metabolism, vasomotor control, and erythropoiesis, many of which are implicated in either the delivery of oxygen and nutrients to cells, or controlling cellular utilization of these substrates [10]. Differences in this gene demonstrated a relationship between HIF1A Ser allele and high transcription activity of the gene and high level of anaerobic glycolysis represented by development and manifestation of the speed and power capacities [3]. Up to date NAT2 polymorphisms are mainly associated with individual variations in drug and carcinogen metabolism (through acetylation reactions), yet they could be also involved in regulating ROS production and ROS-induced damage. This is an important consideration as growing evidence shows the pivotal role of ROS in modulating muscle contractile function [2, 8]. In addition, adenosine monophosphate deaminase (AMPD) is a very important regulator of muscle energy metabolism during exercise. The nonsense mutation rs17602729 in exon 2 of the AMPD1 gene converts glutamine codon (CAA) into the premature stop codon (TAA), which results in the early interruption of protein synthesis and appears to be the main cause of AMPD1 deficiency [13]. Also gene ADRB3 plays its role in exercise performance by activating adenylyl cyclase in adipose tissue, thereby stimulating lipolysis and thermogenesis [26]. Small differences in heart rate are associated with CREB1 gene (rs2253206), specifically, the A allele associated with a smaller reduction in heart rate during a submaximal exercise.
Motivation
Motivation and participation on exercise is another important factor. Several genes have been linked to sport motivation with unknown or known mechanism of function. Gene DNAPTP6 is coding DNA polymerase-transactivated protein 6 and PAPSS2 coding an enzyme involved in sulfation of various molecules are significantly associated with sport motivation without known mechanism of function [22, 23]. Common variant of gene COMT is hypothesized to alter cortico-striatal dopamine dynamics and predicts reward responsiveness during asymmetric reinforcement and sequential risk-taking. Differences in the distribution of AMPD1 (rs17602729) genotypes and a lower frequency of allele T in athletes suggest that allele T is a factor unfavourable for athletics oriented sports categories [13]. CREB1 has been shown to be a key mediator of contraction – transcription coupling in excitable cells. This process plays an important role in training-induced changes in neuronal plasticity. It seems to contribute to cardiovascular adaptation to regular physical activity [24].
Muscle pain
Analyses of skeletal muscle mitochondrial activity in cultured myotubes obtained from healthy young subjects showed that carriers of the minor G allele of PPARD SNP rs2267668 had lower mitochondrial function compared with subjects homozygous for the major A allele [11]. Peroxisome proliferator- activated receptor γ coactivator 1α (PPARGC1A) is a transcriptional coactivator that controls mitochondrial biogenesis and oxidative phosphorylation in skeletal muscle. A significant association was observed between the PPARGC1A rs8192678 polymorphism and the lactate threshold. The musclespecific creatine kinase (CKM) A/G variants (rs8111989) have been associated with skeletal muscle performance and muscle damage [9]. Differences in ROS production regulated by NAT2 gene diversity in rs1208 locus could cause differences in ROS-induced damage. This is an important consideration as growing evidence shows the pivotal role of ROS in modulating muscle contractile function [8]. Damage caused by reactive oxygen species (ROS), combined with negative effect of another risk alleles in genes PPARD, PPARGC1A and NAT2 could alter the perception of muscle pain and training response.
Body mass
Body mass is a complex trait based on cumulative effect of many various factors. Majority of genes associated with body mass differences are related with energetic metabolism. Gene TMEM18 seems to affect energy levels through insulin and glucagon signalling [29]. FTO gene is associated with adiposity and fat distribution, and is directly associated with sport activity [6, 14]. Fat distribution associated within genes GNPDA2 and SH2B1 is associated with early onset of obesity [12, 15]. The newly discovered variants showing strong associations with BMI lie near to SH2B1, TMEM18, MTCH2 and GNPDA2. SH2B1 is a strong prior candidate for regulating body weight. SH2B1 is implicated in leptin suggesting that the effects of this gene on obesity are mediated through the central nervous system [12, 15, 29]. There are also genes like MC4R, BDNF-AS, LOC144233 changing BMI status without any described function [4, 5, 7, 28].
Methods
Participants and data collection
The research sample included 169 pupils (97 male; mean age = 7.438 years and 72 female; mean age = 7.227 years) attending first class at 3 elementary schools in the region of Nitra, Slovakia. All pupils underwent 9 motor tests to determine their general physical abilities. Each per- formance of pupils in tests was assigned points according to standards for general population aged 6 to 8. 30 pupils with the highest number of points were subsequently selected to undergo 2 ml saliva sampling (GeneFix Saliva Collectors) for genetic analysis. Samples were analysed using the apparatus HiScan (Illumina inc, San Diego, USA), which allowed for analysing 400,000 polymorphisms in a human gene. The values of individual genetic score are compared with histogram of genetic score distribution in European population. Software Genomestudio (Illumina inc, San Diego, USA) and software TANAGRA 1.4.50 were used for data analysis.
Instruments and analysis
Four separate panels of genetic markers were selected for analysis. An unweighted “genetic score” based on contribution to anaerobic capacity, sport motivation, muscle pain and body mass (Table 1) has been calculated. A score of ‘0’ represented homozygote for the low-response variant; ‘1’ represented heterozygous and ‘2’ represented homozygous for the high-response allele. In certain variants with significantly higher impact was the genetic score increase to ‘2’ for heterozygous and ‘4’ for homozygous high-response allele. Sum of genetic score calculated for each haplotype has been enriched by probability to observe specific haplotype in European (Caucasian) population. The overall population risk has been visualized as a histogram of given genetic score based on frequencies of all possible haplotypes in the European population. Predictive model based on 5 SNPs (anaerobic capacity); 5 SNPs (sport motivation), 4 SNPs (muscle pain) and 9 SNPs (body mas) has been visualised in to histograms (Figs. 1–4).
The calculated rate of genetic score has been confronted to histogram of genetic score distribution of 30 control individuals genotyped through Illumina chip HumanOmniExpress-24 (23andMe v3, v4, v5) and derived from the project NU3Gen. To enrich maximal potential of used genetic chip, some of SNP markers has been imputed. In several situations (no call, missed SNP) we used LDLINK platform [19] to find suitable replacement SNP with highest possible pair vase R2. For the graphical representation of the distribution of the genetic score in the population, a histogram of the model distribution of the genetic score in the European population based on the frequencies of the individual alleles obtained with the 1000 genome project has been calculated.
Table 1
List of selected genetic markers with cumulative effect
|
Markers for anaerobic capacity |
|||
|
ID |
Gene |
SNP |
Source |
|
1 |
HIF1A |
rs11549465 |
[10] |
|
2 |
NAT2 |
rs1208 |
[8, 27] |
|
3 |
AMPD1 |
rs17602729 |
[13] |
|
4 |
ADRB3 |
rs4994 |
[26] |
|
5 |
CREB1 |
rs2253206 |
[24] |
|
Markers for motivation |
|||
|
1 |
DNAPTP6 |
rs12612420 |
[23] |
|
2 |
PAPSS2 |
rs10887741 |
[23] |
|
3 |
COMT |
rs4680 |
[1,18] |
|
4 |
AMPD1 |
rs17602729 |
[13] |
|
5 |
CREB1 |
rs2253206 |
[17, 21, 24] |
|
Markers for muscle pain |
|||
|
1 |
PPARD |
rs2267668 |
[11] |
|
2 |
PPARGC1A |
rs8192678 |
[20] |
|
3 |
CKMM |
rs8111989 |
[9] |
|
4 |
NAT2 |
rs1208 |
[8, 27] |
|
Markers for body mass |
|||
|
1 |
TMEM18 |
rs6548238 |
[29] |
|
2 |
BDNF-AS |
rs925946 |
[28] |
|
3 |
LOC144233 |
rs7138803 |
[5, 28] |
|
4 |
FTO |
rs9939609 |
[14, 15] |
|
5 |
GNPDA2 |
rs13130484 |
[12, 25] |
|
6 |
SH2B1 |
rs4788102 |
[14, 15] |
|
7 |
MTCH2 |
rs10838738 |
[29] |
|
8 |
MC4R |
rs10871777 |
[5] |
|
9 |
MC4R |
rs12970134 |
[28] |
Results
The anaerobic capacity is the total amount of energy from the anaerobic (without oxygen) energy systems. The results of our study point to the fact that the model distribution of the genetic score in the European population ranges from genetic score (GS) 0 to GS9 (Fig. 1).
Although the maximum achievable GS value in the selected model is 9, this hypothetical value occurs in European population with a probability of 0.04 %. In contrast, the genetic score ranging from 3 to 5 can be seen in 72.5 % of the European model population. The genetic score below 3 has been considered as a reduced anaerobic capacity and a score above 5 as predisposition to increased anaerobic capacity. As can be seen from Fig. 1, the genetic score of the control population without selection is similar to the distribution of the calculated genetic score distribution in the European population. The selected group of children was characterised by a slightly higher anaerobic capacity. This result suggests that selection of children aged 7–8 years does not pro-
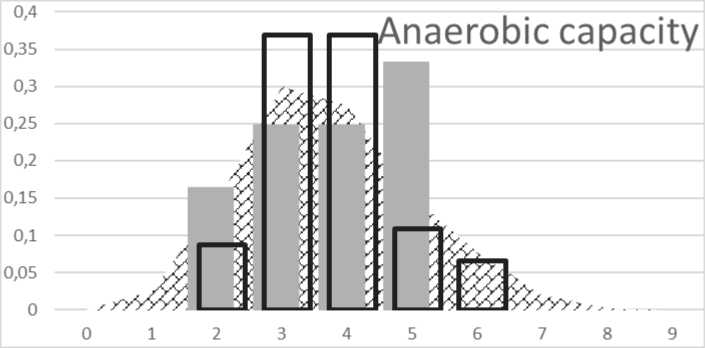
Fig. 1. Distribution of genetic score for anaerobic capacity:
background histogram represents distribution of oxidative capacity in European population. Black bordered columns represent distribution of GS in control group; grey columns represent distribution of GS in selected group
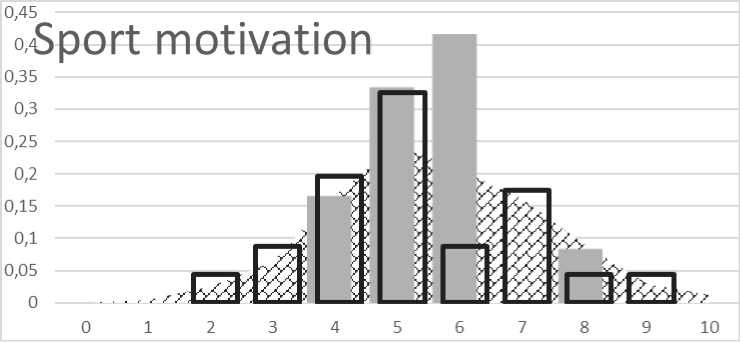
Fig. 2. Distribution of genetic score for remuneration for activity:
background histogram represents distribution of oxidative capacity in European population. Black bordered columns represent distribution of GS in control group; grey columns represent distribution of GS in selected group
vide results that would correspond to genetic predisposition to adult anaerobic capacity.
The hypothetical value of the genetic score for sport motivation was from 0 to 10. The lowest value of 0 and the highest value of 12 in the European population occur with a probability of 1: 2.69 × 10⁴ and 1: 1.25 × 10² respectively. The genetic score values ranging from 4 to 7 are typical for 77.7 % of European populations. The genetic score below 2 was considered to be a reduced rate of sport motivation and a value above 7 for an increased rate of sport motivation. The genetic score of the control population has been similar to predicted distribution in the European population. Distribution of genetic score between selected children shows slightly increased genetic predisposition to better remuneration for activity and/or sport motivation (Fig. 2).
To calculate the risk of muscle pain intensity, a model based on several studies identifying the genetic risk in athletes was constructed. Most genetic markers used in the model were associated with an increased risk in lactate metabolism and creatinine kinase activity differences. The hypothetical range of the genetic score for risk of injury ranged from 0 to 4 (Fig. 3). The mean value in the population (89.4 %) was in the range of the genetic score from 1 to 3. The genetic score below 1 indicated the accumulation of such forms of genes that increase the muscle pain. GS above 3 indicated a minimal manifestation of risk genes in the genotype of the individual causing muscle pain. As outlined in Figure 3, selection of children aged 7 to 8 showed disrupted results. Even in this case, we must state that selection of children based on phenotypic performance does not pro-
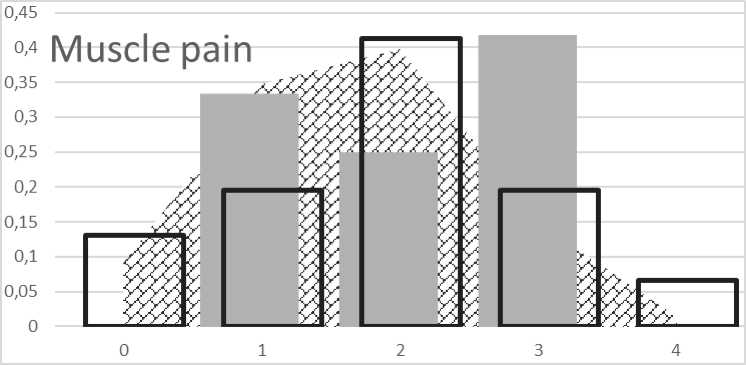
Fig. 3. Distribution of genetic score for muscle pain:
background histogram represents distribution of oxidative capacity in European population. Black bordered columns represent distribution of GS in control group; grey columns represent distribution of GS in selected group
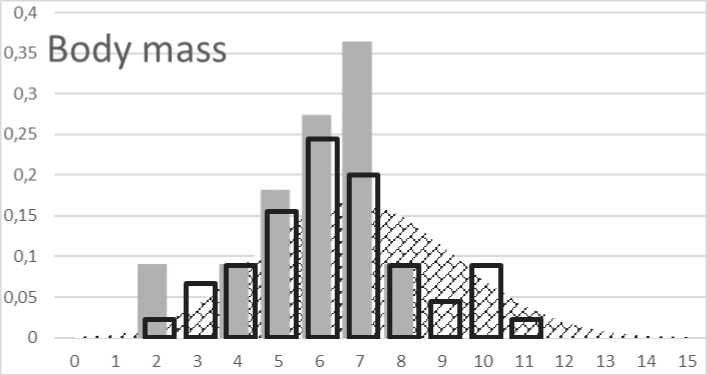
Fig. 4. Distribution of genetic score for body mass:
background histogram represents distribution of oxidative capacity in European population. Black bordered columns represent distribution of GS in control group; grey columns represent distribution of GS in selected group
vide comparable results with genetic predisposition to important adult properties.
The body mass index is one of the decisive factors that define the degree of body fat composition, fat activation, hunger perception and others. The calculated genetic score was based on the observations of several authors, with the cumulative effect of genes and the frequency of individual genes in the European population has being taken into account. The hypothetical value of the genetic score was from 0 to 20. The lowest value of 0 and the highest value of 20 in the European population occur with a probability of 1: 3.28 × 10⁴ and 1: 2.1 × 10⁹ respectively. The genetic score values ranging from 6 to 8 are typical for 48.2 % of European populations. The genetic score below 6 was considered decreasing body mass and a value above 9 to increasing body mass. The genetic score of the control population has been similar to predicted distribution in the European population. Distribution of genetic score between selected children shows significant difference (p < 0.001). Group of selected children has significantly lower genetic predisposition to higher body mass (Fig. 4).
Discussion
There have been huge advances in the field of genomics over the past decade. Rapidly evolving knowledge and technologies have led to wider use and availability of genetic testing. It has been over 10 years since the human genome was mapped. However, there is concern about consis- tency and quality control regarding reported results from direct-to-consumer genetic testing companies to ensuring that genetic testing and research in the area of sport is conducted with adherence to highest standards of evidence-based scientific practice. Talent identification (TID) programs are an integral part of the selection process for elite-level athletes. While many sport organizations utilize TID programs, there does not seem to be a clear set of variables that consistently predict future success [16]. Based on the results of genetic analysis and measurement of motor abilities of selected children aged 7–8 years we can state that genetic testing of young athletes offers a suitable method of identifying performance prerequisites just before their development. Genetic tests can inform trainers and athletes on the type of physical activity (endurance or speed) suitable for the given individual. The results of fitness tests can provide them only with partial information on the momentary state of fitness of children. However, such information can be fruitful for them when developing individual training programs and in discovering talented children. The sole use of genetic analysis can offer only hereditary characteristic of an individual, which, however, need not be developed during the life of the person. Genetic analysis may be considered to be a suitable and practical alternative for fitness-oriented testing of population. Based on the analysis we offered parents and coaches valid information about their children´s prerequisites to a certain group of sports, particularly anaerobic capacity, motivation for sports, muscle pain susceptibility, and type of energetic metabolism.
Conclusion
The analysis of genetic predispositions is currently applied in various fields of professional sports as well as in common activities. Knowledge of genetic predispositions can facilitate decision-making or modify the training system. However, in the field of quantitative genetic traits, it is important to recognize that a single point mutation may have no predictive power and therefore it is essential to develop prediction models that take into account the additive effect of individual alleles or their interactions. Correctly defining the impact of a genetic mutation as well as the probability of its occurrence in a population provides the opportunity to identify individuals with a specific combination of genetic predispositions capable of influencing the phenotype. The research also highlights the fact that selection and control of performance at a young age may not correspond with genetic predisposition in adulthood.
Acknowledgement
This contribution has been supported by the grant project VEGA No.1/0027/17 of the Ministry of Education under the title „Possibilities of genetic testing in sport talent identification“.
References Sports talent search: genes versus motor tests
- Âberg E., Fandino-Losada A., Sjoholm L.K. et al. The Functional Val158Met Polymorphism in Catechol-O-Methyltransferase (COMT) Is Associated with Depression and Motivation in Men from a Swedish Population-Based Study. Journal of Affective Disorders, 2011, vol. 129, no. 1-3, pp. 158-166. DOI: 10.1016/ j.jad.2010.08.009
- Ahmetov I.I., Rogozkin V.A. Genes, Athlete Status and Training - An Overview. Medicine and Sport Science, 2009, vol. 54, pp. 43-71. DOI: 10.1159/000235696
- Ahmetov I.I., Hakimullina A.M., Lyu-baeva E.V. et al. Effect of HIF1A Gene Polymorphism on Human Muscle Performance. Bulletin of Experimental Biology and Medicine, 2008, vol. 146, no. 3, pp. 351-353. DOI: 10.1007/s10517-008-0291-3
- Auton A., Abecasis G.R., Altshuler D M. et al. A Global Reference for Human Genetic Variation. Nature, 2015, vol. 526 (7571), pp. 68-74. DOI: 10.1038/nature15393
- Berndt S.I., Gustafsson S., Mâgi R. et al. Genome-Wide Meta-Analysis Identifies 11 New Loci for Anthropometric Traits and Provides Insights into Genetic Architecture. Nature Genetics, 2013, vol. 45, no. 5, pp. 501-512. DOI: 10.1038/ng.2606
- Bouchard C., Antunes-Correa L.M., Ashley E.A. et al. Personalized Preventive Medicine: Genetics and the Response to Regular Exercise in Preventive Interventions. Progress in Cardiovascular Diseases, 2015, vol. 57, no. 4, pp. 337-346. DOI: 10.1016/j.pcad.2014.08.005
- Bouchard C., Sarzynski M.A., Rice T.K. et al. Genomic Predictors of the Maximal O2 Uptake Response to Standardized Exercise Training Programs. Journal of Applied Physiology, 2011, vol. 110, no. 5, pp. 1160-1170. DOI: 10.1152/japplphysiol.00973.2010
- Buxens A., Ruiz J.R., Arteta D. et al. Can We Predict Top-Level Sports Performance in Power vs Endurance Events? A Genetic Approach. Scandinavian Journal of Medicine and Science in Sports, 2011, vol. 21, no. 4, pp. 570-579. DOI: 10.1111/j. 1600-0838.2009. 01079.x
- Chen C., Sun Y., Liang H. et al. A Meta-Analysis of the Association of CKM Gene Rs8111989 Polymorphism with Sport Performance. Biology of Sport, 2017, vol. 34, no. 4, pp. 323-330. DOI: 10.5114/biolsport.2017.69819
- Döring F., Onur S., Fischer A. et al. A Common Haplotype and the Pro582Ser Polymorphism of the Hypoxia-Inducible Factor-1 (HIF1A) Gene in Elite Endurance Athletes. Journal of Applied Physiology, 2010, vol. 108, pp. 1497-1500. DOI: 10.1152/japplphysiol. 01165.2009
- Ehrenborg E.W., Krook A. Regulation of Skeletal Muscle Physiology and Metabolism by Peroxisome Proliferator-Activated Receptor. Pharmacological Review, 2009, vol. 61, no. 3, pp. 373-393. DOI: 10.1124/pr.109.001560
- Felix J.F., Bradfield J.P., Monnereau C. et al. Genome-Wide Association Analysis Identifies Three New Susceptibility Loci for Childhood Body Mass Index. Human Molecular Genetics, 2015, vol. 25, no. 2, pp. 1-52. DOI: 10.1093/hmg/ddv472
- Gineviciené V., Jakaitiene A., Prancu-lis A. et al. AMPD1 Rs17602729 Is Associated with Physical Performance of Sprint and Power in Elite Lithuanian Athletes. BMC Genetics, 2014, vol. 15, no. 58. DOI: 10.1186/1471-2156-15-58
- Graff M., Scott R.A., Justice A.E. et al. Genome-Wide Physical Activity Interactions in Adiposity - A Meta-Analysis of 200,452 Adults. ed. Todd L. Edwards. PLoS Genetics, 2017, vol. 13, no. 4, e1006528. DOI: 10.1371/journal. pgen.1006528
- Graff M., North K.E., Richardson A.S. et al. BMI Loci and Longitudinal BMI from Adolescence to Young Adulthood in an Ethnically Diverse Cohort. International Journal of Obesity, 2017, vol. 41, no. 5, pp. 759-768. DOI: 10.1038/ijo.2016.233
- Johnston K., Wattie N., Schorer J., Baker J. Talent Identification in Sport: A Systematic Review. Sports Med, 2018, vol. 48, no. 1, pp. 97-109. DOI: 10.1007/s40279-017-0803-2
- Karoly H.C., Stevens C.J., Magnan R.E. et al. Genetic Influences on Physiological and Subjective Responses to an Aerobic Exercise Session among Sedentary Adults. Journal of Cancer Epidemiology, 2012, pp. 1-12. DOI: 10.1155/2012/540563
- Lancaster T.M., Linden D.E., Heerey E.A. COMT Val158met Predicts Reward Responsiveness in Humans. Genes, Brain and Behavior■, 2012, vol. 11, no. 8, pp. 986-992. DOI: 10.1111/j.1601-183X.2012.00838.x
- Machiela M.J., Chanock S.J. LDlink: A Web-Based Application for Exploring Population-Specific Haplotype Structure and Linking Correlated Alleles of Possible Functional Variants. Bioinformatics (Oxford, England), 2015, vol. 31, no. 21, pp. 3555-3557. DOI: 10.1093/bioinformatics/btv402
- Nishida Y., Ivadomi M., Higaki Y. et al. Association between the PPARGC1A Polymorphism and Aerobic Capacity in Japanese Middle-Aged Men. Internal Medicine, 2015, vol. 54, no. 4, pp. 359-366. DOI: 10.2169/internalmedicine.54.3170
- Pickering C., Kiely J. Exercise Genetics: Seeking Clarity from Noise. BMJ Open Sport and Exercice Medicine, 2017, vol. 3, no. 1, e000309. DOI: 10.1136/bmjsem-2017-000309
- Rankinen T., Bouchard C. Genetic Predictors of Exercise Training Response. Current Cardiovascular Risk Reports, 2011, vol. 5, no. 4, pp. 368-372. DOI: 10.1007/s12170-011-0179-z
- Rankinen T., Roth S.M., Bray M.S. et al. Advances in Exercise, Fitness, and Performance Genomics. Medicine & Science in Sports & Exercise, 2010, vol. 42, no. 5, pp. 835-846. DOI: 10.1249/MSS.0b013e3181d86cec
- Rankinen T., Argyropoulos G., Rice T. et al. CREB1 Is a Strong Genetic Predictor of the Variation in Exercise Heart Rate Response to Regular Exercise. Circulation: Cardiovascular Genetics, 2010, vol. 3, no. 3, pp. 294-299. DOI: 10.1161/CIRCGENETICS.109.925644
- Sandholt C.H., Vestmar M.A., Bille D.S. et al. Studies of Metabolic Phenotypic Correlates of 15 Obesity Associated Gene Variants. Ed. Christian Herder. PLoS ONE, 2011, vol. 6, no. 9, e23531. DOI: 10.1371/journal.pone.0023531
- Santiago C., Ruiz J., Buxens A. et al. Trp64Arg Polymorphism in ADRB3 Gene Is Associated with Elite Endurance Performance. British Journal of Sports & Medicine, 2011, vol. 45, no. 2, pp. 147-149. DOI: 10.1136/bjsm. 2009.061366
- Santos C.G.M., Pimentel-Coelho P.M., Budowle B. et al. The Heritable Path of Human Physical Performance: From Single Polymorphisms to the 'next Generation. Scandinavian Journal of Medicine and Science in Sports, 2016, vol. 26, no. 6, pp. 600-612. DOI: 10.1111/sms.l2503
- Thorleifsson G., Walters G.B., Gud-bjartsson D.F. et al. Genome-Wide Association Yields New Sequence Variants at Seven Loci That Associate with Measures of Obesity. Nature Genetics, 2009, vol. 41, no. 1, pp. 18-24. DOI: 10.1038/ng.274
- Willer C.J., Speliotes E.K., Loos R.J. et al. Six New Loci Associated with Body Mass Index Highlight a Neuronal Influence on Body Weight Regulation. Nature Genetics, 2009, vol. 41, no. 1, pp. 25-34. DOI: 10.1038/ng.287
- Zidek R., Simonek J. Talent in Sport. Usti nad Labem, Univerzita J. E. Purkyne, 2019. 102 p.
