Сравнение температуры субавроральной мезопаузы над Якутией с данными радиометра SABER с 2002 по 2014 г

Автор: Аммосова А.М., Гаврильева Г.А., Аммосов П.П., Колтовской И.И.
Журнал: Солнечно-земная физика @solnechno-zemnaya-fizika
Статья в выпуске: 2 т.3, 2017 года.
Бесплатный доступ
Представлена температурная база данных для области мезопаузы, полученная по спектральным измерениям полос (0-1) Атмосферной системы О2(0-1) и ОН(6-2) с помощью спектрографа СП-50 на станции Маймага (63° N, 129.5° E) в течение 2002-2014 гг. Временной ряд температуры включает в себя 11-летний солнечный цикл. Проведено ее сравнение с температурой, полученной радиометром SABER (версии данных v.1.07 и v.2.0), расположенным на спутнике TIMED. Сравнивались температуры, измеренные при пролетах спутника не далее 500 км от точки пересечения линии визирования спектрографа с излучающими слоями гидроксила (~87 км) и кислорода (~95 км). Временной критерий составляет 30 минут. Установлено, что наблюдается сезонная зависимость разности между данными измерений наземным прибором и со спутника. Данные, полученные при помощи SABER v2.0 показали хорошее согласие с температурами, измеренными инфракрасным цифровым спектрографом. На основании проведенного анализа сделан вывод, что ряды вращательных температур, полученных на станции Маймага, могут быть использованы для исследования колебаний температуры различных временных масштабов, в том числе и долговременных трендов на высоте мезопаузы.
Излучение oh и o2, температура мезопаузы
Короткий адрес: https://sciup.org/142103645
IDR: 142103645 | УДК: 550.388 | DOI: 10.12737/22598
Сomparing temperature of subauroral mesopause over Yakutia with SABER radiometer data for 2002-2014
We present the temperature database for the mesopause region, which was collected from spectral measurements of bands O2(0-1) and OH(6-2) with the infrared spectrograph SP-50 at the Maimaga station (63° N; 129.5° E) in 2002-2014. The temperature time series covers 11-year solar cycle. It is compared with the temperature obtained with the Sounding of the Atmosphere using Broadband Emission Radiometry instrument (SABER, v.1.07 and v.2.0), installed onboard the TIMED satellite. We compare temperatures measured during satellite passes at distances under 500 km from the intersection of the spectrograph sighting line with the hydroxyl emitting layer (~87 km) and oxygen emitting layer (~95 km). The time criterion is 30 min. We observe that there is a seasonal dependence of the difference between the ground-based and satellite measurements. The data obtained using SABER v2.0 show good agreement with the temperatures measured with the infrared digital spectrograph. The analysis we carried out allows us to conclude that a series of rotational temperatures obtained at the Maimaga station can be used to study temperature variations on different time scales including long-term trends at the mesopause height.
Текст научной статьи Сравнение температуры субавроральной мезопаузы над Якутией с данными радиометра SABER с 2002 по 2014 г
At present, the comparison between ground and satellite measurements is of topical interest. It is necessary to evaluate possible differences between them for a long period. We compare OH(6-2) and O 2 (0-1) rotational temperatures measured during 2002–2014 (the Maimaga high-latitude station (63° N; 129.5° E) infrared spectrograph) with mesopause kinetic temperatures at ~87 and ~95 km heights measured with the Sounding of the Atmosphere using Broadband Emission Radiometry (SABER) instrument onboard NASA’s TIMED (Thermosphere, Ionosphere, Mesosphere Energetics and Dynamics) spacecraft [Mertens et al., 2001]. Many studies on the comparison between SABER temperatures and those measured with ground-based techniques and instruments have been published in recent years [Remsberg et al., 2008; Smith et al., 2010; French, Mulligan, 2010; Gavrilyeva et al., 2011]. They give an estimate of the offset or bias between data from SABER and ground-based instruments. All of these studies involve relatively short data runs [French and Mulligan, 2010]. We use ground-based data on OH(6-2) and O 2 (0-1) rotational temperatures for 2002–2014, which allow us to examine biases between SABER and Maimaga data obtained over this period.
INSTRUMENTATION AND DATA
The Infrared Digital Spectrograph (IDS) includes the SP-50 diffraction spectrograph and CCD camera. The CCD detector with a thermo-electronic cooling system, which maintains temperature up to –50 °С, makes it possible to perform measurements at the Yakutsk latitude from August to May. IDS simultaneously registers P-branches of the bands of OH(6-2) (the emission height is ~87 km [Baker and Stair, 1988]) and О2(0-1) molecular oxygen (the emission height is ~95 km [Yee et al., 1997]). The spectrograph’s angle of sight is ~9° and is directed westward at a zenith angle of 49° (the field of view is 32×13.7 km at a height of 87 km). The instrument function has an approximate Gaussian form and a half width of ~0.8 nm. The signal-to-noise ratio is ~250. The method for estimating the rotational temperature of molecular emissions is based on the least squares fit of model spectra constructed with regard to the instrument function for different previously specified temperatures to an actually measured spectrum [Gav-rilyeva, Ammosov, 2002]. The model spectrum whose deviation from the actual one is less than the registration noise is considered to correspond most closely to the reality; and the rotational temperature determined based on this spectrum corresponds to the temperature at the mesopause height. During such sampling, rotational temperature values with systematic errors exceeding random ones are excluded from further processing. The estimates indicate that random errors in temperature measurements vary from 2 to 10 K depending on the signal-to-noise ratio. The transition probabilities calculated in [Mies, 1974] have been used to estimate the rotational temperature from the hydroxyl band. The transition probabilities employed to determine the rota- tional temperature from the O2 band (0-1) have been taken from the Atlas of the Airglow Spectrum 3000– 12400 Å [Krassovsky et al., 1962]. For data to be homogeneous it is necessary to acquire them with one device at a single geographic point and process the data using the same transition probabilities throughout the research.
As was indicated above, IDS is installed at the Maimaga optical station, which is located 150 km north of Yakutsk. The observations were made at night at a solar declination angle of >9°. The location of the observation station makes it possible to perform measurements only from the middle of August to the middle of May since the summer mesopause is constantly sunlit at the Yakutsk latitude. The molecular band emission spectra were exposed with a time resolution of 10 min.
The ten-channel infrared radiometer SABER, which facilitates limb measurements of the atmosphere from the troposphere to 350 km, is installed onboard NASA’s TIMED spacecraft. The TIMED mission was launched on December 7, 2001. It has a circular orbit inclined at an angle of 74° to the equator. The vertical profile of the kinetic temperature is calculated from CO 2 15 µm emissions under the condition of non-local thermodynamic equilibrium (non-LTE) at these heights. The algorithm for calculating the temperature profile (which takes into account the non-LTE effect), including all collisional and radiative processes, is described in detail in [Kutepov et al., 2006]. The comparison of SABER measurements with other measurements is used to improve the non-LTE model, which results in a change in the calculated temperature profiles. Our work adopts two versions of SABER temperature profiles v1.07 and v.2.0 (http//saber.larc.nasa.gov). The temperature is measured at 10–120 km with vertical and horizontal resolutions of 2 and 400 km respectively.
As is known, there are no data on the emission layer height and shape during observations when rotational temperatures are measured with groundbased instruments from nightglow emissions. Propagation of wave oscillations can evidently cause vertical variations in the emission layer. For example, Winick et al. [Winick et al. 2009] indicate that planetary waves can change the emission height by 10 km during major stratospheric warming events, which can occur with temperature variations up to 90 K. Similar wave-like disturbances can lead to a considerable difference in temperatures measured with IDS and SABER radiometer. The effect of large-scale waves such as tidal and planetary ones can be decreased by making the angles of sight of both the devices closer to each other. Therefore, we use here the SABER data obtained when the device scanned the OH(6-2) hydroxyl emitting layer (~87 km) and oxygen emitting layer (~95 km) with a radius along the layer not larger than 500 km from the intersection of the IDC line of sight with the OH emitting layer when the spectrum was exposed. The time selection criterion for the temperature measurements is not more than 30 minutes.
DATA ANALYSIS
We have analyzed the observation data acquired from 2002 to 2014. Surveys of the nightglow spectrum are carried out from the middle of August to the middle of May. We have compared the temperatures measured when the spacecraft passes at distances not larger than 500 km from the intersection of the spectrograph’s line of sight with the hydroxyl emitting layer (~87 km) and oxygen emitting layer (~95 km).
The ground-based optical device integrates emission along its field of view; and the rotational temperature, which is determined from the ratio of hydroxyl band intensities, reflects the weighted average rotational temperature of the atmosphere over the emitting layer thickness. It is necessary to distinguish the SABER vertical temperature profile part that would be equivalent to the hydroxyl rotational temperature. The convolution of the volumetric emission vertical profile and the temperature profile gives a temperature equivalent to that measured with the ground-based device. In many works, it is assumed that the density of emitting hydroxyl molecules has a Gaussian vertical distribution in a layer with a thickness of approximately 7–8 km, the maximum of which is centered at a height of 87 km. We use both the theoretical Gaussian hydroxyl emission profile and measured vertical profiles of the hydroxyl emission. The two channels of SABER are intended to make vertical scanning of the airglow in the 1.6 µm region, where OH(5-3) and OH(4-2) bands are emitted, and in the 2.0 µm region of the OH(9-7) and OH(8-6) band emissions. Using vertical distributions of emission intensities in these channels as weight functions for averaging SABER temperatures, we can obtain a temperature equivalent to the temperature measured with the ground-based device. For oxygen, the situation is similar. However, in this case SABER measured only one O 2 (0-1) band emission at 95 km.
The spacecraft’s orbit is such that the measurements coincident in time and space with the Maimaga measurements can be made only from September to the end of March and are interrupted from December to the second half of January. During the period when the spectrum was exposed with the ground-based spectrograph, SABER scanned the limb three–four times. Scanning results were averaged during the analysis. From 2002 to 2014, 997 measurements coincided in time and space for the OH(6-2) band; and 857 measurements, for O 2 (0-1). The time selection criterion for temperature measurements is not more than 30 minutes due to high nighttime hydroxyl and oxygen temperature variations. Moreover, rotational temperature variations in O 2 (0-1) are more significant than hydroxyl band (6-2) rotational temperature variations. Figure 1 shows randomly selected nights of 2007. As you can see, at some nights two averaged values obtained from the spacecraft were recorded.
We are interested here in comparing temperatures at 87 and 95 km, typical heights of the emission peak of the OH and O 2 atmospheric emission layers respectively.
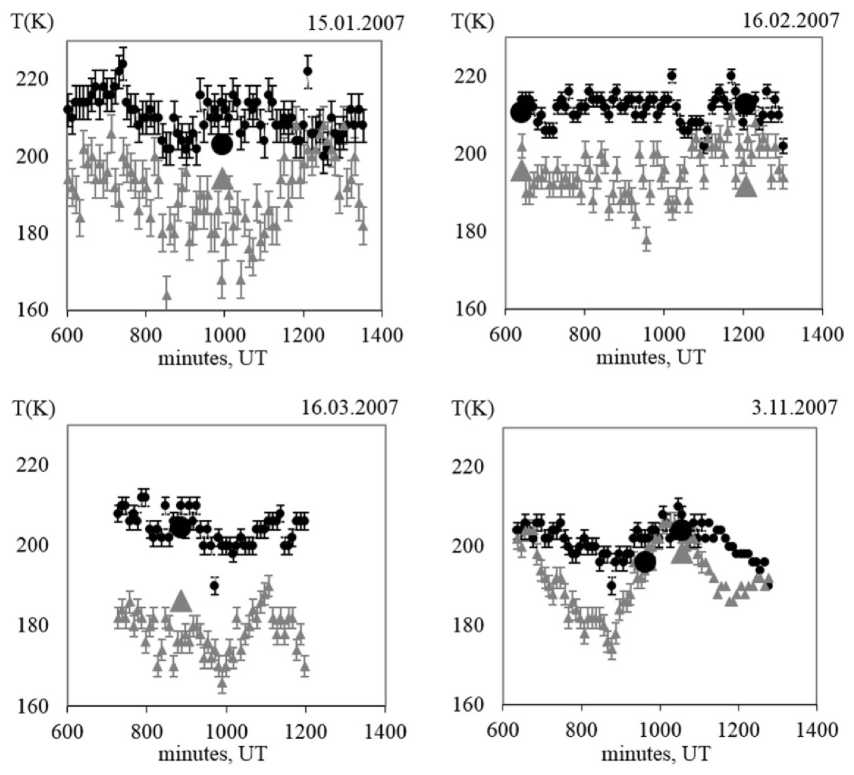
Figure 1. Random nights 2007. Black dots indicate OH (6-2) temperatures with spectrograph errors; black circles mark the temperature measured with SABER at 87 km; the gray triangle is the O 2 (0-1) temperature with errors; the gray big triangle is the temperature measured by SABER at 95 km
We should consider also that SP-50 gives information on the rotational temperatures of the OH(6-2) Meinel band and of the O 2 (0-1) atmospheric band, obtaining an average temperature at the height region where these emission layers are located. To take into account this effect, we have also calculated weighted SABER temperatures at 87 and 95 km by convolving the SABER temperature profiles with typical airglow emission layers of a 10 km width at half the emission maximum.
Figure 2, a shows the temperature obtained with SABER at 87 km and the hydroxyl temperature measured by the spectrograph as a function of the day for each year. Figure 2, b illustrates the difference between them and the trend line characterized by seasonal variations. At 87 km for OH(6-2) in the autumn-winter season, there is no pronounced difference between readings of the instruments. The SABER temperature is higher by 4–5 K than that measured by the spectrograph in spring. The first day of measurements is August 1 as there are no measurements made in summer because of geographical features of the region. Figure 3, a shows the temperature obtained with SABER at 95 km and the oxygen temperature measured at the Maimaga station as a function of the day for each year. Figure 3, b illustrates the difference between them and the trend line. The SABER temperature is higher by up to 9 K than the temperature obtained with the spectrograph in the autumn-winter season and by 5–6 K in spring.
We should also consider that SP-50 provides information on O 2 (0-1) rotational temperatures, measuring the average temperature at the height region, where this emission layer is located. To take into account this effect, we have also calculated weighted SABER temperatures at 95 km by convolving the SABER temperature profiles with typical airglow emission layers of a 10 km width at half the emission maximum.
Figure 4, a illustrates the difference between the average temperature obtained with SABER at 95 km and the average annual temperature of O 2 (0-1) measured by the spectrograph. Figure 4, b shows the difference between the average temperature obtained with SABER at 87 km and the average annual temperature OH(6-2) measured with the spectrograph. The trend line is described by the equation: T =0.8∙year–1660 (R2=0.66). The temperature difference increases by 0.8 K per year, coinciding with the increase in the temperature difference obtained with SABER and ground-based instru-
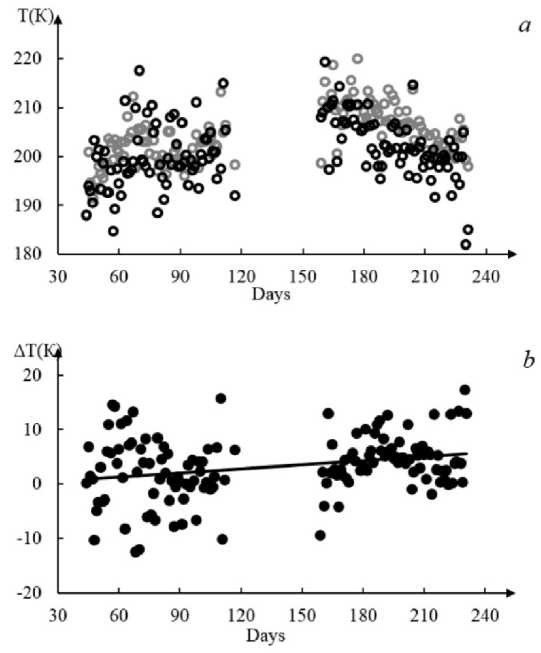
Figure 2. The temperature measured by SABER (gray circles) at 87 km and the OH(6-2) temperature measured by the digital infrared spectrograph (black circles) ( a ). Temperature difference with a linear trend ( b )
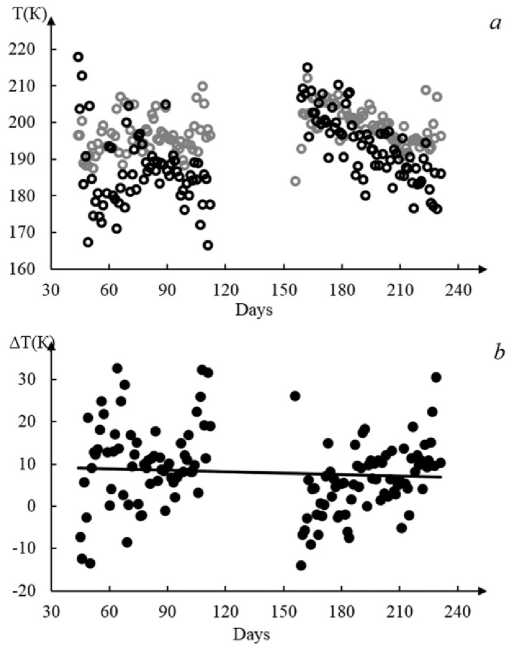
Figure 3. The temperature measured with SABER (gray circles) at 95 km and the O2(0-1) temperature measured with the digital infrared spectrograph (black circles) ( a ). Temperature difference with a linear trend ( b )
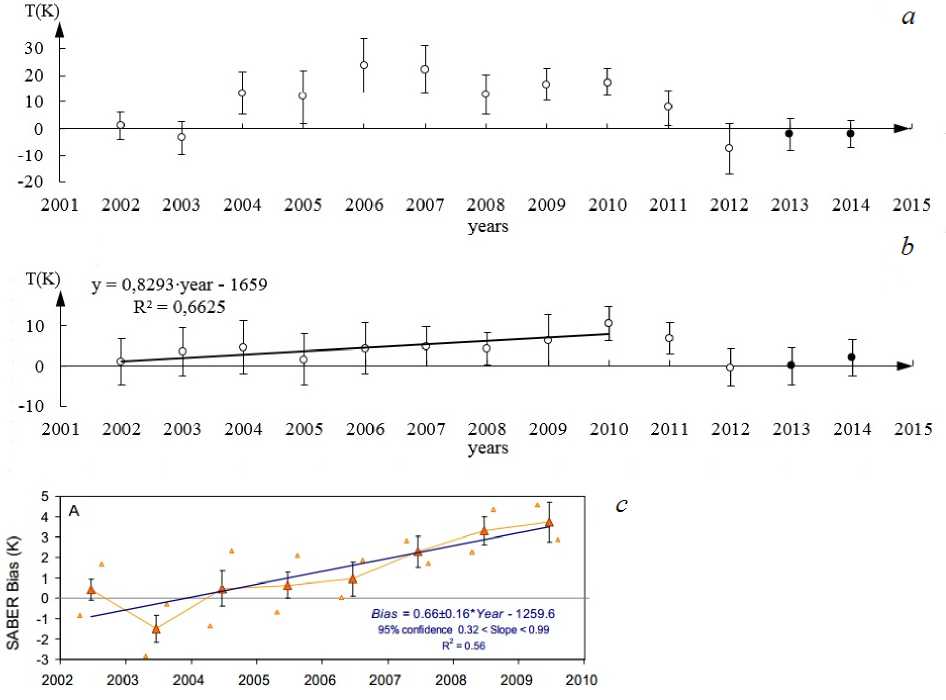
Figure 4. Difference of average annual temperatures obtained with SABER at 95 km and O 2 (0-1) measured with groundbased instruments ( a ). Difference of average annual temperatures obtained with SABER at 87 km and OH(6-2) measured with the spectrograph ( b ). Black dots indicate the temperature difference obtained with the new SABER version v.2.0. For comparison, the Figure shows the temperature difference between SABER v.1.07 and the OH(6-2) temperature measured in Antarctica from 2002 to 2009 ( c ) [French, Mulligan, 2010]
ments, which amounts to ~0.7 K per year [French, Mulligan, 2010]. French and Mulligan compared temperatures measured with SABER v1.07 with the OH(6-2) hydroxyl temperature measured in Antarctica (68° S; 78° E) from 2002 to 2009.
In conclusion, the authors [French and Mulligan, 2010] advised being careful when using SABER data with long time series; however, this concerns the old SABER version v1.07. A new SABER version 2.0 appeared in 2013; developers state that the new version improves algorithms for obtaining temperature profiles. Therefore, the temperature measured with SABER (version v2.0) in 2013 and 2014 is virtually identical to the temperature obtained with our digital infrared spectrograph at both 87 and 95 km.
CONCLUSIONS
From 2002 to 2014, 997 measurements coincided in time and space for the OH(6-2) band and 857 measurements coincided in time and space for O2(0-1). The temperature obtained with SABER (version 1.07) is higher than that obtained with the spectrograph. The new improved version v2.0 of SABER temperature data for 2013– 2014 agrees well with IDS temperature data. The analysis carried out allows us to conclude that a series of hydroxyl and oxygen rotational temperatures can be used to study temperature variations on different time scales, including long-term trends at a temperature emission height
The reported study was funded by RFBR under the research project Nos 16-35-00121 mol_a, 16-35-00204 mol_a, 17-05-00855 A, 15-05-05320 A.
Список литературы Сравнение температуры субавроральной мезопаузы над Якутией с данными радиометра SABER с 2002 по 2014 г
- Baker D.J., Stair A.T. Rocket measurements of the alti¬tude distribution of the hydroxyl airglow. Physica Scripta. 1988, vol. 37, no. 4, pp. 611-622.
- French W.J.R., Mulligan F.J. Stability of temperatures from TIMED/SABER v1.07 (2002-2009) and Aura/MLS v2.2 (2004-2009) compared with OH(6-2) temperatures observed at Davis Station, Antarctica. Atmos. Chem. Phys. 2010, vol. 10, pp. 11439-11446 DOI: 10.5194/acp-10-11439-2010
- Gavrilyeva G.A., Ammosov P.P. Near-mesopause temperatures registered over Yakutia. J. Atmos. Solar Terr. Phys. 2002, vol. 64, pp. 985-990.
- Gavrilyeva, G.A., Ammosov P.P., Koltovskoi I.I. Compari-son of ground-based and satellite measurements of atmospheric temperature in the mesopause region in high-latitude Eastern Siberia. Geomagnetism and Aeronomy. 2011, vol. 51, pp. 557-563.
- Krassovsky V.I., Shefov N.N., Yarin V.I. Atlas of the airglow spectrum 3000-12400 Å. Planet Space Sci. 1962, vol. 9. no. 12, pp. 883-915.
- Kutepov A.A., Feofilov A.G., Marshall B.T., Gordley L.L., Pesnel W.D., Goldberg R.A., Russell III J.M. SABER tempera-ture observations in the summer polar mesosphere and lower thermosphere: Importance of accounting for the CO2 ν2 quanta V-V exchange. Geophys. Res. Lett. 2006, vol. 33, pp. L21809 DOI: 10.1029/2006GL026591
- Mertens C.J., Mlynczak M.G., López-Puertas M., Wintersteiner P.P., Picard R.H., Winick J.R., Gordley L.L., Russell III J.M. Retrieval of mesospheric and lower thermospheric kinetic temperature from measurements of CO2 15 µ Earth limb emission under non-LTE conditions. Geophys. Res. Lett. 2001, vol. 28, pp. 1391-1394.
- Mies F.H. Calculated vibrational transition probabilities of OH(X2Π). J. Molecular Spectroscopy. 1974, vol. 53, no. 2, pp. 150-188.
- Remsberg E.E., Marshall B.T., Garcia-Comas M., Krueger D. Lingenfelser G.S., Martin-Torres J., Mlynczak M.G., Russell J.M., Smith A.K., Zhao Y., Brown C., Gordley L.L., Lopez-Gonzalez M.J., Lopez-Puertas M., She C.-Y., Taylor M.J., Thompson R.E. Assessment of the quality of the version 1.07 temperature-versus-pressure profiles of the middle atmosphere from TIMED/SABER. J. Geophys. Res.-Atmos. 2008, vol. 113, pp. D17101 DOI: 10.1029/2008jd010013
- Smith A.K, Marsh D.R, Mlynczak M.G., Mast J.C. Temporal variations of atomic oxygen in the upper mesosphere from SABER. J. Geophys. Res. 2010, vol. 115, pp. D18309 DOI: 10.1029/2009JD013434
- Winick J., Wintersteiner P.P., Picard R.H., Esplin D., Mlynczak M.G., Russell III J.M., Gordley L.L. OH layer characteristics during unusual boreal winters of 2004 and 2006. J. Geophys. Res. 2009, vol. 114, pp. A02303. DOI: 10.1029/2008JA013688.
- Yee J.H., Crowley G., Roble R.G., Skinner W.R., Burrage M.D., Hays P.B. Global simulations and observations of O(1S), O2(1Σ) and OH mesospheric nightglow emissions. J. Geophys. Res. 1997, vol. 102, no. A9, pp. 19949-19968.
