Stage-wise Sieving with Optimized CNN Ensemble for Enhanced ECG Arrhythmia Detection

Автор: Piyush Mahajan, Amit Kaul
Журнал: International Journal of Intelligent Systems and Applications @ijisa
Статья в выпуске: 3 vol.18, 2026 года.
Бесплатный доступ
Accurate detection of ECG arrhythmias plays a critical role in enabling timely diagnosis and treatment of cardiovascular diseases, which remain the leading cause of mortality worldwide. However, achieving high classification performance remains challenging due to class imbalance, signal variability, and resource constraints in real-time deployments. This study aims to enhance ECG arrhythmia detection accuracy through an optimized ensemble approach combining multiple CNN models with a novel stage-wise sieving strategy. Methodology: Three lightweight CNN models (ShuffleNet, MobileNet-v2, ResNet-18) were integrated into a multi-stage binary classification framework. Each stage systematically eliminated accurately classified arrhythmia classes. The novelty of the proposed approach lies in introducing a stage-wise sieving strategy that incrementally removes well-classified classes, combined with an optimized ensemble fusion of multiple CNN models guided by metaheuristic optimization techniques to boost performance. Optimization techniques, including Particle Swarm Optimization, Whale Optimization Algorithm, Grey Wolf Optimizer, Ant Colony Optimization, and Firefly Algorithm, were applied to improve model fusion. The approach was validated using combined public datasets (PTB-XL, MIT-BIH, and Shaoxing ECG databases). Results: The proposed stage-wise sieving ensemble significantly improved overall classification accuracy by 17.95%, reaching 96.29% accuracy using the Grey Wolf Optimizer. Classes previously misclassified, such as Conduction Disturbance and Hypertrophy, exhibited accuracy improvements of up to 32.44% and 25.19%, respectively. Conclusion: The proposed optimized ensemble approach significantly enhances ECG arrhythmia detection performance and demonstrates feasibility for real-time deployment on resource-constrained platforms such as Raspberry Pi.
ECG, Arrhythmia Detection, Deep Learning, CNN Ensemble, Optimization, Stage-wise Sieving, Grey Wolf Optimizer
Короткий адрес: https://sciup.org/15020399
IDR: 15020399 | DOI: 10.5815/ijisa.2026.03.09
Текст научной статьи Stage-wise Sieving with Optimized CNN Ensemble for Enhanced ECG Arrhythmia Detection
Published Online on June 8, 2026 by MECS Press
In the post COVID-era, human health and wellness have significantly drawn the attention of researchers worldwide. Experts from diverse domains are collaboratively making concerted efforts to develop more efficient diagnostic tools aimed at reducing fatality rates. According to the World Health Organization (WHO), the top three diseases resulting in the highest fatalities globally are associated with cardiac abnormalities as depicted in Table 1. Ischemic heart disease, stroke, and coronary heart disease consistently rank among the leading causes of death, irrespective of economic status or gender, with their prevalence showing a concerning increase compared to previous decades. Consequently, cardiovascular diseases (CVDs) remain a major global health concern, particularly given the scarcity of cardiologists per capita in developing regions. Therefore, developing advanced, accurate, and automated diagnostic tools for early detection and effective intervention in CVDs has become imperative.
This work is open access and licensed under the Creative Commons CC BY 4.0 License.
Deep learning (DL) techniques, especially convolutional neural networks (CNNs), have significantly enhanced diagnostic accuracy in classifying CVDs from electrocardiogram (ECG) signals [1, 2]. Recent advancements also explore the use of attention-based architectures and transformer models to capture long-range dependencies and subtle waveform variations in ECG signals [3, 4]. Ensemble learning and optimization techniques have been increasingly incorporated to further improve model robustness and overcome challenges such as class imbalance and noisy data [5, 6]. Despite these advances, challenges related to model generalization, interpretability, and efficient deployment on low-power devices remain open problems.
Table 1. Top 10 causes of global deaths in the years 2019 and 2000 according to world health organization (WHO) data
|
S.No |
Disease |
Global Deaths 2019 |
Global Deaths 2000 |
||||
|
Total |
Men |
Women |
Total |
Men |
Women |
||
|
1 |
Ischemiac Heart Disease |
8,884,887 |
4,847,657 |
4,037,229 |
6,755,954 |
3,549,390 |
3,206,563 |
|
2 |
Chronic Obstructive Pulmonary Disease |
3,227,873 |
1,858,369 |
1,369,503 |
2,986,236 |
1,696,975 |
1,289,261 |
|
3 |
Stroke |
3,072,131 |
1,477,581 |
1,594,551 |
2,471,083 |
1,086,769 |
1,384,314 |
|
4 |
Lower Respiratory Infections |
2,593,098 |
1,370,800 |
1,222,298 |
3,050,943 |
1,600,972 |
1,449,971 |
|
5 |
Neonatal Conditions |
2,037,549 |
1,130,484 |
907,065 |
3,198,431 |
1,752,629 |
1,445,802 |
|
6 |
Trachea, Bronchus, Lung Cancer |
1,784,109 |
1,211,681 |
572,428 |
1,205,688 |
863,693 |
341,996 |
|
7 |
Alzheimer Disease |
1,639,085 |
578,592 |
1,060,493 |
583,639 |
196,566 |
387,073 |
|
8 |
Diarrhoeal Diseases |
1,519,229 |
707,304 |
811,925 |
2,647,914 |
1,256,913 |
1,391,001 |
|
9 |
Diabetes Mellitus |
1,496,094 |
730,234 |
765,860 |
877,288 |
404,827 |
472,461 |
|
10 |
Kidney Diseases |
1,334,324 |
697,452 |
636,872 |
812,795 |
421,982 |
390,813 |
Despite notable advancements in ECG arrhythmia detection using DL methods, challenges such as handling severe class imbalance, minimizing misclassifications in clinically critical classes, and ensuring real-time deployment feasibility remain unresolved. Most existing works focus either on achieving high global accuracy or on complex model architectures, often ignoring resource constraints and explainability requirements in clinical settings. Moreover, ensemble techniques, although promising, frequently fail to exploit a systematic elimination of easier classes, resulting in suboptimal learning for harder classes. Addressing these challenges is essential to develop a robust, deployable, and accurate arrhythmia classification system.
This study is motivated by the need to bridge these gaps by proposing an optimized ensemble learning framework that systematically sieves arrhythmia classes using a multi-stage approach, thus focusing the learning capacity of CNN models progressively on more challenging classes. Furthermore, incorporating multiple metaheuristic optimizers allows for dynamic model fusion, maximizing classification performance without relying on computationally intensive retraining.
The main contributions of this work are summarized as follows:
• A novel stage-wise sieving strategy is introduced to progressively eliminate confidently classified classes, enhancing model focus on difficult cases.
• An optimized CNN ensemble approach is developed using ShuffleNet, MobileNet-v2, and ResNet-18 models, tailored for real-time, resource-constrained deployment.
• Five different metaheuristic optimizers (PSO, WOA, GWO, ACO, FA) are integrated for dynamic fusion of model predictions to maximize ensemble performance.
• Performance is evaluated comprehensively across three public ECG databases (PTB-XL, MIT-BIH, Shaoxing ECG), demonstrating significant improvements in classification accuracy.
• A lightweight real-time classification prototype is implemented on Raspberry Pi 4, validating the system’s practical applicability.
2. Related Works
3. Methodology3.1. Datasets Used
The rest of the paper is organized as follows: Section 2 presents a detailed review of existing DL, ensemble, and optimization strategies for ECG arrhythmia classification. Section 3 describes the datasets used, the proposed methodology, and the stage-wise sieving framework. Section 4 presents the experimental setup, performance evaluation, and detailed analysis. Finally, Section 5 concludes the study and outlines potential directions for future research.
DL-based ECG Classification. CNNs have become the foundation of many recent ECG classification systems. Hu et al. proposed ECG-DETR, a transformer-based network that simultaneously localizes and classifies every heartbeat without explicit beat segmentation, achieving strong performance on continuous ECG segments [3]. Kim et al. developed a hybrid CNN–Transformer model using the Stockwell transform to represent ECG signals as time–frequency images, allowing CNNs to extract local features and transformers to model global dependencies [4]. Bayani and Kargar proposed LDCNN, a lightweight deep convolutional network for arrhythmia detection, demonstrating efficient learning without excessively deep architectures [2]. These studies highlight the shift from simple CNN architectures toward hybrid and transformer-based models for ECG interpretation.
Ensemble Learning Techniques. Ensemble learning strategies have shown promise in improving ECG classification robustness. Din et al. fused deep spatial–temporal features extracted from multiple models (CNN, CNN– LSTM, Transformer) and applied voting mechanisms with SVM, random forest, and logistic regression classifiers, resulting in improved performance over standalone models [5]. Mandala et al. introduced a boosting-based ensemble called FTBO for multi-lead ECG analysis, achieving better sensitivity and specificity compared to single classifiers [6]. These ensemble approaches exploit complementary model strengths to address limitations like overfitting and class imbalance.
Optimization and Sieving Approaches. Beyond architecture, optimization-based strategies have been explored for refining ECG classification. Mandala et al. developed OCADN, which applies extensive hyperparameter tuning to CNN architectures combined with wavelet-based preprocessing, achieving improved multi-class arrhythmia detectio n [7]. Such optimization techniques, along with systematic sieving of predictions through multi-stage decision frameworks, are increasingly being recognized as powerful means to improve arrhythmia classification performance without excessively increasing model complexity.
In summary, modern ECG arrhythmia classification research is evolving toward hybrid CNN–transformer models, robust ensemble learning frameworks, and optimization-driven multi-stage designs. These advances guide the development of more accurate and deployable diagnostic tools.
This work aims to improve classification accuracy for CVD detection by employing a stage-wise sieving strategy through an ensemble of three CNN models optimized at each stage. The proposed methodology focuses on accurately classifying six types of cardiac conditions from ECG data. The following subsections provide detailed descriptions of the datasets used, preprocessing techniques, and the proposed classification framework.
Three publicly available ECG datasets were employed for training and evaluating the proposed models: the PTB XL Diagnostic ECG Database [8], the MIT-BIH Arrhythmia Database [9], and the Chapman University and Shaoxing Hospital Zhejiang University School of Medicine ECG Database [10]. Although each dataset comprises different diagnostic classes, overlaps allowed the creation of a more balanced combined dataset, effectively mitigating class imbalance issues.
-
A. PTB XL Diagnostic ECG Database
The PTB XL database consists of ECG recordings with 21 leads, including 12 standard leads and 9 additional leads. It includes data from 29,052 patients, with each recording lasting between 15 to 30 minutes, sampled at 1000 Hz. Due to the inherent class imbalance, four prominent diagnostic classes—Healthy, Conduction Disturbance (CD), Myocardial Infarction (MI), and Hypertrophy (HYP)—were selected for inclusion:
-
• Healthy ECG (Healthy): Normal ECG signals characterized by consistent P waves, QRS complexes, and T waves.
-
• Conduction Disturbance (CD): ECG signals with delayed or disrupted conduction, indicated by abnormalities in the AV node or bundle branches.
-
• Myocardial Infarction (MI): Signals indicative of a heart attack, characterized by ST-segment deviations.
-
• Hypertrophy (HYP): Signals reflecting enlarged heart muscle, recognizable by increased voltage amplitudes.
-
B. MIT-BIH Arrhythmia Database
This widely used dataset includes 48 half-hour ECG recordings sampled at 360 Hz from 47 patients, annotated for various arrhythmias. Data from the MIT-BIH dataset supplemented overlapping classes from PTB XL, while two additional classes were considered:
-
• Atrial Fibrillation (AFIB): ECG signals characterized by irregular atrial rhythms, absence of clear P waves, and chaotic fibrillatory waves.
-
• Supraventricular Arrhythmia (SUP): Signals indicating abnormal rhythms originating above the ventricles, such as premature atrial contractions and atrial tachycardias.
-
C. Shaoxing Hospital Zhejiang University ECG Database
Developed collaboratively by Chapman University and Shaoxing People’s Hospital, this database contains ECG recordings from over 10,000 patients, each with a 12-lead ECG sampled at 500 Hz over 10 seconds. Four classes were selected:
-
• Atrial Fibrillation (AFIB), Healthy, Supraventricular Arrhythmia (SUP): Defined previously.
-
• Sinus Bradycardia (SB): Characterized by a slower-than-normal heart rate (below 60 bpm), originating from the sinoatrial node.
-
3.2. Pre-processing and Image Generation
For this study, a balanced subset of 3500 ECG records was utilized, comprising 500 samples from each of the seven diagnostic classes. Each record was segmented into 10-second waveforms. This duration was chosen to optimize computational efficiency while retaining sufficient information for accurate arrhythmia classification.
To capture both temporal and spectral features, Continuous Wavelet Transform (CWT) using the Symlet 4 wavelet was applied to generate time-frequency representations of the ECG signals. The CWT was configured with 12 voices per octave, enabling high-resolution analysis across continuous frequency bands. The Symlet 4 wavelet was selected due to its suitability in preserving critical morphological ECG features such as P waves, QRS complexes, and T waves, while effectively minimizing noise and irrelevant variations. The resulting wavelet-transformed images serve as robust input features for CNN models, enhancing their capability to recognize subtle patterns and characteristics inherent in ECG signals.
Examples of wavelet-transformed images generated from each ECG class are illustrated in Fig.1. The preprocessed images subsequently serve as input data for training and evaluating the proposed CNN models detailed in the following subsection.
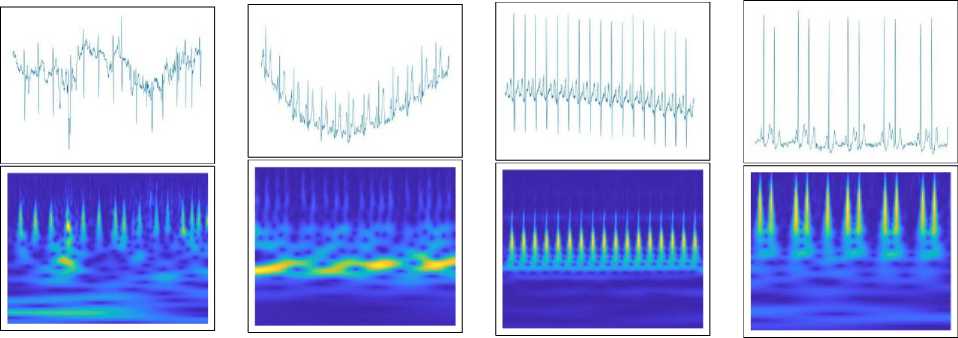
(a) AFIB (b) CD (c) Healthy (d) HYP
(e) MI (f) SB (g) SUP
Fig.1. All classes with their time domain waveforms and corresponding wavelet transformed images
-
3.3. CNN Models Used
Initially, five CNN architectures—ShuffleNet, MobileNet, ResNet-18, EfficientNet, and DenseNet—were evaluated. Although all architectures demonstrated accuracy above 90%, three models were specifically selected for the final ensemble based on their balance between computational efficiency and accuracy: ShuffleNe t [11], MobileNe t [12], and ResNet-18 [13]. These models were chosen for their suitability in real-time applications on low-cost, resource-constrained hardware such as the Raspberry Pi 4 [14].
ShuffleNet and MobileNet are lightweight architectures known for their minimal parameter counts and computational efficiency, making them particularly suitable for devices with limited resources. ShuffleNet employs group convolutions and channel shuffling to efficiently exchange information across channels, while MobileNet leverages depthwise separable convolutions to significantly reduce model complexity and computational overhead.
ResNet-18, though relatively more complex in terms of parameter count, provides robust feature extraction capabilities through its residual connections, effectively addressing the vanishing gradient problem common in deep networks. This contributes significantly to classification performance, especially for complex patterns.
-
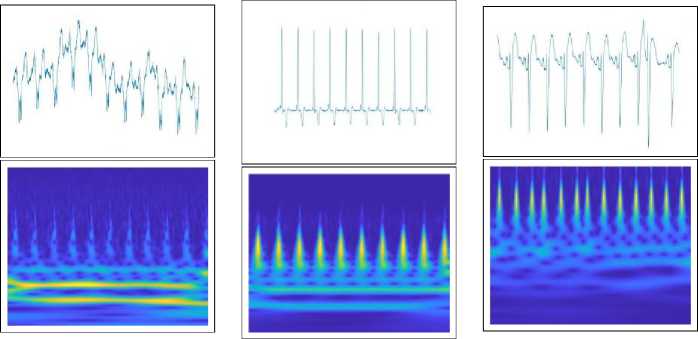
Fig.2. illustrates a generalized CNN architecture used in this study, highlighting key layers such as convolutional layers for spatial feature extraction, activation layers (e.g., Rectified Linear Unit—ReLU) for introducing non-linearity, pooling layers for dimensionality reduction, dropout layers for overfitting prevention, and fully connected layers leading to the final output.
-
3.4. Optimizers
The selected CNN models were trained on preprocessed wavelet-transformed images as described previously. The trained models’ outputs were subsequently combined using an optimized weighting strategy within the proposed StageWise Optimal Ensemble Learning (SSOEL) approach, detailed in the following subsection. This ensemble method allows thorough evaluation and leverages the complementary strengths of each CNN architecture, thereby significantly enhancing arrhythmia classification accuracy.
Optimizers, or optimization algorithms, automate the process of finding optimal parameter settings that minimize or maximize a defined objective function. In this study, five distinct optimization algorithms were employed due to their proven capability to navigate complex multidimensional search spaces effectively. Each optimizer was selected based on its distinctive strengths in balancing exploration (searching broadly for solutions) and exploitation (refining promising solutions), crucial for fine-tuning the weights of CNN models within the ensemble framework. Utilizing multiple optimization strategies increases the probability of converging toward the global optimum, enhancing overall ensemble classification performance. The optimizers utilized are briefly described below:
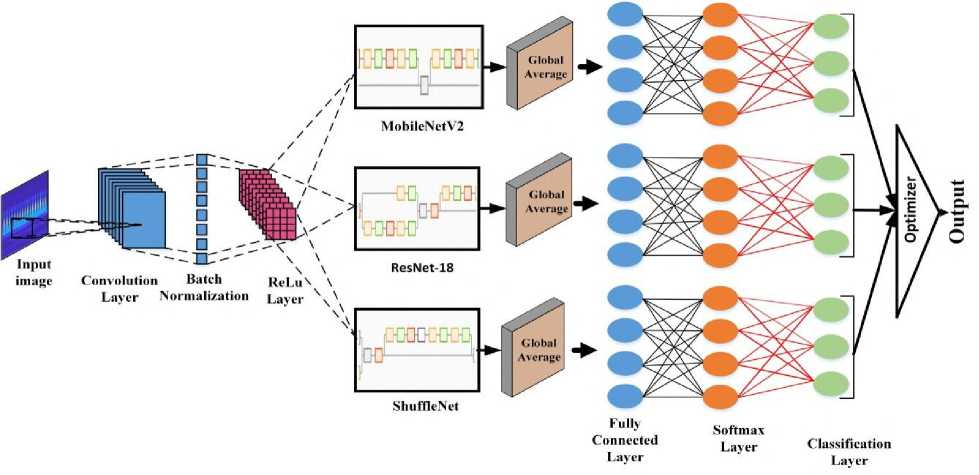
Fig.2. The structure of the CNN models
-
• Particle Swarm Optimization (PSO) [15]: A population-based optimization technique inspired by bird flocking and fish schooling behaviors. It iteratively updates particle positions based on individual and collective experiences to converge towards the optimal solution.
-
• Whale Optimization Algorithm (WOA) [16]: Inspired by humpback whales’ hunting behavior, this algorithm strategically balances exploration and exploitation through mathematical simulations of whale behaviors to refine search agent positions.
-
• Grey Wolf Optimization (GWO) [17]: Mimics grey wolves’ hierarchical social structures and cooperative hunting strategies. The algorithm progressively updates search agent positions based on the hierarchy-driven phases of exploration and exploitation to achieve optimal solutions.
-
• Ant Colony Optimization (ACO) [18]: Modeled on ants’ natural foraging behaviors, this algorithm effectively determines optimal pathways through simulated pheromone trails, facilitating convergence toward the most efficient solutions.
-
• Firefly Algorithm (FA) [19]: Inspired by the flashing patterns of fireflies, this algorithm utilizes attraction-
- based behavior where brighter fireflies (better solutions) attract dimmer ones, progressively guiding the population towards optimal convergence.
-
3.5. Stage-Wise Sieving Through Optimal Ensemble Learning (SSOEL)
In healthcare, correct disease detection is critical, and the proposed Stage-Wise Sieving Through Optimal Ensemble Learning (SSOEL) framework aims to significantly improve classification accuracy, particularly for challenging and fre- quently misclassified classes. Accurate detection has a direct impact on patient care and treatment outcomes, making robust classification systems indispensable. The central idea behind the SSOEL approach is to systematically eliminate classes one by one across multiple stages, thereby allowing the classifiers to focus progressively on harder-to-classify classes. At each stage, CNN models are trained as binary classifiers to distinguish a single class from the rest of the classes. The overall architecture of the proposed methodology is illustrated in Fig.3.
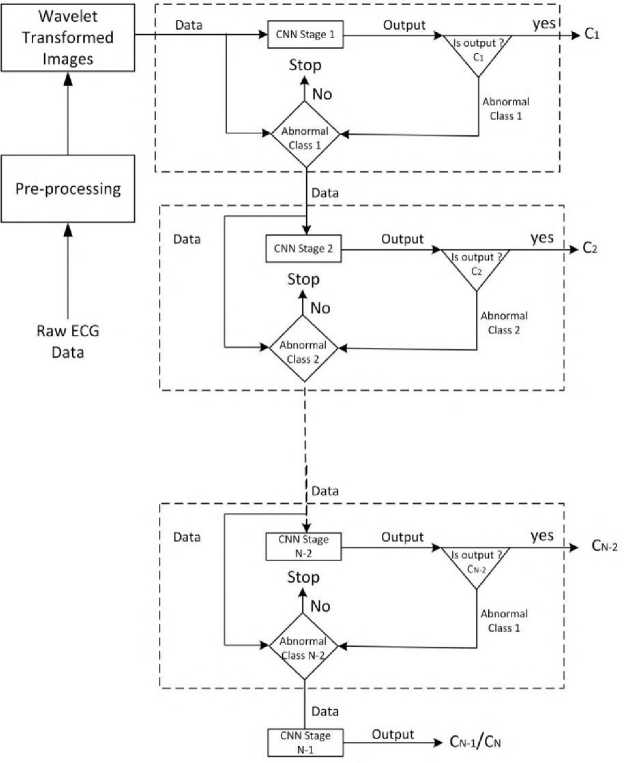
Fig.3. The proposed stage-wise sieving technique
Algorithm 1 Stage-Wise Sieving Strategy
-
0: Train an ensemble of CNN models in a multi-class setting on all N classes.
-
0: Evaluate per-class classification accuracies and rank classes in descending order of accuracy.
-
0: for each stage i from 1 to N - 1 do
-
0: Select the class C i with the highest current classification accuracy.
-
0: Reframe the problem as a binary classification: Class C i versus remaining classes ( N - i classes).
-
0: Retrain CNN models at each stage for this binary problem.
-
0: If i = N - 1 , stop; else, eliminate class C i and proceed to next stage.
-
0: end for =0
The formal description of the stage-wise sieving process is summarized in Algorithm 1: At each sieving stage, the best-performing class is confidently separated, and the model retrains with the remaining classes, progressively focusing its learning on increasingly difficult distinctions.
Objective Function: As part of the suggested methodology, the ensemble strategy uses three CNN models, M 1 , M 2 , and M 3 . For a given class C , each model offers probability predictions, denoted as P M 1 ( C ), P M 2 ( C ), and P M 3 ( C ). An optimization procedure determines the weights ( w 1 , w 2 , and w 3 ) for these models, resulting in a weighted prediction for the class, P C , defined as:
P C = w 1 P M 1 (C) + w 2 P M 2 (C) + w 3 P M 3 (C) (1)
The goal of the optimization is to maximize the classification accuracy of the ensemble. However, optimization algorithms typically minimize an objective function. Therefore, the objective function is defined as the negative of the classification accuracy:
OF = - Accuracy (2)
Minimizing negative accuracy is equivalent to maximizing actual classification accuracy. This approach enables the use of minimization-based optimization algorithms like PSO, WOA, and GWO without altering their underlying mechanics. By minimizing the negative of accuracy, the optimization framework ensures that weight adjustments consistently push the ensemble toward better prediction capability. Models that exhibit higher confidence and lower misclassification rates are automatically assigned greater influence through optimized weighting. Consequently, this strategy enhances the ensemble’s robustness and ensures improved classification performance, particularly for complex or borderline ECG patterns.
Computational Requirements
All model development, training, and optimization procedures were conducted using MATLAB R2023b on a system configured with an Intel Core i5-6200U CPU, 16 GB RAM, and an NVIDIA GeForce 940M GPU (2 GB VRAM). Although the 940M is a lower-end GPU, the training was feasible due to the lightweight nature of the selected CNN architectures. For real-time testing, the proposed ensemble framework was deployed on a Raspberry Pi 4 Model B, equipped with 4 GB RAM and a quad-core ARM Cortex-A72 processor clocked at 1.5 GHz. The average inference time per sample was measured to be approximately 1.3 seconds, with the system operating at a power consumption level of around 2 W. This demonstrates the suitability of the proposed methodology for deployment in portable, low-power healthcare devices. The results of applying the proposed SSOEL approach are discussed in detail in the following section under “Results and Discussion.”
4. Results and Discussions
In the suggested approach, a critical step is the multi-stage elimination. Initially, this approach was applied to each of the three datasets separately. Table 2. presents the comparative results obtained before and after applying the stagewise elimination technique to these datasets. The table shows an average increase in testing accuracy of 5.269% for ShuffleNet, 3.72% for MobileNet, and 4.30% for ResNet-18. Notably, the classes in the PTB XL Diagnostic Dataset presented major difficulties. To improve the approach, the next step was to test it on a larger dataset. As a result, the technique was applied to the combined dataset of the three, as described in the following paragraph.
Table 2. Comparison of results before and after implementing the stage-wise elimination technique on individual datasets
|
Dataset Used |
Model Used |
Classification results before applying the stage-wise elimination approach |
Classification results after applying the stage-wise elimination approach |
||
|
Training accuracy |
Testing accuracy |
Training accuracy |
Testing accuracy |
||
|
MIT-BIH Arrhythmia Dataset |
ShuffleNet |
100% |
95.05% |
99% |
98.27% |
|
MobileNet |
97.88% |
96.85% |
99% |
98.70% |
|
|
ResNet-18 |
95.29% |
94.14% |
99% |
97.65% |
|
|
PTB XL Diagnostic Dataset |
ShuffleNet |
99.34% |
86.97% |
98% |
91.79% |
|
MobileNet |
98.43% |
90.75% |
99% |
94.29% |
|
|
ResNet-18 |
100% |
91.15% |
98% |
93.18% |
|
|
Shaoxing Hospital Zhejiang University School of Medicine ECG Database |
ShuffleNet |
98.22% |
90.08% |
100% |
96.28% |
|
MobileNet |
91.31% |
89.68% |
98% |
94.48% |
|
|
ResNet-18 |
97.67% |
88.14% |
98% |
94.29% |
|
Prior to performing the multi-stage elimination on the combined dataset, all five CNN model types were trained to classify combined input data into the following seven categories: AFIB, CD, Healthy, HYP, MI, SB and SUP. Table 3. displays the classification accuracy attained by the models. As emphasized previously, a crucial aspect of this algorithm is its suitability for deployment on less computation-intensive hardware, facilitating the development of portable disease diagnosis devices. Since the accuracy of all CNNs falls within a similar range, three specific models were selected for the proposed multistage process: ShuffleNet, MobileNet-v2, and ResNet-18. The choice of these models is driven by their compatibility with low-cost devices.
Table 3. Accuracy metrics for training and validation obtained by five CNN models
|
S.No |
CNN Model |
Model Details |
Accuracy(%) |
|
|
Training |
Validation |
|||
|
1 |
ShuffleNet |
Depth: 50 layers Parameters:1.40M |
99.54 |
91.29 |
|
2 |
MobileNet-v2 |
Depth: 53 layers Parameters:3.40M |
95.83 |
86.45 |
|
3 |
ResNet-18 |
Depth: 18 layers Parameters:11.7M |
100.00 |
91.14 |
|
4 |
EfficientNet-b0 |
Depth: 82 layers Parameters:5.31M |
100.00 |
87.84 |
|
5 |
DenseNet-201 |
Depth: 201 layers Parameters:20.0M |
99.98 |
89.72 |
Table 4. presents the classification results, which indicate the class accuracies required to ensure the suggested approach runs well. When one looks closely at the tables, you can see that several classes are comparatively inaccurate, especially CD and HYP. The fact that the SB and SUP classes show better accuracy than the other classes suggests that the models have difficulty correctly categorizing cases that belong to the remaining classes. The goal of the suggested filtering procedure is to overcome these drawbacks and improve classification performance across the board for all classes. The multistage process starts with categorizing input data into Healthy and Abnormal categories, with six classes (AFIB, CD, HYP, MI, SB, and SUP) classified as Abnormal. All models, when trained as binary classifiers, attain a perfect 100% accuracy in differentiating Healthy from Abnormal data. Following that, the Healthy class is isolated, and CNN models are trained using ECG data from the remaining six classes. The SUP class is correctly classified with 100% accuracy; hence the remaining classes are labeled as Abnormal. Once again, the models demonstrate a high degree of accuracy (ShuffleNet and MobileNet 100%, ResNet 98.26%) when separating abnormal from SUP. This method is used iteratively to categorize MI, AFIB, SB, CD, and HYP, enhancing accuracy. Table 5. displays the results obtained after applying the proposed approach. Classes Healthy and MI showed a drastic improvement in classification accuracy. In addition to tabular metrics, confusion matrices for all three CNN models are shown in Fig. 4., highlighting class-wise performance and illustrating the improvements achieved through the proposed multistage sieving strategy.
Although the multistage process improved the performance of CNN models but classes CD and HYP continued to perform poorly. Hence optimizers (PSO, WAO, GWO, ACO and FA) are incorporated at each stage to improve overall outcomes by revising weights based on predictions from all three models. Hence now the approach shifted from multistage phase to the optimized ensemble stage. Models were tested using all these five optimizers one by one.
Table 4. Classification results of CNN models on combined dataset
|
S.No |
CNN Model |
Parameters |
Classes |
||||||
|
AFIB |
CD |
Healthy |
HYP |
MI |
SB |
SUP |
|||
|
1 |
ShuffleNet |
Accuracy |
85.06 |
50.00 |
83.19 |
60.24 |
79.82 |
95.83 |
97.35 |
|
Precision |
86.18 |
86.84 |
86.09 |
64.10 |
93.55 |
98.29 |
100.00 |
||
|
Recall |
98.50 |
54.10 |
96.12 |
90.91 |
84.47 |
97.46 |
97.35 |
||
|
Specificity |
96.93 |
99.34 |
97.76 |
96.32 |
99.16 |
99.71 |
100.00 |
||
|
F-measure |
91.93 |
66.67 |
90.83 |
75.19 |
88.78 |
97.87 |
98.65 |
||
|
2 |
MobileNet-v2 |
Accuracy |
85.53 |
51.39 |
80.95 |
55.70 |
76.92 |
90.77 |
93.81 |
|
Precision |
87.25 |
77.08 |
81.60 |
64.71 |
98.77 |
90.77 |
100.00 |
||
|
Recall |
97.74 |
60.66 |
99.03 |
80.00 |
77.67 |
100.00 |
93.81 |
||
|
Specificity |
97.22 |
98.54 |
96.77 |
96.85 |
86.96 |
98.28 |
100.00 |
||
|
F-measure |
92.20 |
67.89 |
89.47 |
71.54 |
99.86 |
95.16 |
96.80 |
||
|
3 |
ResNet-18 |
Accuracy |
82.91 |
58.97 |
82.93 |
54.29 |
78.85 |
93.55 |
93.04 |
|
Precision |
83.97 |
73.02 |
83.61 |
71.70 |
98.80 |
95.08 |
98.17 |
||
|
Recall |
98.50 |
75.41 |
99.02 |
69.09 |
79.61 |
98.31 |
94.69 |
||
|
Specificity |
96.34 |
97.75 |
97.19 |
98.03 |
99.86 |
99.14 |
99.72 |
||
|
F-measure |
90.66 |
74.19 |
90.67 |
70.37 |
88.17 |
96.67 |
96.40 |
||
Table 5. Classification results after applying Multi-stage Process on combined dataset
|
S.No |
CNN Model |
Parameters |
Classes |
||||||
|
AFIB |
CD |
Healthy |
HYP |
MI |
SB |
SUP |
|||
|
1 |
ShuffleNet |
Accuracy |
87.25 |
58.23 |
95.42 |
52.86 |
99.03 |
91.47 |
100.00 |
|
Precision |
89.04 |
71.88 |
98.94 |
71.15 |
100.00 |
91.47 |
100.00 |
||
|
Recall |
97.74 |
75.41 |
96.40 |
67.27 |
99.03 |
100.00 |
100.00 |
||
|
Specificity |
97.24 |
67.27 |
94.17 |
75.41 |
100.00 |
95.53 |
100.00 |
||
|
F-measure |
93.19 |
73.60 |
97.65 |
69.16 |
99.51 |
95.55 |
100.00 |
||
|
2 |
MobileNet-v2 |
Accuracy |
80.00 |
53.95 |
89.48 |
53.33 |
99.04 |
88.72 |
100.00 |
|
Precision |
82.58 |
73.21 |
97.10 |
66.67 |
99.04 |
88.72 |
100.00 |
||
|
Recall |
96.24 |
67.21 |
91.94 |
72.73 |
100.00 |
100.00 |
100.00 |
||
|
Specificity |
95.34 |
72.73 |
84.47 |
67.21 |
99.73 |
93.90 |
100.00 |
||
|
F-measure |
88.89 |
70.09 |
94.45 |
69.57 |
99.52 |
94.02 |
100.00 |
||
|
3 |
ResNet-18 |
Accuracy |
87.83 |
57.14 |
96.23 |
54.17 |
100.00 |
95.93 |
98.26 |
|
Precision |
98.06 |
73.33 |
99.82 |
69.64 |
100.00 |
95.93 |
98.26 |
||
|
Recall |
89.38 |
72.13 |
96.40 |
70.91 |
100.00 |
100.00 |
100.00 |
||
|
Specificity |
99.67 |
70.91 |
99.03 |
72.13 |
100.00 |
97.97 |
99.57 |
||
|
F-measure |
93.52 |
72.73 |
98.08 |
70.27 |
100.00 |
97.93 |
99.12 |
||
Table 6. Classification accuracy after applying SSOEL
|
S.No |
Optimization Technique Used |
Classes |
||||||
|
AFIB |
CD |
Healthy |
HYP |
MI |
SB |
SUP |
||
|
1 |
Particle Swarm Optimization (PSO) |
97.19 |
63.79 |
100.00 |
63.79 |
100.00 |
98.63 |
100.00 |
|
2 |
Whale Optimization Algorithm (WOA) |
97.89 |
73.27 |
100.00 |
73.27 |
100.00 |
99.17 |
100.00 |
|
3 |
Grey Wolf Optimization (GWO) |
98.45 |
75.00 |
100.00 |
75.00 |
100.00 |
99.72 |
100.00 |
|
4 |
Ant Colony Optimization (ACO) |
98.59 |
75.00 |
100.00 |
75.00 |
100.00 |
99.17 |
100.00 |
|
5 |
Firefly Algorithm (FA) |
97.50 |
65.00 |
100.00 |
65.00 |
100.00 |
98.90 |
100.00 |
Table 7. Classification accuracy after applying SSOEL using time-domain images on CD and HYP
|
S.No |
Optimization Technique Used |
Classes |
||||||
|
AFIB |
CD |
Healthy |
HYP |
MI |
SB |
SUP |
||
|
1 |
Particle Swarm Optimization (PSO) |
97.19 |
77.59 |
100.00 |
77.59 |
100.00 |
98.63 |
100.00 |
|
2 |
Whale Optimization Algorithm (WOA) |
97.89 |
83.19 |
100.00 |
83.19 |
100.00 |
99.17 |
100.00 |
|
3 |
Grey Wolf Optimization (GWO) |
98.45 |
87.93 |
100.00 |
87.93 |
100.00 |
99.72 |
100.00 |
|
4 |
Ant Colony Optimization (ACO) |
98.59 |
86.21 |
100.00 |
86.21 |
100.00 |
99.17 |
100.00 |
|
5 |
Firefly Algorithm (FA) |
97.50 |
83.19 |
100.00 |
83.19 |
100.00 |
98.90 |
100.00 |
Table 8. Comparison of arrhythmia detection DL approaches and performance metrics
|
Paper |
Approach |
Models Used |
No. of Datasets Used |
Evaluation Metrics |
Results (in %) |
|
Alquran e t al.[20] |
Various DL techniques |
AlexNet, GoogleNet |
1 |
Accuracy |
Accuracy:97.80 |
|
Murat e t al.[21] |
DL techniques |
CNN-LSTM |
1 |
Accuracy |
Accuracy:99.26 |
|
Ullah e t al.[22] |
DL techniques |
2D CNN |
1 |
Accuracy |
Accuracy:99.11 |
|
Mohonta e t al.[23] |
CWT based DL techniques |
CNN |
1 |
Accuracy, Sensitivity, Specificity |
Accuracy:99.65 Sensitivity:98.87 Specificity:99.85 |
|
Sinha e t al.[24] |
multilevel feature analysis and DL |
SVM, KNN, DNN |
1 |
Accuracy |
SVM:98.82 KNN:98.14 DNN:99.05 |
|
Kumar e t al.[25] |
DL techniques |
Coy-GWO-based Deep CNN |
1 |
Accuracy |
Accuracy:95.00 |
|
Hu e t al.[26] |
DL techniques |
Transformer based DNN |
2 |
Accuracy |
Accuracy:99.12 |
|
Madan e t al.[27] |
Hybrid DL techniques |
2D-CNN-LSTM |
3 |
Accuracy |
Accuracy: 98.70 |
|
Irfan e t al.[28] |
DL techniques |
Combination of various models |
2 |
Accuracy, Sensitivity, Specificity |
Accuracy:99.35 Sensitivity:98.37 Specificity:99.59 |
|
Khanna e t al.[29] |
IoT with DL techniques |
IoTDL-HDD |
1 |
Accuracy |
Accuracy:93.45 |
|
Nurmaini e t al.[30] |
DL techniques |
DNN with PCA |
4 |
Accuracy, Sensitivity, Specificity |
Accuracy:99.76 Sensitivity:91.80 Specificity:99.78 |
|
Jiang e t al.[31] |
Multi-Module Neural Network System with Data Balancing Measures |
DAE, CNN |
1 |
Accuracy |
Accuracy:96.6 |
|
Harrane and Belkhiri[32] |
CNN and LSTM Network |
CNN, LSTM |
1 |
Training and Test Accuracy |
Training Accuracy:99.9 Test Accuracy:98.60 |
|
Mohammed Hammad[33] |
DL techniques |
DNN with Feature Selection(GA Procedure) |
1 |
Accuracy, F1-Score |
Accuracy:94 F1-Score:95.3 |
|
Kumar e t al.[34] |
DL techniques |
Fuzz-ClustNet |
2 |
Accuracy |
Accuracy:95.5 |
|
Bassiouni e t al.[35] |
DL techniques |
Combination of several CNN models |
2 |
Accuracy |
Accuracy:98.60 |
|
Subasi e t al.[36] |
1D DL techniques |
Combination of Many Networks and feature sets |
1 |
Accuracy |
Accuracy:95.70 |
|
Proposed Approach |
Stage-Wise Sieving Through Optimal Ensemble Learning for CNN |
Combination of three CNN models with optimizers. |
3 |
Accuracy |
Accuracy:96.29 |
Final output of the ensemble of models was decided using an optimizer-based fusion strategy. Table 6. illustrates significant improvements, particularly in the accuracy of previously misclassified classes. All the classes exhibited noticeable improvements, especially Healthy, MI, and SUP, which achieved 100% classification accuracy. The overall accuracy in- creased by an average of 19.16%. The classification accuracy of the most misclassified classes, namely CD and HYP, improved the most, with average gains of 32.44% and 25.19%, respectively. Although ResNet-18 individually performed better than the other models, the best results were achieved through the optimized ensemble of ShuffleNet, MobileNet-v2, and ResNet-18. Among the five optimization techniques employed, Grey Wolf Optimization (GWO) yielded the highest accuracy, achieving an overall accuracy of 92.59%.
However, CD and HYP continued to show comparatively lower classification accuracies. To address this, the proposed framework was further refined by applying the GWO optimizer on time-domain images corresponding to the
CD and HYP classes. The findings, presented in Table 7., reveal an additional improvement of approximately 15.56% in the classification accuracy of these two challenging classes. Consequently, even the most difficult-to-classify categories exhibited substantial progress, which is critical in practical diagnostic settings.
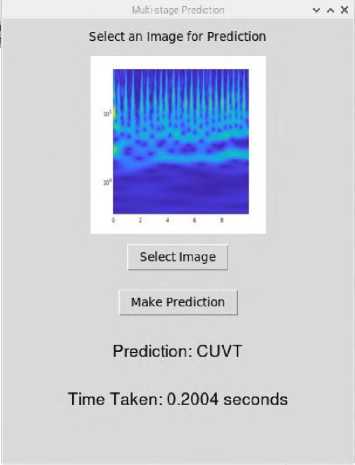
Fig.5. User interface developed on Raspberry Pi 4 for real-time ECG classification.\
To demonstrate the feasibility of the proposed framework for portable healthcare applications, the complete SSOEL model was deployed on a Raspberry Pi 4. Despite involving multiple CNN models and optimization stages, the system maintained a low prediction latency of approximately 0.3 seconds per sample. A user-friendly Graphical User Interface (GUI) was developed to enable users to upload an ECG image, receive the classification output, and view the inference time in real time, as illustrated in Fig.5.
Error analysis revealed that most misclassifications occurred between CD and HYP classes, primarily due to overlapping morphological features such as prolonged QRS complexes and altered voltage patterns. These findings highlight the intrinsic difficulty of distinguishing between certain pathological conditions based on ECG signals alone. Nevertheless, the application of optimization strategies and time-domain fine-tuning substantially reduced these misclassifications compared to baseline CNN performances.
Although promising results have been obtained, further validation on larger and more heterogeneous ECG datasets is envisaged as part of future work to fully establish the scalability and generalization capability of the proposed framework. These findings highlight the effectiveness of the suggested method in improving the accuracy of arrhythmia classification algorithms. They also emphasize its potential contribution toward advancing more reliable and clinically meaningful diagnostic systems. Notably, the proposed SSOEL framework demonstrated an improved ability to accurately classify challenging arrhythmia types, resulting in a substantial reduction in the incidence of false negatives. This is critical because, while false positives may lead to cautionary overdiagnosis, false negatives carry a greater risk by potentially delaying life-saving medical interventions.
Furthermore, in comparison to the techniques summarized in Table 8., the SSOEL framework exhibits competitive performance relative to established benchmarks. While several prior works report exceptionally high overall accuracies exceeding 99%, many of these methods primarily optimize for general classification accuracy, often at the expense of performance in minority or clinically critical classes. In contrast, the proposed approach focuses not only on maintaining a high overall accuracy (96.29%) but also on systematically improving the performance of the most challenging classes, such as CD and HYP, which are frequently misclassified in conventional DL models.
The comparative results in Table 8. affirm that the proposed SSOEL framework achieves a favorable balance between overall diagnostic accuracy and class-specific robustness. By addressing the clinical reality where accurate identification of less frequent but high-risk arrhythmias is as vital as achieving high overall accuracy, the framework aligns better with real-world diagnostic needs.
Sensitivity analysis was also conducted to evaluate the stability of the proposed framework with respect to key hyperparameters such as optimizer population size and sieving thresholds. Moderate variations (±20%) in these parameters did not significantly impact classification accuracy, thereby confirming the robustness of the ensemble fusion process. However, excessively small optimizer populations or highly aggressive sieving thresholds introduced minor reductions in performance, indicating the importance of careful tuning during system deployment.
5. Conclusions
The proposed Stage-Wise Sieving through Optimal Ensemble Learning (SSOEL) approach demonstrated substantial improvement in ECG arrhythmia classification by progressively eliminating correctly classified classes at each stage and retraining models for increasingly difficult distinctions. By optimally fusing predictions from lightweight CNN architectures—ShuffleNet, MobileNet-v2, and ResNet-18—using metaheuristic optimizers such as GWO, the method achieved a high overall accuracy of 92.59%. Particularly notable was the substantial accuracy improvement observed in previously challenging classes such as CD and HYP.
The proposed framework was successfully implemented on a Raspberry Pi 4 platform, achieving real-time inference within a low-power budget (2 W), thus demonstrating its practical suitability for deployment in portable and resource- constrained healthcare environments. Furthermore, comparative analysis indicated superior classification performance over existing DL-based methods, particularly in handling complex inter-class variations.
Although promising results have been obtained, future work will focus on validating the scalability and robustness of the proposed framework across larger, multi-center ECG datasets with more heterogeneous patient populations. Additionally, the impact of noisy and artifact-contaminated ECG signals will be investigated to assess real-world robustness. Further enhancements may involve integrating explainable AI techniques such as SHAP or LIME to improve interpretability, adopting advanced class balancing strategies like SMOTE or focal loss to address residual imbalance issues, and exploring temporal feature extraction via RNNs or Transformer-based architectures. Finally, energyefficient adaptations suitable for smartwatches and wearable health monitoring devices are envisioned to broaden the clinical applicability of the system.
Overall, the SSOEL-based optimized ensemble framework presents a significant advancement toward accurate, lightweight, and deployable ECG arrhythmia detection systems.
All the Declarations and StatementsCode Availability
The MATLAB code and dataset supporting the findings of this study are available at: piyush4249/SSOEL_ECG_Classification
Author Contributions Statement
Piyush Mahajan – Conceptualization, Methodology, Proposed Research Ideas, Framework Design, Data Curation, and Software Implementation. Responsible for data acquisition, dataset preprocessing, and drafting the initial manuscript.
All authors have read and agreed to the published version of the manuscript.
Conflict of Interest Statement
The authors declare no conflicts of interest.
Funding Declaration
The authors received no external funding for this study
Data Availability Statement
This study analyzed publicly available datasets. The datasets can be found here: “”, accessed on “14-10-2024”.
Ethical Declarations
This study did not involve human participants or animal subjects.
Acknowledgments
We sincerely thank the experts for their professional evaluation and valuable recommendations, which have contributed to improving the quality of the experiment and the reliability of its results.
Declaration of Generative AI in Scholarly Writing
Generative AI tools were used solely for grammar and language enhancement.
Abbreviations
The following abbreviations are used in this manuscript:
AI - Artificial Intelligence
ACO - Ant Colony Optimization
AFIB - Atrial Fibrillation
CD - Conduction Disturbance
CNN - Convolutional Neural Network
CVD - Cardiovascular Disease
CWT - Continuous Wavelet Transform
DL - Deep Learning
ECG - Electrocardiogram
FA - Firefly Algorithm
GUI - Graphical User Interface
GWO - Grey Wolf Optimization
HYP - Hypertrophy
LSTM - Long Short-Term Memory
MI - Myocardial Infarction
PSO - Particle Swarm Optimization
ReLU - Rectified Linear Unit
SB - Sinus Bradycardia
SSOEL - Stage-Wise Sieving through Optimal Ensemble Learning
SUP - Supraventricular Arrhythmia
SVM - Support Vector Machine
WHO - World Health Organization
WOA - Whale Optimization Algorithm
