Standardization of the ECG on the basis of cardiac cycle phase analysis

Author: Zernov Vladimir, Voronova Olga, Rudenko Mikhail, Mamberger Konstantine, Makedonsky Dmitry, Rudenko Sergey, Fedosov Yury, Dyuzhikov Aleksandr, Orlov Anatoly, Sobin Sergey
Journal: Cardiometry @cardiometry
Section: Cardiometric aspects of cardiovascular therapy. System and specific approaches to health maintenance
Article in issue: 1, 2012.
Free access
Aims The article aims at describing the basic system criteria of the ECG interpretation on the basis of the cardiac cycle phase processes as well as systematizing these criteria for developing new standards for the ECG classification. Materials and An original ECG lead of the ascending aorta is proposed. It identifies the methods boundaries of the rapid and slow ejection phases. The concepts and description of the ECG waves are introduced. The amplitudes of the ECG waves are used to characterize the contraction of the muscles of the cardiovascular system segments. Results The general principles of the ECG standardization based on the amplitude analysis of the ECG waves are described. Conclusion Development of the standardization system will contribute to quality improvement of the diagnostics performed by practising physicians.
Сardiometry, ecg, ecg standardization, rheogram
Short address: https://sciup.org/148308717
IDR: 148308717
Text of the scientific article Standardization of the ECG on the basis of cardiac cycle phase analysis
Aims The article aims at describing the basic system criteria of the ECG interpretation on the basis of the cardiac cycle phase processes as well as systematizing these criteria for developing new standards for the ECG classification. Materials and methods An original ECG lead of the ascending aorta is proposed. It identifies the boundaries of the rapid and slow ejection phases. The concepts and description of the ECG waves are introduced. The amplitudes of the ECG waves are used to characterize the contraction of the muscles of the cardiovascular system segments. Results The general principles of the ECG standardization based on the amplitude analysis of the ECG waves are described. Conclusion Development of the standardization system will contribute to quality improvement of the diagnostics performed by practising physicians. Keywords Сardiometry ≈ ECG ≈ ECG standardization ≈ RHEOgram Imprint Vladimir A. Zernov, Olga K. Voronova, Mikhail Y. Rudenko, Konstantine K. Mamberger, Dmitry F. Makedonsky, Sergey M. Rudenko, Yury V. Fedosov, Aleksandr A. Dyuzhikov, Anatoly Orlov, Sergey V. Sobin. Standardization of the ECG on the basis of cardiac cycle phase analysis; Cardiometry; No.1; November 2012; p.102-125; doi:10.12710/cardiometry.2012.1.101124 Available from:
The heart cycle phase analysis based on the mathematical equations by G. Poyedinstev and O. Voronova is a foundation for practically obtaining new data on normal performance of the human cardiovascular system, cardiovascular pathology, and therapy control aimed at recovery processes [1]. It provides a way to establish cause-effect relationship between the mechanism and the behavior of pathological processes.
Considering the fact that the application of this method in clinical practice has been producing further novel data and ideas, it is obvious that even the results already achieved can radically change the conventional approaches in electrophysiology. This gives us an opportunity to utilize electrocardiography in a more efficient way in solving practical problems.
This implies the following:
-
1. Screening to reveal risk groups;
-
2. Establishing diagnosis and deciding on treatment strategy;
-
3. On-line monitoring of therapy efficiency;
-
4. On-line acute and surgical monitoring;
-
5. Monitoring of age-related changes;
-
6. Evaluation of efficiency of training procedures for conditioning in sports.
For these purposes, an electrocardiogram (ECG) is recorded according to an innovative technology developed by the authors hereof in order to identify the phase pattern of a heart cycle. This technology is easier in use than the existing one and can deliver data of higher informative value.
There are certain difficulties which exist in early diagnosis of the cardiovascular diseases since it is very often the case when variations of hemodynamic parameters of a person, who is absolutely healthy but who stands under exercise load, may be even far beyond the scope of pathology changes.
Many questions might come to mind of how age-related changes affect the performance of the cardiovascular system. Of great importance is an evaluation of the coronary flow.
Another subject treated by the authors in their researches is the problem of sudden cardiac death. The authors succeeded in establishing criteria for early diagnosis for the said death cases that makes possible now to forecast and avoid such potential risks by taking adequate preventive measures.
All results of the researches described herein have been clinically verified and validated. Contrary to many conventional well-known methods of diagnosis, the informative potentialities of which have been already exhausted, the method of the heart cycle phase analysis is well under way.
Materials and methods
Development of innovative ECG recording technology
That has become a driving force for an increase in ECG channels, the number of which reaches one hundred. Then, computer-assisted equipment offered new opportunities in an advanced mathematical modeling. In particular, as a consequence, that gave rise to a radically new method of ECG recording. Next step in the history of electrocardiography was the EASI method [1] (Fig.1). Thereupon, a new trend made its appearance: to reduce the number of the recording electrodes and provide at the same time a greater volume of information.
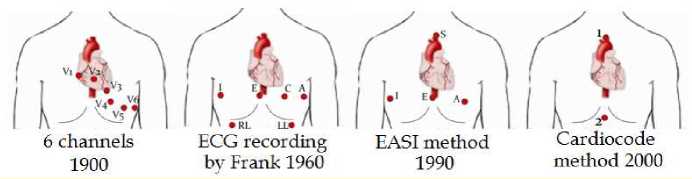
Figure 1 . Development of ECG recording methods.
But all that has not assisted in the development of the heart cycle phase analysis. In the 1980s, the mode of elevated fluidity of liquid was discovered by G. Poyedintsev and O. Voronova (the so called ”third” mode of flow), an innovative mathematical model of the blood flow through blood vessels and new methods how to calculate hemodynamic parameters, based on durations of the respective phases of every heart cycle were offered by the above scientists [2]. By this means the theoretical foundation was created in order to develop the phase analysis at a new level. But the only way to implement the above mathematics was an elaboration of a new reliable method of recording of the phase pattern of the heart cycle.
At that time there was no unambiguous interpretation available how to identify the heart cycle phase boundaries on an ECG curve. Different research schools gave their different descriptions of criteria of how to properly record the phases. First of all, it was applicable to key wave point S on an ECG curve. For instance, each channel in 6-lead ECG recording delivers different values of the same R-S interval.
The EASI method at its core delivers additional sources of errors in ECG processing. In order to properly record all phases, it was required to minimize the number of the channels for error reduction. At the beginning of the 2000s, medical scientists succeeded in identifying those areas on the human body where ECG recording electrodes are to be placed to obtain all fine points of electric activity of the heart [1]. It has been detected that the area delivering the most informative signals is located within the zone of the ascending aorta (Fig.1). It should be mentioned, that it is important that the second electrode is not neutral but an active one, contrary to other known methods. This electrode should be located within the area of the heart apex. As a result, using one ECG channel only, we obtain full information about electric activity within the area located between the aorta and the apex of the heart. Principally, it is essential that we deal with a signal that is not integrated because of parallel influence of conductivity of the closely-located tissues, as it may be the case with other conventional methods where the second electrode is used as the neutral zone (Fig.2). In particular, it is critical for recording of interval S – T, which includes 4 periods of the phase pattern of the heart cycle.
HDA
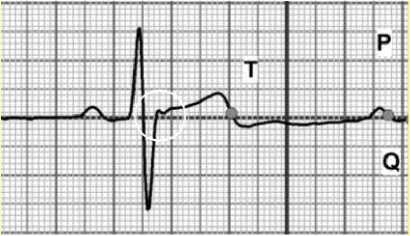
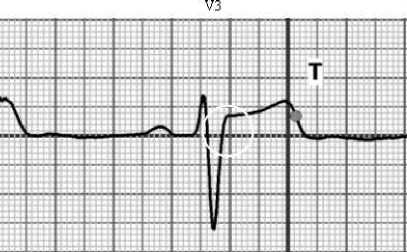
Figure 2 . A clear ECG signal according to Cardiocode single-channel method versus standard V3 lead ECG signal modified due to integration.
A difference between the durations of the same R – S interval is about 25%
Searching for criteria of how to record point S was successfully completed by the authors on the basis of the equаtions by G.Poyedintsev – O.Voronova. It follows from the equations that the sum of diastolic phase volumes PV1 and PV2, should be equal and the systolic phase volumes PV3 and PV4 as well as stroke volume SV can be expressed as follows [1]:
PV1+PV2 = PV3 + PV4 = SV (1)
Taking into account the fact that the above equations include several phases of the heart cycle, to make this exactly equal is possible only when all phases are recorded in the absolutely proper way. By experiment, the required criteria for the appropriate recording of every phase have been found by local extrema on the first order derivative of an ECG. It is of importance that first time a universal criterion has been established to record any phase at all.
In the course of the investigations, another thing has been revealed: the widely used conventional electronic filters are not substantiated from the scientific point of view, when selecting the proper pass bands, so that they produce signal distortions. Of special note is in this case the lower cut-off frequency of the filters. It is just the frequency that is favorably used in Cardiocode technology based on the many years’ experience.
Finally, according to equation (1), only the Cardiocode technology is capable of recording an ECG from the aorta with identification of every phase at local extrema of the first derivative. Any other methods or procedures are not acceptable for making heart cycle phase analysis.
But it was found that recording of an ECG curve alone is not sufficient for analysis of the performance of the cardiovascular system. Therefore, it was required to develop the so called pin-point rheography, when a rheogram is recorded from the ECG electrodes simultaneously with the ECG. Two signals of different nature that are recorded at the same time give a comprehensive idea of how the cardiovascular system performs.
Single-channel recording of the ECG from ascending aorta, supplemented by simultaneous recording of aortic pin-point RHEOgram (Cardiocode technology). A synchronous recording of a RHEOgram from the ECG electrodes is possible when an additional external sinusoidal high-frequency signal, supplied by a generator, passes the electrode area. This frequency is amplitude-modulated by blood circulation. The modulation shape is equivalent to changes in blood filling within the given area. By detecting a signal, we obtain a RHEO signal, the shape of which is equivalent to changes in arterial pressure. According to the Cardiocode technology, the RHEO signal is picked off the ECG electrodes, therefore the generating electrodes for RHEO recording should be placed adjacent to the ECG electrodes. A scheme of electrode arrangement is shown in Figure 3 below.
Figure 3 . Scheme of electrode arrangement for synchronous recording of ECG and RHEO from ascending aorta.
An ECG and a RHEO produced in such a way contain full information of hemodynamics and the performance of the cardiovascular system. Figure 4 displays ECG and RHEO signals recorded synchronously.
The said figure consists of two parts. “A” exhibits actual ECG and RHEO curves demonstrated on the instrument display after recording. The first derivative of the ECG curve is located in between them. Local extremes on the derivative which are used for identification of the heart cycle phases are clearly marked. For instance, phase S – L is identified in such a manner. There is no other way available to detect this phase with a high accuracy. For convenience, in order to properly analyze the relations between the phases on the ECG and RHEO curves, their ideal models are presented in figure “B”.
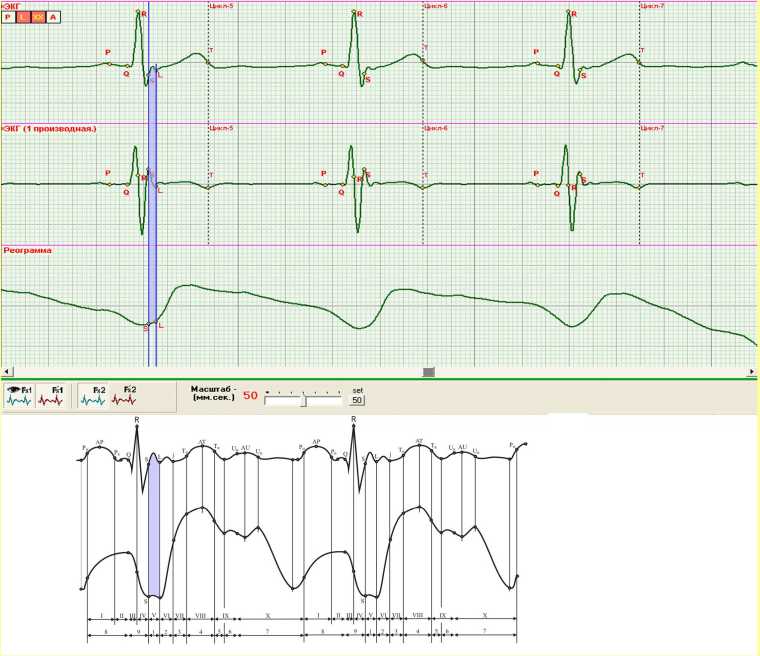
Figure 4 . Real ECG and RHEO curves recorded from ascending aorta; Ideal ECG and RHEO curves theoretically constructed.
Specific criteria established for identification of the phase boundaries make it easy to identify wave point j. Little is known about this wave from the literature: it is called M. Osborn wave. Phase L – j refers to the phase of rapid ejection, and it is characterized by hemodynamic parameter PV3. The systolic pressure can be evaluated by a slope ratio of the RHEO curve in this phase.
Of particular interest is segment j – T (initiation of wave Т), that is an integral part of slow ejection phase. This interval has never been identified or described in the electrophysiology literature. This period of time is required to distribute stroke volume SV throughout the space within the aorta, expanding the latter. The duration of this segment depends on elastic properties of the aorta, so that it increases with loss of its elasticity. Following this way, we can produce a criterion for evaluation of the aorta elasticity status.
The distinctive feature of our innovative technology and methodology is that it is now possible to evaluate the coronary flow qualitatively. For this purpose, wave U is analyzed. The said wave appears in premature diastole phase Т (wave decay) – P (wave initiation). The authors think that the appearance of this wave is associated with the coronary flow features. But many other questions remain to be answered in this connection. At present, some preliminary conclusions can be made only. We are carrying out our further investigations in this area, and there are good grounds to believe that they will be successful.
In order to analyze an ECG in combination with a RHEO, both curves should be synchronized. This step is of great importance. To do this, provided should be that the RHEO curve meets the isoelectric line at the point corresponding to point S on the respective ECG. In this case, it becomes possible to analyze arterial pressure development in the aorta both before and after opening of the aortic valve as shown in Figure 5 below.
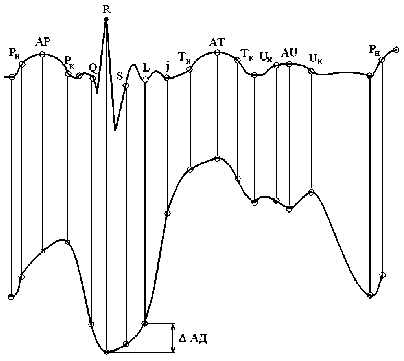
Figure 5 . Ideal ECG and RHEO curves. An interval is marked where a diastolic AP buildup can be evaluated.
The RHEO isoelectric line meets point S on the ECG curve. It makes possible to evaluate an AP increase both before and after opening of aortic valve. Normally, the RHEO curve in phase S – L should be horizontal, and the AP buildup should be started at point L.
Classification of ECG curve shapes by reference criteria
The long-time researches of the performance of the cardiovascular system by the Cardiocode technology result in identification of such ECG and RHEO curve shapes that can be considered to be the reference curves. Figure 6 displays some recorded curves which are accepted by us as the references. Considering the fact that “a reference” is a matter of convention, such axiomatic approach, as it is often the case in practice, can solve a lot of problems in introducing the phase analysis theory.
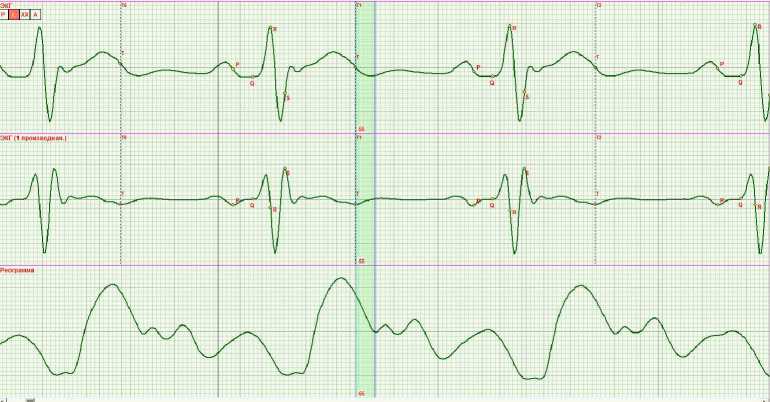
Figure 6 . ECG and RHEO reference curves applied in practice for phase analysis.
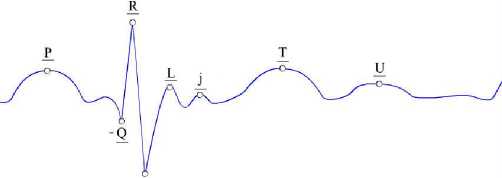
The recorded curves should be classified by changes in the contraction function of the respective heart muscle area in each phase. On an ECG curve we can find the contraction function being expressed as phase amplitudes. Let us denote the respective maxima and minima on an ECG by conventional letters P; - Q; R; - S; L; j; T and U (Fig.7). It should be noted that it is our own legend since the same lettering is typically used for the conventional ECG waves but in our case the same letters carry other information, and, in order to avoid any confusion, they are underlined herein.
s
Figure 7 . Maxima and minima on ECG, which correspond to the respective heart cycle phases and characterize the contraction function of the muscle groups in the given phase.
An indication is amplitude displacement of maxima or minima.
Let us denote the amplitudes of waves on the reference ECG curve as follows:
P1; - Q1; R1; - S1; L1; j1; T1; U1
If amplitudes of the waves on a real ECG differ from their reference, numerical coefficients should be other, too. For instance, if amplitude R is greater, we obtain R1,5 or R2 . With a decrease in the amplitude, we have R0,5 or R0 (for the Brugada syndrome).
Information about the performance of the cardiovascular system presented in such a way is suitable to be processed automatically. The only thing for a doctor is in this case to analyze the obtained data in the context of the actual cause-effect relations and establish the primary cause of the changes in the performance. To make it easier, the changed amplitudes may be marked only. As an example, a recorded curve indicating an increased pumping function of the aorta and a diminished function of the myocardium contraction should be presented as follows:
Т2 ; - S 0,1
The investigations carried out by us create a basis for classification of 19 most significant cases of functional changes that may occur in a staged manner and lead to some cardiovascular pathology cases. These cases are as given below:
-
1. Increased function of contraction of interventricular septum (IVS);
-
2. Diminished function of contraction of IVS;
-
3. Diminished function of contraction of IVS and myocardium;
-
4. Diminished function of contraction of myocardium;
-
5. Reduced level of relaxation of heart in premature diastole (appearance of multiple Р waves);
-
6. Condition of coronary flow;
-
7. Condition of function of regulation of diastolic AP;
-
8. Condition of function of regulation of systolic AP;
-
9. Effect of reverse contraction of IVS (at 100% passivity of myocardium);
-
10. Q wave dip;
-
11. No-S-wave and P-variation effect;
-
12. No-premature-diastole effect;
-
13. Regurgitation of aortic and mitral valves;
-
14. R-wave-bifurcation effect;
-
15. T-wave inversion effect;
-
16. No-P-wave effect;
-
17. P – Q phase changes;
-
18. Respiratory arrhythmia (QRS after Т wave);
-
19. Т and Р wave bifurcation.
It is impossible to present here all possible variations of the functional changes. Maybe, it should be treated separately in another book. Therefore, it is reasonable to outline general approaches to the proposed classification only and give some exemplary cases herein.
In practice, we always deal with a great variety of ECGs and RHEO curves so that no two curves are alike. It depends on individual features of the performance of the cardiovascular system of everybody. Therefore, it is expedient to consider a certain scope of functional changes and their peculiarities which may be typical for any pathology case.
The significance of the above classification is based on its practical effect. It allows for evaluating a deviation of a function from its conventional norm and detecting primary cause of the changes. Moreover, this approach makes possible early diagnostics in case of a pathology developing process well in advance so that the most favorable conditions are met to apply the most efficient ways to improve the functions.
Increased function of contraction of interventricular septum (IVS)
Table 1 illustrates one of 19 cases of the functional changes. It is a staged increase of the function of the contraction of the IVS up to its limiting critical level.
Table 1 . Increased function of contraction of IVS up to its limiting critical level.
|
Temporal development (stage) |
R |
- S |
L |
Associated features Increased Q –S width |
Symptom |
Clinical aspect |
|
1 |
R1,5 |
- S0,5 |
- |
- |
- |
|
|
2 |
R2 |
- S2 |
-L2 |
Increased |
- |
- |
|
3 |
R3 |
- S2 |
-L3 |
Increased |
Periodical short-time vertigo |
Manifestation not in every heart cycle |
|
4 |
R4 |
- S4 |
-L4 |
High probability of IVS “attenuation” in contraction |
Periodical loss of consciousness |
|
|
5 |
- |
- |
Sudden cardiac death |
Figures 8, 9 and 10 display the recorded curves to be classified.
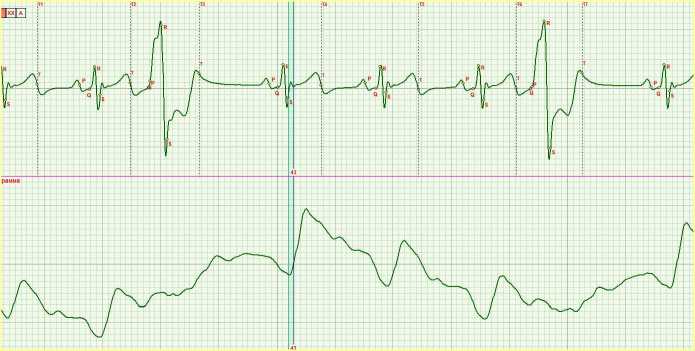
Figure 8 . Stage 2: R2; – S2; –L2
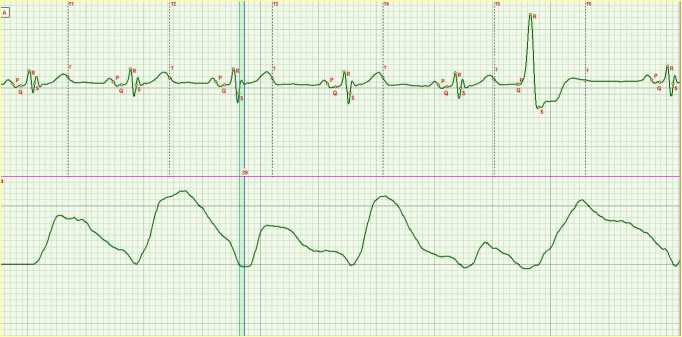
Figure 9 . Stage 3: R3; – S3; –L3
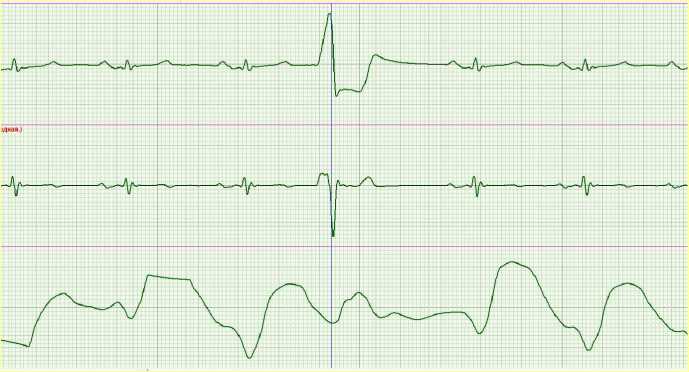
Figure 10 . Stage 4: R4; – S4; –L4
Diminished function of contraction of interventricular septum (IVS)
Item number two in the list of the significant functional changes is diminished function of contraction of the IVS (Table 2 below).
Table 2 . Diminished function of contraction of IVS.
|
Temporal development (stage) |
R |
- S |
L |
T |
Associated features Increased R – S width |
Symptom |
Clinical aspect |
|
1 |
R0,75 |
L1,5 |
T1,5 |
Increased diastolic AP |
Manifestation in every heart cycle |
||
|
2 |
R0,5 |
L2 |
T1,75 |
Increased |
Manifestation of periodical extrasystoles. Increased systolic AP at increased diastolic AP |
||
|
3 |
R0,25 |
- S1,25 |
L2 |
T1,75 |
Wide |
Increased systolic AP at increased diastolic AP |
|
|
4 |
R0,25 |
- S1,25 |
L2 |
T2 |
Wide |
S-wave double contraction at normalization of its width. Instability of this process is recorded |
|
|
5 |
R0,25 |
- S1,5 |
L2 |
T2 |
Wide |
Increased systolic AP at increased diastolic AP |
|
|
6 |
R0,1 |
- S1,5 |
L2,5 |
T2,5 |
High systolic AP at high diastolic AP |
||
|
7 |
R-wave dip |
Energetical processes which occur in the muscle cells of the septum, the myocardium and the atria play a decisive role in the performance of the heart. The energetics depends on biochemical processes that maintain the functioning of mitochondria in tissue cells. The cell membranes and the transport elements are key factors in the said processes. Changes in mitochondria energetics are directly proportional to the function of the muscle contraction. The authors have recorded in practice a complete range of ECG changes of one patient from the extremely pathological Brugada syndrome before therapy up to the normal condition after the required treatment received. The recovery of the functions of the cardiovascular system was provided by re-establishing of functioning of mitochondria and restoring the carbon dioxide – oxygen balance in blood. Figures 11 - 16 show the ECG and RHEO curves recorded in orthostatic testing within the period of time from the beginning of the therapy up to achieving the acceptable treatment results. The said figures in the above case illustrate the curves arranged in the reverse order in order to provide insight into the development of the ECG characteristics, beginning with the achieved normal status and ending with the initial extreme pathology, i.e., the Brugada syndrome.
The represented history can be described on the basis of the classification as mentioned above. The exemplary curves illustrate how the compensation mechanisms start their operation. It should be noted that the compensation mechanism takes effect at MV > 4,5 l/min.
Next to last stage 6 offers ECG curves where R wave is not available at all and where we observe a considerable widening of the S-wave and a significant increase in amplitude of wave S – L. This ECG curve shape is typical for the Brugada syndrome.
The suggested classification can be very effectively used in practice. Table 2 given above shows that every stage has its own risk level, considering changes in the function of contraction of the IVS. It enables to identify in the very efficient way certain risk groups among patients to be examined during either their routine periodic health examination or under emergency conditions.
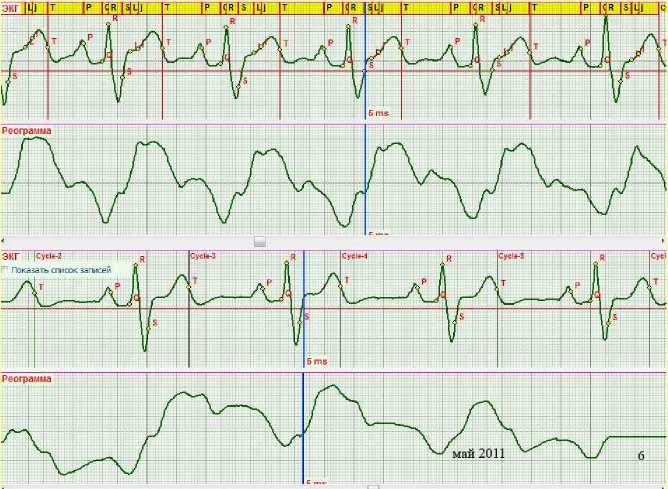
Figure 11 . Stage 1: R0,75; L1,5; T1,5
It should be mentioned that the Cardiocode technology requires an orthostatic testing. That means that cardiac signals should be recorded both in lying and sitting positions. Recording in lying position lasts over 20 seconds, then the patient should change his/her position to sitting, and another 20 second-recording should be carried out within next 1 minute thereupon. It is also advisable to offer to the patient to squat 10 – 15 times, and thereupon to record the curves the third time in a session with the same patient in standing position.
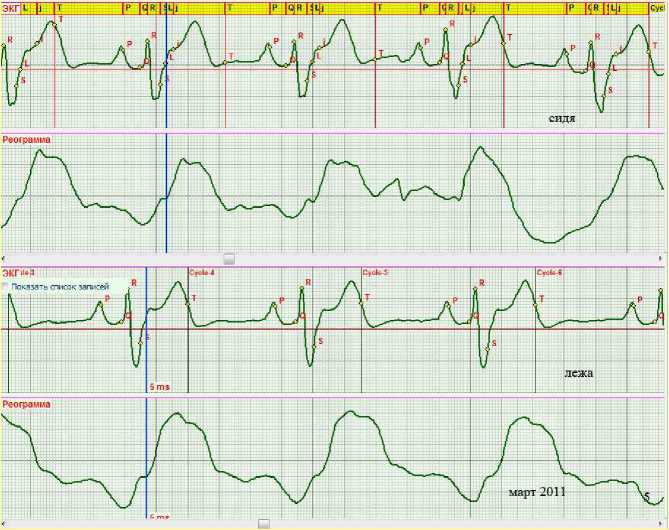
Figure 12 (а) . Stage 2: R0,5; L2; T1,75
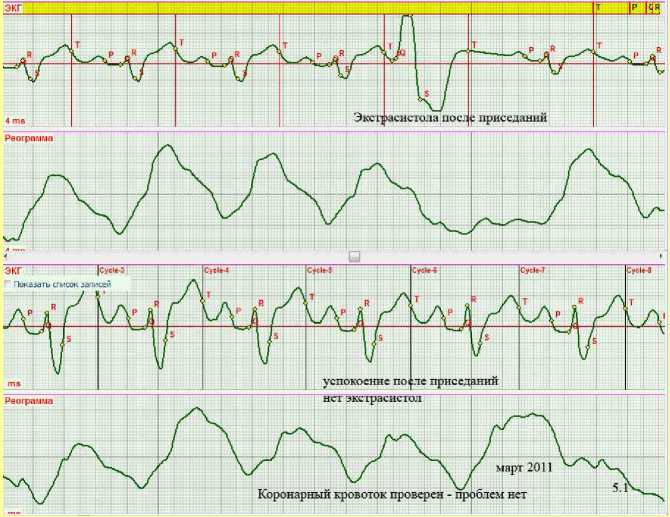
Figure 12 (b) . Stage 2: Appearance of extrasystoles after exercise stress or poor sleep.
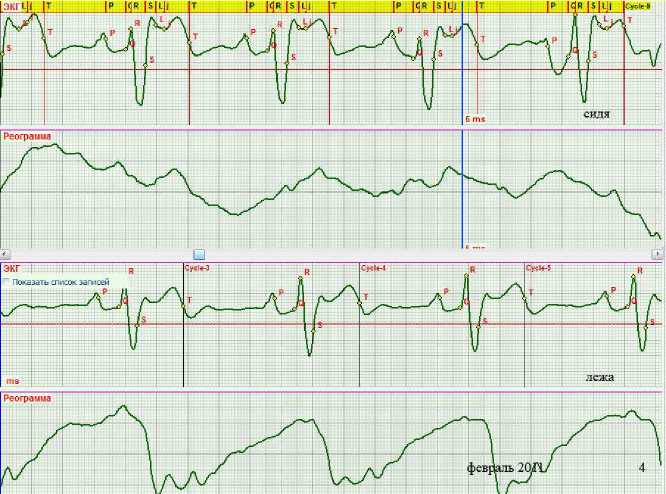
Figure 13 . Stage 3: R0,25; - S1,25; L2; T1,75
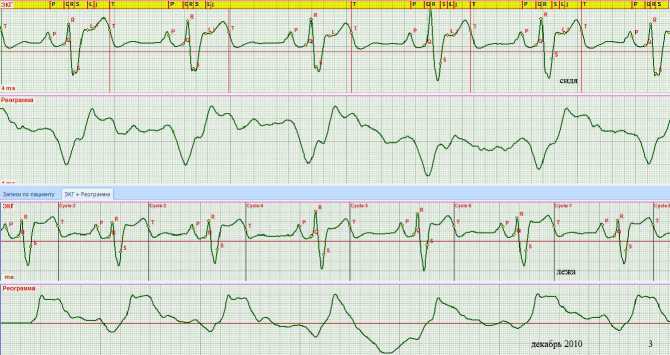
Figure 14 . Stage 4: R0,25; - S1,25; L 2; T2
The S wave recovering after double contraction is observable.
The record was produced in orthostatic testing.
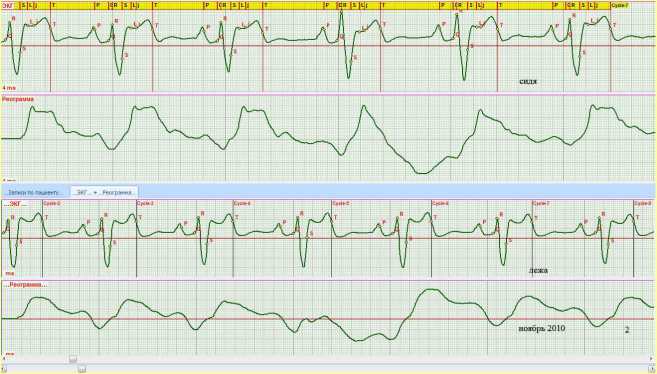
Figure 15 . Stage 5: R0,25; - S1,25; L2; T2
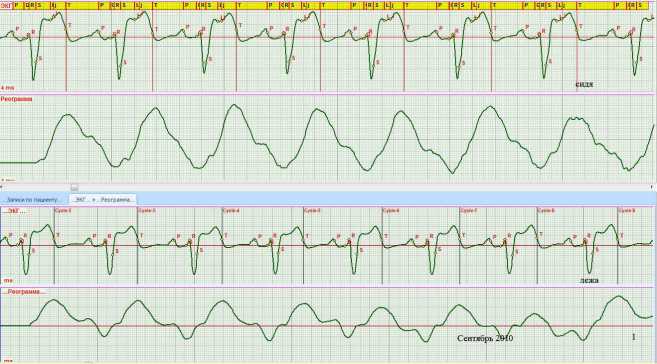
Figure 16 . Stage 6: R0,1; - S1,5; L1,25; T2,5 .
Brugada syndrome manifestation.
Diminished function of interventricular septum and myocardium
Cases of diminished contraction function of the interventricular septum and the myocardium are observed in clinical practice (Fig. 17). In these cases, the QRS complex shows very small amplitudes. It indicates that the contraction function of the IVS and the myocardium is diminished. The relaxation of the heart in the premature diastole phase is weakened. In order to provide the proper blood filling of the heart, the contraction function of the atria increases, as evidenced by the high amplitude of the Р wave. In the given case, the pressure, actually built up by the heart, is not high enough due to the diminished function of the myocardium. As a consequence, in order to reduce the resistance to the blood flow, the aorta is expanded and exceeds its normal volume that is reflected on the ECG curve in an increasing of amplitude of wave Т.
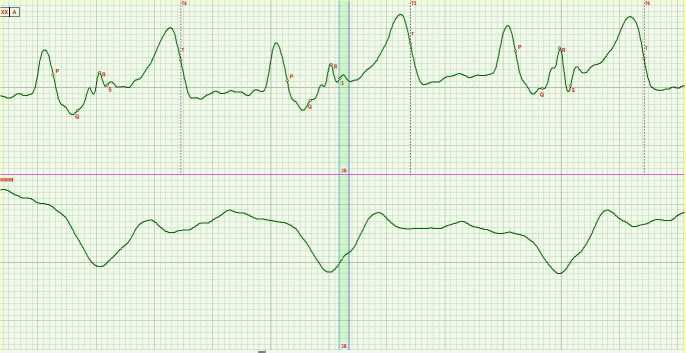
Figure 17 . Diminished contraction function of IVS and myocardium.
According to the lettering used for the suggested classification, the ECG can be described as follows:
R0,25; - S0,25; Р3; T3
Considering the fact that the reference ECG curves, as shown in Fig.6, are taken as the basis, we can obtain more precisely coefficients in automatic measuring of the actual ECG version given in Figure 17. These coefficients assist in understanding of what group is applicable to the given record. In order to qualify the primary cause of any cardiovascular pathology, it is also required to involve the respective RHEO into the phase analysis. It should be mentioned that it is not our intention to treat this issue in this paper.
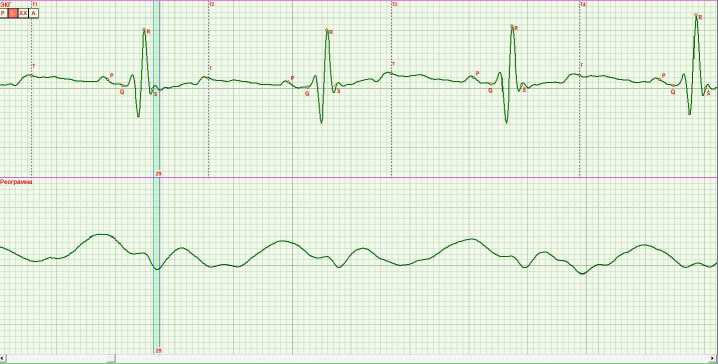
Condition of functioning of regulation of diastolic AP (R-wave bifurcation effect) The process of regulation of diastolic pressure, as described in the paper above, in case of pathology, is provided by different compensation mechanisms. In the instance illustrated in Figure 18, the problem with the myocardium contraction is connected with the coronary flow. The compensation mechanism manifested as R-wave bifurcation makes possible to maintain the blood flow unhindered in the ventricles and provide the blood flow with the valves closed due to additional vibration of the IVS.
The classification can be expressed as follows:
( R1,5; R1,5); - S0,25.
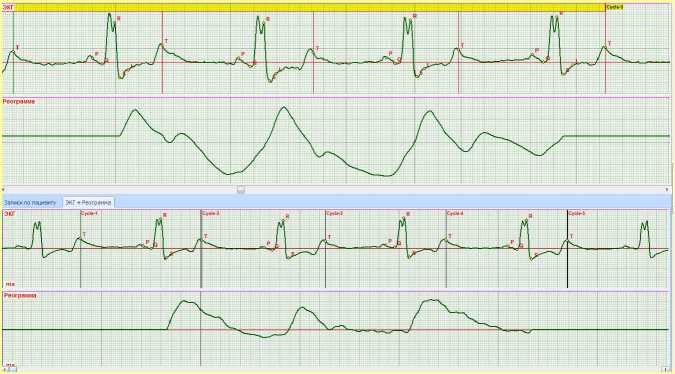
Figure 18 . Condition of function of regulation of diastolic AP (R-wave bifurcation effect).
Condition of function of regulation of diastolic AP. IVS reverse contraction effect at 100% passivity of myocardium
Another case of the operation of the compensation mechanism, when the myocardium is passive, is an IVS reverse contraction effect (Fig. 19). It can be treated as an extreme case of R-wave bifurcation. But it is caused by a pathology problem other than the coronary flow. As a rule, the case history of such patients contains records of close-spaced respiratory diseases in infancy.
This curve version can be classified as given below:
( -R1,5; R1,5); S0,25.
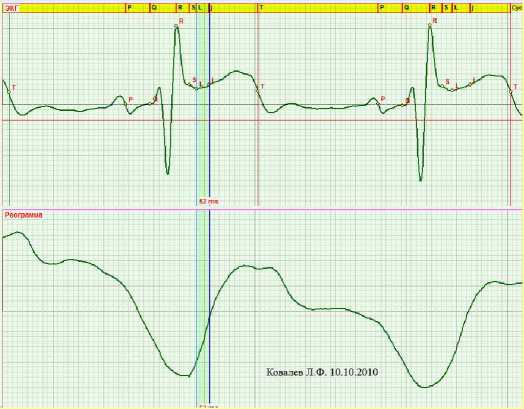
Figure 19 . IVS reverse contraction effect at 100% passivity of myocardium. It appears at all times irrespective of the patient’s position in orthostatic testing.
One more case of the manifestation of the IVS reverse effect was recorded during the orthostatic testing of one of the patients. Figure 20а demonstrates the R wave bifurcation for horizontal position of the patient. When changing to the vertical position, appeared is permanently the said IVS reverse effect (Fig. 20 b). By analyzing the respective RHEO curve shape we can detect an aortic dilatation since there is no increase in the AP in the slow ejection phase for the patient’s vertical position available.
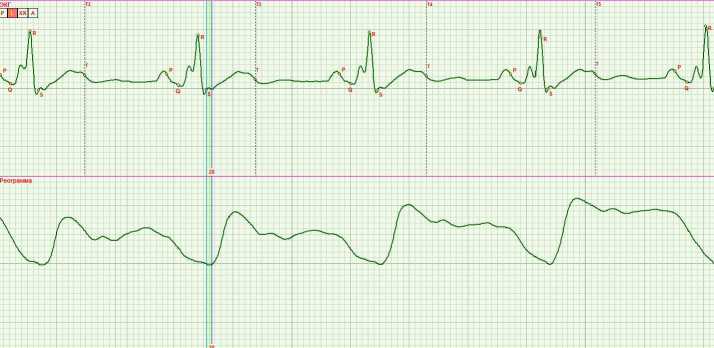
Figure 20 (а) . The classified curve can be presented as follows: ( R1,25; R1,5); -S0,25
( -R0,5; R1,5); -S0,25
Figure 20 (b) . The curve can be classified as follows:
The record of this type can be classified as given below:
( R3); -S0,25.
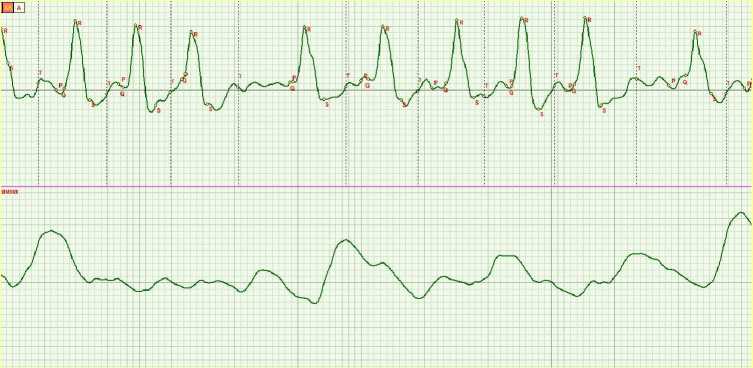
Figure 21 . No-S-wave & P-variation effect.
Results
General principles of the ECG standardization based on the amplitude analysis of the ECG waves are described. Some of the specific ECG curves are considered. The reference ECG curve is represented and its waves are described. The coefficients of these waves are accepted as basic for further comparison with the different ones. The ECG shapes characteristic for the occurrence of sudden cardiac death are classified. The authors succeeded in investigating and classifying the range of the changes of the ECG shapes from normal to extremely abnormal as in case of the Brugada syndrome.
Cardiac cycle phase analysis allowed discovering the compensation mechanism of the interventricular septum reverse contraction which appears in case of absense of myocardial muscle contraction function.
Discussion and conclusions
The materials presented herein create primarily a bridge for applying theory to practice. Basing on the concept of the heart cycle phase analysis, the authors have developed their own innovative diagnostics equipment Cardiocode that is now in production. All cardiac signal records contained herein were produced with this equipment. We expect that its merits like easy-in use and high informative value will be recognized by practicing physicians. But to justify the expectations is always not easy. New knowledge is finding the proper way accompanied with great difficulties. To overcome every difficulty, our team carried out a large body of research work the results of which are reflected herein.
We have focused on the basic definitions. Well-defined is also the range of problems solved by the heart cycle phase analysis theory. The way offered by the authors which is the way of systematization, unification and associated perception of new knowledge should support the medical experts in phase analysis application. It is commonly supposed that every innovation goes through three stages in order to be generally recognized which are as follows: it is stage one when everybody says that it is in principle impossible; then stage two comes when people say that there is something in it, and last stage three appears, when it is believed that it seems to be very simple! The authors adhere to an opinion that the heart cycle phase analysis theory is now between stage two and three from the point of view of its recognition procedure.
Statement on ethical issues
Research involving people and/or animals is in full compliance with current national and international ethical standards.
Conflict of interest
None declared.
Acknowledgements
We would like to express our gratitude to the participants of the clinical testing of our methodology. All opinions, comments and recommendations submitted to us by our colleagues during our research have been properly considered and included in this paper.
Author contributions
V.A.Z. , O.K.V. and M.Y.R. collected and analyzed data. K.K.M., D.F.M. and S.M.R coordinated and drafted the manuscript. Y.V.F., A.A.D., A.O. and S.V.S. supervised analysis and edited the manuscript. V.A.Z. read and met the ICMJE criteria for authorship. All authors read and approved the final manuscript.
References Standardization of the ECG on the basis of cardiac cycle phase analysis
- Rudenko M., Voronova O. & Zernov V. Theoretical Principles of Heart Cycle Phase Analysis. Fouqué Literaturverlag. ISBN 978-3-937909-57-8, Frankfurt a/M. München -London -New York; 2009.
- Voronova O. Development of Models & Algorithms of Automated Transport Function of the Cardiovascular System. [Doctorate Thesis] Prepared by Mrs O. K. Voronova, PhD, VGTU, Voronezh, 1995.
