Statistical analysis and evaluation of kombucha beverage production

Author: Prokopov M.A.
Journal: Научный журнал молодых ученых @young-scientists-journal
Section: Экономические науки
Article in issue: 3 (38), 2024.
Free access
The article discusses the results of statistical analysis of accuracy and stability of the technological production process of the kombucha beverage with the use of a set of methods and procedures. The research purpose is to determine the regularities of changes in its indicators in time, as well as their regulation and improvement.
Quality, quality instruments, statistical analysis, control charts, beverages, kombucha
Short address: https://sciup.org/147244379
IDR: 147244379 | UDC: 658.562.012.7
Статистический анализ и оценка производства напитка комбуча
В статье представлен ход выполнения статистического анализа точности и стабильности технологического процесса производства напитка комбуча с применением набора методов и действий для целей определения закономерностей изменения его показателей во времени, а также их регулирования и улучшения.
Text of the scientific article Statistical analysis and evaluation of kombucha beverage production
The purpose of statistical analyses of process accuracy and stability is to obtain and systematically process information about the quality of products in order to improve the technological process and determine the most optimal parameters of its statistical regulation [2]. Statistical analysis of accuracy and stability of technological processes is a set of methods and actions aimed at determining statistical indicators and patterns of changes in these indicators over time [2].
To identify the quality indicators that have the greatest effect on the total quality of finished kombucha beverages [7], the Pareto diagram quality tool was used. The statistical data of the output control were used to construct the diagram, presented in the control sheet, formed at the enterprise HQ KOMBUCHA LLC.
For the purpose of integer data collection, a five-day working week was adopted for the checklist. Selection of batches was carried out in accordance with according to GOST 6887.0-86 «Products of the non-alcoholic industry. Rules of acceptance and sampling». A total of 10,000 liters of products were produced. One batch contains 1,175 bottles of 0.33 liter volume. The number of batches produced in 0.33 liter containers was 26 units [7]. To determine the resistance, the sampling of units was carried out at the manufacturing plant on the day of production.
Figure 1 shows a checklist of integer data compiled in the finished goods department for o ne working week. _____________________________________________________________
|
Integer data checklist No 1/003-23 |
||||||||||||||||||||
|
Purpose of this checklist: recording of quantitative and qualitative characteristics ofproducts Оbj ect: soft drink kombucha “Classic " Contro 1 p I ace: finished product workshop Data collection period: business week, second quarter 2023 |
||||||||||||||||||||
|
Type of discrepancy |
Monday |
Tuesday |
Wednesday |
Thursday |
Friday |
|||||||||||||||
|
Test |
i |
IT |
TIT |
TV |
i |
и |
in |
IV |
i |
IT |
TIT |
TV |
i |
n |
in |
IV |
i |
и |
HI |
IV |
|
Sour flavor |
1 |
II |
1 |
II |
1 |
1 |
II |
1 |
1 |
II |
II |
Г1 |
||||||||
|
Turbidity |
1 |
II |
1 |
II |
III |
II |
II |
III |
III |
II |
1 |
II |
11 |
|||||||
|
Sour odor |
1 |
II |
1 |
II |
1 |
II |
1 |
11 |
II |
1 |
||||||||||
|
Presence of coarse suspended solids |
II |
1 |
1 |
1 |
II |
1 |
II |
III |
1 |
II |
II |
Illi |
1 |
II |
II |
III |
1 |
III |
1 |
|
|
Unsaturated colour of the drink |
1 |
II |
II |
1 |
II |
1 |
||||||||||||||
|
Batches sent for dilution |
0 |
1 |
0 |
1 |
2 |
1 |
0 |
2 |
0 |
0 |
1 |
0 |
3 |
1 |
0 |
1 |
2 |
1 |
1 |
0 |
|
Total: |
17 |
|||||||||||||||||||
Figure 1 - Integer data checklist
Based on the data presented in the checklist, the stability of the control process was analyzed using the control chart of the number of nonconforming units in the batch (np-chart), as this indicator is an alternative one.
Then, using the data the average line (average number of samples recognized as non-compliant) was calculated using the formula:
np = ^Zi=inp, (1)
T - the number of cycles (T=20);
rip - the number of samples recognized as nonconforming based on the results of the i-th control cycle.
Also, the control limits of the map are calculated using formulas (2) and (3): _____________
UCLnp = np + 3- ^ ’ (1 - v) - (2)
N - the number of samples (N=17).
LCLnp = np-3- Jnp ■ (1 - (3)
In this case, we obtain the following values:
rip = 0.85 pcs;
UCLnp = 3.57 pcs;
LCLnp = -1.85 pcs.
Based on the checklist data, a map of the number of nonconforming units in the batch is plotted in Figure 2 below.
np-chart
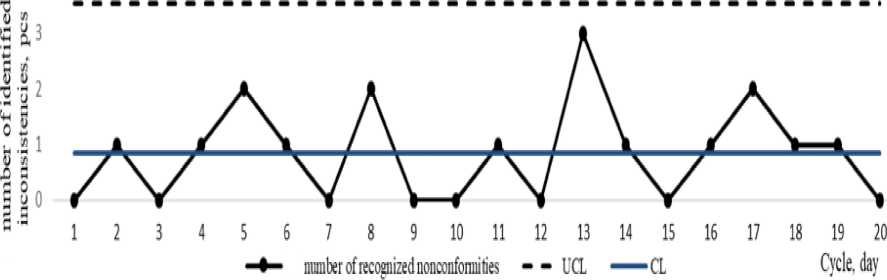
Figure 2 - Control chart of the number of nonconforming units in a batch of finished kombucha (np-chart)
The control chart shows that there are no drop-out points and no trend lines. The process is in a statistically controllable state and can be considered stable.
At the same time, based on the checklist data (Table 1), a Pareto diagram (Fig. 3) was constructed to determine the most weighted parameters from the list of presented parameters. АВС-analysis was used to construct the diagram, in which, according to the rule «20-80%», the working zone of the axis is divided into three equal parts: the zone of greatest influence (A), which is 20% of the total number of parameters, the intermediate zone (B), and the zone of least influence (C).
Table 1 - Input data for Pareto chart construction
|
Type of discrepancies |
Number of nonconforming, pcs. |
Total number of discrepancies, units. |
Percentage of nonconformin g, % |
Cumulative percentage of nonconforming, % |
|
Presence of coarse suspended solids |
35 |
35 |
31.3 |
31.3 |
|
Haziness |
30 |
65 |
26.8 |
58 |
|
Sour odor |
19 |
84 |
17 |
75 |
|
Sour flavor |
19 |
93 |
17 |
92 |
|
Unsaturated colour of the beverage |
9 |
112 |
8,0 |
100 |
|
TOTAL: |
112 |
100 |
100 |
|
Pareto chart
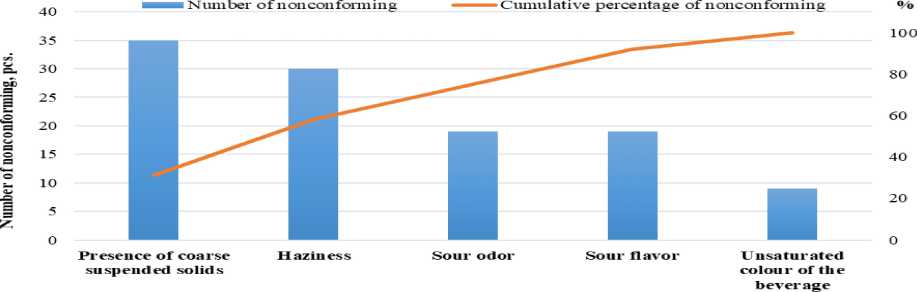
Figure 3 - Pareto chart for determining the degree of importance of kombucha quality indicators
Based on the analysis results, we can determine the influence of the causes of nonconforming of zones A, В and C presented on the diagram on the full quality of finished products. As a consequence, the possibility of achieving a greater effect by detecting the parameters that cause the obtained discrepancies, spending a minimum of time, labour and financial resources on minor and insignificant parameters. The analysis results show that the degree of influence of haziness and coarse suspended solids on the quality of the finished drink was about 58%. Thus, reducing the number of losses that occur in the production of the kombucha beverage is possible by settling the degree of influence of the above indicators.
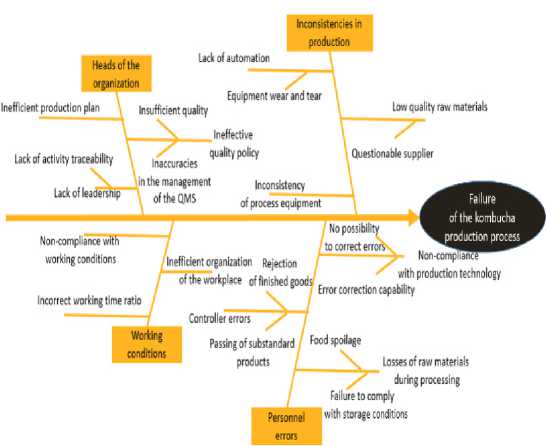
Using the Ishikawa diagram, we determined the reasons for the identified noncompliance of the finished kombucha beverage (Figure 4).
Lack of leadership of process equipment
No possibility to correct errors
Heads of the 1
organization
Inefficient production plan Insufficient quality
Failure of the kombucha production process
Lack of automation
Equipment wear and tear
Low quality raw materials
Questionable supplier
Lack of activity traceability
Error correction capability
Working conditions
Inconsistencies in production
Inaccuracies
In the management of the QMS
Nori-COmplianC^^ with production technology
Ineffective quality policy
Non-compliance with working conditions Inefficient organization Rejection
I of the workplace of finished goods
Incorrect working time ratio
Controller errors
Passing of substandard Foo!l sponge products losses of raw materials during processing
Failure to comply
Personnel with storage coitions errors
Figure 4 – Cause-and-effect diagram of the causes of nonconforming in the production of the kombucha beverage
Thus, the presented work shows the course of statistical analysis with the use of simple quality tools, which was made to identify the significant indicators affecting the total product quality, and presents possible ways to regulate their impact.
References Statistical analysis and evaluation of kombucha beverage production
- Leonov O.A., Temasova G.N., Shkaruba N.Zh. Statistical methods of quality management. SPb.: Lan Publishing House, 2019. 144 p.
- Leonov O.A., Temasova G.N. Statistical methods of quality control and management. M.: FGOU VPO MGAU, 2014. 140 p.
- Leonov O.A. Course design in metrology, standardization and certification. M.: MGAU, 2002. 168 p.
- Bondareva G.I. Design and analysis of the quality of control processes at repair enterprises. M.: Onto-Print Publishing House, 2020. 95 p.
- Leonov O.A., Shkaruba N.Zh. Metrological support of quality control and safety in the production of cooked-smoked sausages at agricultural enterprises // Bulletin of the Timiryazev Agricultural Academy. 2018. No. 3. P. 95-110.
- Leonov O.A., Shkaruba N.Zh. Elements of the HACCP system in the production of cooked-smoked sausages // Food industry: science and technology. 2018. No. 2 (40). P. 4452.
- Prokopov M.A., Mikhailenko A.V. Methodology for studying the biochemical characteristics of the culture fluid of kombucha // Agrarian science. 2022: Proceedings of the All-Russian Conference of Young Researchers (Moscow, November 22-24, 2022). Moscow: Russian State Agrarian University - Moscow Agricultural Academy named after K.A. Timiryazeva, 2022. P. 889-892.
- Prokopov M.A. Quality management of kombucha drink production // Innovative technologies, economics and management in industry: collection of scientific articles of the XI international scientific conference (Volgograd, November 18-19, 2021). Part 1. Volgograd: Limited Liability Company "CONVERT", 2021. P. 66-68.
