Statistical Analysis of the Labor Force of the Arkhangelsk Oblast

Author: Abdullaev E.A.
Journal: Arctic and North @arctic-and-north
Section: Northern and arctic societies
Article in issue: 57, 2024.
Free access
Labor force is a key driver of economic growth and productivity. The more labor force, the more production, trade and services can be created. In addition, the quality and efficiency of the labor force directly affects the level of productivity and competitiveness of the region and countries. Although the workforce is a key resource, managing it can be challenging. One of the main challenges in workforce management is retaining highly qualified employees, as the labor market is constantly changing and opening up new opportunities. This article is devoted to the study of the labor force in the Arkhangelsk Oblast, which is of great importance for understanding the current situation of the region and determining directions for development. The object of the study is the labor force in the specified territory, and the subject is its essence, state, structure and movement. In the course of the study, the following goals were set: determining factors affecting the quality of the labor force, analyzing the dynamics and structure of the labor force, studying the level of employment and unemployment, identifying the impact of the labor force on the economic indicators of the region. The methodological basis of the study is general scientific statistical methods of data analysis: absolute and relative statistical indicators, series of dynamics, correlation and regression analysis. The main conclusion of the article is that the labor force of the Arkhangelsk Oblast is steadily declining, but the balance between the share of men and women in it is preserved. However, the problem of unemployment during the period under review becomes more relevant for women than for men. These changes reflect the need for key measures that will stimulate not only economic development, but also the creation of favorable working conditions.
Labor force, employed, unemployed, economy, dynamics, analysis
Short address: https://sciup.org/148330019
IDR: 148330019 | UDC: [331.5:311](470.11)(045) | DOI: 10.37482/issn2221-2698.2024.57.77
Text of the scientific article Statistical Analysis of the Labor Force of the Arkhangelsk Oblast
DOI:
The term “labor force” refers to people who are willing to provide their work in exchange for wages. This term has deep roots in both economic theory and resource management practice. Unlike more modern terms such as “economically active population” or “labor resource”, “labor force” has a more precise and narrow specification. It focuses specifically on people who can be directly involved in the production process or the provision of services, creating tangible and intangible value for the economy [1].
The novelty of this study is in the statistical analysis of the labor force of the Arkhangelsk Oblast. The author emphasizes the importance of the labor force and analyzes its impact on the level of productivity and competitiveness of the region. The study was designed to determine the
∗ © Abdullaev E.A., 2024
This work is licensed under a CC BY-SA License
NORTHERN AND ARCTIC SOCIETIES
Abdullaev Elvin Akhmed oglu. Statistical Analysis of the Labor Force … factors influencing its quality, dynamics and structure, as well as to assess the impact of the labor force on the economic indicators of the region.
The subject of the study is the reduction of the labor force, which is considered to be the biggest economic problem in the Arkhangelsk Oblast. Its consequences can affect regional growth, productivity and competitiveness. Proper planning of education, infrastructure and investment not only contributes to the development of stability by creating good jobs, but also improves workers’ skills and attracts investment. The purpose of the study is to analyze the current state of the labor market in the Arkhangelsk Oblast, to identify factors affecting the quality of the labor force, and to take steps to develop programs that strengthen the local economy by promoting growth and motivation of workers.
The author conducts a comprehensive statistical analysis using absolute and relative indicators of employment and unemployment, as well as a correlation and regression method to assess the impact on regional economic factors. Labor force issues have also attracted the attention of scientists from a wide variety of disciplines, including economics, sociology and demography — this is reflected in the diversity of their approaches and methodologies. Research is aimed at conducting a comprehensive analysis of the labor force, including its quality, structure, dynamics, as well as studying the relationship between indicators. For example, M.A. Kakushkina [1] focuses on the interpretation of the economic category “labor force”, emphasizing its role in the production process and the creation of tangible and intangible values in the economy. E.Yu. Sapozhnikova [2] believes that education is a key component of labor quality and emphasizes the need to improve education and professional training. In their research, L.A. Davletshin [3] and his colleagues statistically assessed the impact of socio-economic factors on the workforce and identified key areas for improving its efficiency. Ultimately, comprehensive study and solution to these problems are important for maintaining and improving the competitiveness of the region.
Factors affecting the quality of labor force
The quality of the labor force is one of the most important factors in the development of any territory. In the modern world, where competition in the labor market is growing, the provision of quality workforce becomes a necessity for the sustainable development of the region.
One of the key factors affecting the quality of the workforce is the level of education and professional training of employees [2]. The Arkhangelsk Oblast has a developed education system, including higher education institutions, colleges and vocational schools. High-quality education and specialized training make it possible to provide highly qualified specialists in various sectors of the economy. The Northern Arctic Federal University named after M.V. Lomonosov offers educational programs adapted to the specifics of the region, for example, forestry, ecology and environmental protection in the Arctic zone, natural resource management in harsh climates, as well as programs for the study and preservation of the cultural heritage of indigenous peoples of the North.
Infrastructure and availability of resources also affect the quality of the workforce. The presence of modern production facilities, highways, communications and other infrastructure contributes to the development of business and the attraction of highly qualified specialists. Arkhangelsk has industrial technology parks that create favorable conditions for the development of innovations and the attraction of qualified specialists.
The demographic situation and availability of labor resources also have a huge impact on the quality of the workforce. For example, the presence of young and active population can increase mobility and willingness to master new skills. In the Arkhangelsk Oblast, the share of young people makes up a significant part of the population, which creates the potential for the formation of a highly skilled labor force.
An important aspect affecting the quality of the workforce is the level of wages and social guarantees [3]. Equitable and high wages, as well as the availability of social security and protection of workers’ rights contribute to employee satisfaction and motivation, which, in turn, affects their motivation, professional activity and productivity. A high-quality labor force plays a key role in sustainable development, so it is very important to develop these aspects. The workforce is the foundation of economic growth. Skilled and motivated employees can improve the productivity and efficiency of processes in enterprises. High levels of professionalism and skill of workers help to improve technologies, as well as to develop and implement more innovative approaches to work.
To summarize, it is important to note that in the context of a discussion about labor force reduction in a particular industry, proposals to improve the level of education, qualifications, and wages of workers can be justified for several reasons.
Firstly, advancing the education and skills of workers can help them adapt to the changing demands of the labor market. This is especially important in a situation where some jobs may disappear due to automation. Having a higher level of education can help workers to retrain and find new job opportunities.
Secondly, wages can become an incentive to retain experienced and skilled workers in the industry [4]. This will help to prevent personnel brain drain and preserve accumulated knowledge and experience, which is important for maintaining stability and development of the industry.
Even though labor force reduction is discussed in the article, improving the education, skills and wages of workers can be seen as important steps to maintain and develop industry in the face of change.
Labor force participation rate
The labor force participation rate is an indicator of the size of the working-age population that is either employed or actively seeking work. The rate is calculated as the ratio of the labor force to the total population of the corresponding age 1. The higher the participation rate, the better the economy.
The aggregate unemployment and potential labor force rate is an important tool for assessing the labor market and the state of the country’s economy. It provides a more complete picture of unemployment, taking into account both people who are actively looking for work and cannot find it, and people who could work but for various reasons are not looking for work. The aggregate unemployment and potential labor force rate is calculated as the sum of the potential labor force, employed and unemployed .
Analysis of the labor force of the Arkhangelsk Oblast
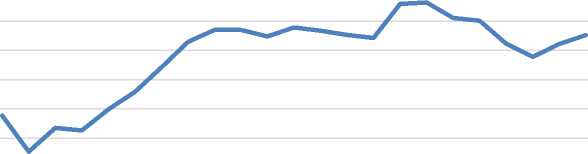
Let us analyze the dynamics of the composition and the size of the labor force aged 15–72 in the Arkhangelsk Oblast, including the Nenets Autonomous Okrug, for the period from 2000 to 2022 2. The dynamics of the labor force, employed and unemployed is shown in Fig. 1:
Changes in the number of labor force, employed and unemployed, thousand people


OH(Ncn'^LЛO^OOQOr^(^lm^LЛtD^OOCЛOH(^l OOOOOOOOOOHHHHHHHHHvHNNN ooooooooooooooooooooooo
Year
—•— Labor force
—•—The number of unemployed
—•—The number of employed
Fig. 1. Changes in the number of labor force.
Calculation examples:
-
• Δ Рс (change in the labor force) = 546.3 – 724.2 = 177.9 thousand — it is important to note that during the period under review, the labor force in the Arkhangelsk Oblast decreased by 177.9 thousand people, which is 24.5% of the labor force in 2000. However, from 2020 to 2021, there was a slight increase in the labor force by 8.2 thousand people.
-
• Δ З (dynamics of employed) = 515.6 – 634.4 = 118.8 thousand — the number of employed from 2000 to 2022 also decreased by 118.8 thousand people, which is about 18.7% of the number of employed in 2000. There has been some growth in employment in recent
NORTHERN AND ARCTIC SOCIETIES
Abdullaev Elvin Akhmed oglu. Statistical Analysis of the Labor Force … years, especially from 2020 to 2022, when the number of people in employment increased by 13 thousand people.
-
• Δ Б (dynamics of unemployed) = 30.7 – 89.8 = 59.1 thousand — for the entire period under review, the number of unemployed decreased by 59.1 thousand people, or 65.8%.
Thus, it can be noted that in the Arkhangelsk Oblast, there is a decrease in the number of the labor force, including the employed, but there has been some growth in recent years. At the same time, the number of unemployed is decreasing, but in recent years this process has slowed down a little.
Since until 2017, the studies were conducted on people aged 15–72 years, and in January 2017, a new concept was introduced for people aged 15 years and older, as well as and the new “potential labor force concept”, the further analysis includes people aged 15 years and older from 2017 to 2022.
The following conclusions can be drawn from the presented data on the size of the labor force (aged 15 years and older) 3 in the Arkhangelsk Oblast:
-
• the total labor force has been decreasing for six years, but after a drop in 2020 it increased slightly in 2021. The downward trend in the number of the labor force is not only a factor of recent years, it has been observed for the past 23 years (Fig. 1);
-
• a decrease in the number of employed people during the period under review indicates that the situation on the labor market in the Arkhangelsk Oblast was unstable. The number of unemployed people has shown a slight downward trend, with increase in 2020 and decrease in subsequent years;
-
• the number of people not in the labor force has been increasing for six years, which may indicate a lack of jobs and prospects for people who want to work. The number of potential labor force as a whole has also decreased, but only slightly, which may be due to people switching to other types of employment or finding work in other regions.
Next, let us analyze the participation rates of the population in the labor force and identify the employment, unemployment and the aggregate unemployment and potential labor force rates.
Table 1
Distribution of labor force participation rates, %
|
Indicator |
Labour force participation rate |
Employment rate |
Unemployment rate |
Aggregate unemployment and potential labor force rate |
|
2017 |
61.0 |
57.1 |
6.4 |
9.1 |
|
2018 |
60.1 |
56.2 |
6.4 |
8.8 |
|
2019 |
58.9 |
55.2 |
6.3 |
9.6 |
|
2020 |
58.0 |
53.7 |
7.4 |
10.7 |
|
2021 |
59.0 |
55.1 |
6.6 |
9.6 |
|
2022 |
58.9 |
55.5 |
5.6 |
8.1 |
3 Statistical yearbook of the Arkhangelsk Oblast. Federal State Statistics Service. URL: (accessed 15 January 2024).
Calculation examples:
-
• - U = . * 100 = 58.9% — the labor force participation rate for 2022 in the Ar-
- р 547.3 + 382. .
khangelsk Oblast was 58.9%.
-
• - U = . * 100 = 55.1% — the employment rate for 2021 in the Arkhangelsk Ob-
- з .3 +383. .
last was 55.1%.
-
• - U = . * 100 = 7.4% — the unemployment rate for 2020 in the Arkhangelsk Oblast
544.8
was 7.4%.
. .
-
• - U бп = * 100 = 9.6% — the aggregate unemployment and potential labor force
rate for 2019 in the Arkhangelsk Oblast was 9.6%.
According to the calculations, during the period under review, the lowest percentage of the labor force participation rate and the employment rate were in 2020, while the highest percentage of unemployment was observed in this year. This may be due to many factors, including the COVID-19 pandemic, which led to restrictions in various sectors of the economy and significantly affected the labor market. Movement restrictions and social distancing led to the closure of many businesses, which caused a sharp decline in employment. As a result, the employment and labor force participation rates decreased, while the unemployment rate increased.
Next, we determine the labor force participation rate, as well as the employment and unemployment rates separately by gender 4 .
The following conclusions can be drawn from the data presented:
-
• over the entire period, the labor force participation rate of men is higher than that of women. Male labor force participation rate decreased by 2.1%, and female — by 2.3% from 2017;
-
• the unemployment rate among men has generally decreased over the period under review, but there are fluctuations depending on the year. The unemployment rate among men is higher than that of women, but the difference is gradually decreasing. The unemployment rate among women has increased by 0.6% over the period under review;
-
• the aggregate unemployment and potential labor force rate also shows some differences between the groups. The highest rate is observed among women in 2020, which may be related to the COVID-19 pandemic and its impact on the labor market.
To summarize, the labor market is subject to change, and additional efforts are needed to create conditions that ensure sustainable employment growth and a decrease in unemployment. Employment and unemployment rates are inversely related to each other, which is a natural phenomenon in the labor market.
Table 2 shows the percentage of men and women in the labor force aged 15 and over. These data provide information on market economy trends over the current period and allow us to look at changes in the participation of men and women in the economy, as well as their unemployment rates.
Table 2
Ratio of men and women in the labor force, %
|
Indicator |
Labor force |
including |
||||
|
Men |
Women |
Employed |
Unemployed |
|||
|
Men |
Women |
Men |
Women |
|||
|
2017 |
51.6 |
48.4 |
51.2 |
48.8 |
57.4 |
42.6 |
|
2018 |
50.5 |
49.5 |
50.8 |
49.2 |
46.9 |
53.1 |
|
2019 |
51.8 |
48.2 |
51.4 |
48.6 |
57.6 |
42.4 |
|
2020 |
52.0 |
48.0 |
52.2 |
47.8 |
48.6 |
51.4 |
|
2021 |
50.9 |
49.1 |
50.6 |
49.4 |
54.5 |
45.5 |
|
2022 |
51.9 |
48.1 |
52.3 |
47.7 |
45.8 |
54.2 |
The following conclusions can be drawn from the data on the ratio of men to women in the labor force:
-
• in 2017–2022, the proportion of men and women in the labor force fluctuated, but overall remained relatively equal. Throughout the period, the proportion of men in the labor force was higher than the proportion of women. However, this difference was relatively small and amounted to approximately 1–3.9 percentage points. Over the period under review, the proportion of men in the labor force increased by 0.3 percentage points, while the proportion of women decreased by 0.3 percentage points;
-
• during the period under review, the proportion of men in the labor force always exceeded the proportion of women among both men and women. The difference between the genders in employment is also small. Over the entire period, the proportion of employed men increased, the proportion of women, on the contrary, decreased by 0.3 percentage points;
-
• comparing the data on unemployed men and women, it can be seen that in some years the share of unemployed women was higher than the share of unemployed men. During the period under review, the share of unemployed men decreased by 11.6 percentage points, while the share of women increased by 11.6 percentage points.
Thus, analyzing the presented data, it can be generalized that men and women in the labor force are characterized by relative stability during the period under study. However, there are some fluctuations in the gender ratio in the categories of employed and unemployed.
Next, let us analyze the rate of labor force dynamics by gender for the entire period under study, which is shown in Table 3. Analysis of these data will allow us to assess changes in the labor force, employment and unemployment among men and women.
Table 3
The rate of dynamics of the labor force by gender and employment, %
|
Indicator |
Labor force |
including |
||||
|
Men |
Women |
Employed |
Unemployed |
|||
|
Men |
Women |
Men |
Women |
|||
|
Rate of dynamics |
93.33 |
92.13 |
95.54 |
91.47 |
64.68 |
103.09 |
The following conclusions can be drawn from the table:
-
• the number of men in the labor force in 2022 was 93.33% of the 2017 level, and the share of women was 92.13%. This means that the number of men in the labor force decreased by 6.67%, and women — by 7.87%.
-
• the number of employed men over the entire period decreased by 4.46%, and employed women — by 8.53%.
-
• the indicator of the dynamics of the number of unemployed men for the period under review was 64.68%, and of unemployed women — 103.09%. This demonstrates the dynamics of decreasing unemployment among men and positive dynamics of increasing unemployment among women. It is quite possible that during this period, women faced greater difficulties in finding work compared to men.
Table 4 shows the changes in the labor force, including employed and unemployed, for 2017–2022. This information is an important indicator of economic development and allows assessing the state of the labor market. The labor force is a key resource for any region and country, as it forms the basis for production and wealth creation.
Table 4
Distribution of the labor force, employed and unemployed
|
Indicator |
2017 |
2018 |
2019 |
2020 |
2021 |
2022 |
|
Number of labor force, thousand people |
590.1 |
575.2 |
558.2 |
544.8 |
552.3 |
547.3 |
|
Baseline (compared to 2017) indicators |
||||||
|
Absolute change (Dyб), thous. |
- |
-14.9 |
-31.9 |
-45.3 |
-37.8 |
-42.8 |
|
Dynamics coefficient (kб) |
1.000 |
0.975 |
0.946 |
0.923 |
0.936 |
0.927 |
|
Rate of dynamics (Tб), % |
100.0 |
97.5 |
94.6 |
92.3 |
93.6 |
92.7 |
|
Rate of change (DTб), % |
0.0 |
-2.5 |
-5.4 |
-7.7 |
-6.4 |
-7.3 |
|
Chain (annual) indicators |
||||||
|
Absolute change (Dyб), thous. |
Х |
-14.9 |
-17 |
-13.4 |
7.5 |
-5 |
|
Dynamics coefficient (kц) |
Х |
0.975 |
0.970 |
0.976 |
1.014 |
0.991 |
|
Rate of dynamics (Тц), % |
Х |
97.5 |
97.0 |
97.6 |
101.4 |
99.1 |
|
Rate of change (DТц), % |
Х |
-2.52 |
-2.96 |
-2.40 |
1.38 |
-0.91 |
The following conclusions can be drawn from the table:
-
• according to the baseline indicators relative to 2017, the absolute change in the labor force varied from -14.9 to -45.3 thousand people. The rate of change also decreased, which indicates a slowdown in the rate of labor force reduction.
-
• chain indicators reflect changes in the labor force compared to the previous year. The absolute change varies from -14.9 to 7.5 thousand people. The dynamics coefficient
NORTHERN AND ARCTIC SOCIETIES
Abdullaev Elvin Akhmed oglu. Statistical Analysis of the Labor Force … shows that the number decreased in most years, with the exception of 2021, when there was a small increase. The rate of change also varies, but generally a negative trend is maintained with some surges and slowdowns.
Let us calculate the average annual number, average annual absolute and relative changes in the labor force for the period under review.
If the intervals between observations are equal, we use the formula of a simple chronological average and calculate the average annual number of the labor force s [7].
4901 447 3
. -+575 .2+558.2+544.8+552.3+ — .
5 2 2 = 559.8 thousand — during the period under review, the average annual labor force was 559.8 thousand people, of which 523.2 thousand people were employed and 36.6 thousand were unemployed. The average annual potential labor force was 17.9 thousand people.
Δy (annual average absolute change) = (547.3-590.1)/5 = -8.6 thousand — on average, in the Arkhangelsk Oblast over the year, the labor force decreased by 8.6 thousand people, of which the employed decreased by 7.1 thousand people, and the unemployed — by 1.5 thousand people, the potential labor force decreased by 0.5 thousand people.
Iy (annual average relative change) = ((547.3/590.1)^(1/5))*100-100 = -1.5% — on average, over the year, the number of labor force aged 15 years and older decreased by 1.5%, the number of employed —by 1.3%, the number of unemployed — by 4.1%, and the potential labor force decreased by 3.3%.
In light of continuous development and change in demographic indicators, the analysis of the size of the region’s labor force is becoming an important aspect for forecasting future trends in the economy [5]. Using certain methods and formulas, it is possible to estimate the expected size of the labor force in a certain period of time. Let us consider the expected size of the labor force and the potential one in 2024.
Number of employed: 516.5*((516.5/552.1)^(1/5))^2 = 502.9 thousand people.
Number of unemployed: 30.8*((30.8/38)^(1/5))^2 = 28.2 thousand people.
Number of potential labor force: 14.8*((14.8/17.5)^(1/5))^2 = 13.8 thousand people.
As a result of the calculations, provided that the current trend in the number of labor force and potential labor force continues, we can conclude that in 2024 the number of labor force is expected to decrease to 531.1 thousand people, and the potential labor force — to 13.8 thousand people.
Correlation and regression analysis
Investments in fixed capital play a key role in the development of the regional economy and ensuring sustainable growth. In the context of the Arkhangelsk Oblast, one of the factors that have a significant impact on attracting and retaining investments is the size and qualifications of the labor force. It is an important resource that ensures production processes and contributes to economic growth. The size of the labor force affects the demand for investments in fixed capital, since more workers require more production capacity and equipment [8]. A large workforce can stimulate investments in new technologies and innovations. When there is a large labor force on the market, organizations seek to improve the efficiency of their production. They may invest in automation, robotization or new technologies to generally improve the speed and quality of the work process.
Let us consider the dependence of investments in fixed capital on the labor force in the Arkhangelsk Oblast. Table 5 shows the dynamics of the labor force and investments in fixed capital 5.
-
Table 5
Dynamics of labor force and investment in fixed capital
|
Indicator |
Labor force, thousand people |
Investments in fixed capital, mln rubles |
|
2017 |
590.1 |
215 493.3 |
|
2018 |
575.2 |
198 357.4 |
|
2019 |
558.2 |
193 157.5 |
|
2020 |
544.8 |
197 761.4 |
|
2021 |
552.3 |
180 642.7 |
|
2022 |
547.3 |
162 906.9 |
To determine the dependence between these economic indicators, we use the experimental method; for this purpose we study the paired regression models: linear, degree, exponential, hyperbolic, selecting the best indicators for each coefficient characteristics: correlation, determination, Fisher criterion and average approximation error [6]. Table 6 presents all the indicators we need.
-
Table 6
Regression data
|
Indicator |
Linear |
Degree |
Exponential |
Hyperbolic |
|
Correlation coefficient |
0.739 |
0.741 |
0.720 |
0.736 |
|
Determination coefficient |
0.546 |
0.549 |
0.519 |
0.541 |
|
Fisher criterion |
16.867 |
17.009 |
15.111 |
16.533 |
|
Average approximation error |
5.563 |
5.498 |
5.813 |
5.621 |
According to the provided data, the best paired regression model is the degree one. It has high values of the correlation coefficient of 0.741 and determination of 0.549, which indicates a strong positive relationship between investment and labor force. The Fisher criterion for the degree model is the highest, which indicates its statistical significance. The smallest average approximation error for the degree model is 5.498, which is an accurate forecast.
Comparative analysis of the labor force of the Arkhangelsk Oblast and the Russian Federation
Let us analyze the labor force size aged 15–72 years in the Russian Federation 6 for the period from 2000 to 2022. The dynamics of the labor force size are shown in Fig. 2:
Investments in fixed
assets.
Federal State Statistics Service. URL:
(accessed 11 February 2024).
Dynamics of the number of labor force, employed and unemployed, thousand people
»! 78000.0
Q.
8 77000.0 Q.
oн(Nm^lЛ^o^oomoнNm^■lЛ^D^oomoнr^ OOOOOOOOOOHHHHHHHHHHINNN ooooooooooooooooooooooo
73 76000.0
C
5л 75000.0
_C 74000.0
_oj 73000.0
2 72000.0
CD
Q_ 71000.0 о
Ф 70000.0
E 69000.0 з z
Year
Fig. 2. Dynamics of the labor force size.
Figure 2 shows that from 2000 to 2022, the Russian Federation experienced general upward trends in the labor force size, although there were some fluctuations between the years. Since the beginning of the period under review, the labor force peaked in 2000, followed by a noticeable decline in 2001. However, a gradual increase began in 2001 and continued until about 2009. After this period, the general trend in the labor force was relatively stable, with minor fluctuations in some years. Some crises, such as the 2008–2009 crises, and the effects of the COVID-19 pandemic may have had a temporary negative impact on the labor force, which is reflected in the decline in official data. In recent years (2020–2022), there has been some growth in the labor force, which may be a sign of economic recovery from the pandemic and the measures taken to support employment. These changes reflect the complex economic, social and demographic processes affecting the country’s labor market.
Comparing these indicators with the data for the Arkhangelsk Oblast, it can be noted that the general trend in the size of the labor force in the compared territories is similar: from 2000 to 2022, there were fluctuations in the size of the labor force both in Russia and in the Arkhangelsk Oblast. However, it is worth noting that while against the background of all-Russian data, there was an increase in the size of the labor force from 2000 to about 2009, in the Arkhangelsk Oblast this trend was less pronounced, and since 2008 a downward trend started.
It is also worth noting that in recent years (2020–2022), both in Russia and in the Arkhangelsk Oblast, there has been a general trend towards labor force growth, which may indicate economic recovery after the pandemic and measures taken to support employment. However, although there is growth in the region, it still remains at a relatively low level compared to the allRussian indicator.
The number and composition of the labor force aged 15–72. Federal State Statistics Service. URL:
(accessed 22 March 2024).
Conclusion
The Arkhangelsk Oblast is one of the most developed regions in the country. However, as in many other regions, one of the main problems here is the lack of labor force. This creates problems for some companies and hinders local economic development. Over the past six years, the number of workers in the Arkhangelsk Oblast has decreased: in 2017 — 590.1 thousand people, and in 2022 — 547.3 thousand people. During this period, the labor force decreased by 7.3%, which may have a negative impact on the economy, leading to a decline in the production of goods and services and a drop in economic activity. Although the number of employed people decreased throughout the period, in 2021–2022 it increased slightly from 515.7 thousand people to 516.5 thousand people. There were also some fluctuations in the number of unemployed, decreasing from 38.0 thousand people in 2017 to 30.8 thousand people in 2022. The potential workforce has decreased by 270 thousand people over the past six years. This may indicate that the number of people willing to work in this region is decreasing.
As a result of the study, the main objectives have been achieved. It was found that the quality of the labor force depends on many factors, such as education, work training, demographics and wage levels. The region needs to improve education and create favorable conditions for life and work. It was found that the workforce is declining, the gender balance in it is still preserved, but targeted measures are needed to stimulate employment. The statistics provided insights into changes in the structure of the labor force, including changes in employment and unemployment, with an emphasis on the increased risk of unemployment for women.
The article also shows how both the quality and quantity of the labor force affect the economic development of the region. In order to improve the situation, the importance of investing in human capital and creating a favorable economic environment was emphasized. Based on this analysis, the hypothesis is confirmed that the workforce has a significant impact on the state of the region, and the human resource management is important to overcome existing problems and promote development.
References Statistical Analysis of the Labor Force of the Arkhangelsk Oblast
- Kakushkina M.A. About the Interpretation of Economic Category “Labour”. Social-Economic Phe-nomena and Processes, 2009, no. 4 (16), pp. 61–65.
- Sapozhnikova E.Y. Education as a Major Factor Quality Workforce. Issues of Economics and Man-agement, 2012, no. 1 (5), pp. 73–76.
- Davletshina L.A., Sadovnikova N.A., Bezrukov A.V., Lebedinskaya O.G. Statistical Assessment of the Impact of Socio-Economic Factors on the Russian Labour Force. DEMIS. Demographic Research, 2022, vol. 2, no. 4, pp. 25–44. DOI: https://doi.org/10.19181/demis.2022.2.4.2
- Abdulkhairova E.M., Bekirova S.E. Cyclic Relationship between Wages, Labor Productivity and Hu-man Capital Quality. Scientific Bulletin: Finance, Banking, Investment, 2020, no. 2 (51), pp. 127–133. DOI: https://doi.org/10.37279/2312-5330-2020-2-127-133
- Nemolochnova K.O. Statistical Analysis of the Level of the Employed Population in the Economy of the Russian Federation. Young Scientists’ Forum, 2019, no. 1–2 (29), pp. 1011–1016.
- Ivin E.A., Artamonov N.V., Kurbatskiy A.N. Methodological Manual on Econometrics for Socio-Economic Specialities. Vologda, FSBIS VolSC RAS Publ., 2016, 184 p. (In Russ.)
- Orlov A.I. On Mean Values. Large-Scale Systems Control, 2013, no. 46, pp. 87–111.
- Aralbaev A.T., Aralbaeva G.G. Research of Labor Force Movement Influence on Economic Indexes in the Region. Vestnik of the Orenburg State University, 2007, no. 5, pp. 74–79.
