Statistical Features Based Approach (SFBA) for Hourly Energy Consumption Prediction Using Neural Network
 for Hourly Energy Consumption Prediction Using Neural Network")
Author: Fazli Wahid, Rozaida Ghazali, Muhammad Fayaz, Abdul Salam Shah
Journal: International Journal of Information Technology and Computer Science(IJITCS) @ijitcs
Article in issue: 5 Vol. 9, 2017.
Free access
In this paper, new statistical features based approach (SFBA) for hourly energy consumption prediction using Multi-Layer Perceptron is presented. The model consists of four stages: data retrieval, data pre-processing, feature extraction and prediction. In the data retrieval stage, historical hourly consumed energy data has been retrieved from the database. During data pre-processing, filters have been applied to make the data more suitable for further processing. In the feature extraction stage, mean, variance, skewness, and kurtosis are extracted. Finally, Multi-Layer Perceptron has been used for prediction. For experimentation with Multi-Layer Perceptron with different training algorithms, a final model of the network was designed in which the scaled conjugate gradient (trainscg) was used as a network training function, tangent sigmoid (Tansig) as a hidden layer transfer function and linear function as an output layer transfer function. For hourly energy consumption prediction, a total of six weeks data of ten residential buildings has been used. To evaluate the performance of the proposed approach, Mean Absolute Error (MAE), Mean Squared Error (MSE) and Root Mean Squared Error (RMSE), evaluation measurements were applied.
Energy Efficiency, Energy Prediction, Energy Management, Multi-Layer Perceptron, Neural Network, Residential Buildings
Short address: https://sciup.org/15012644
IDR: 15012644
Text of the scientific article Statistical Features Based Approach (SFBA) for Hourly Energy Consumption Prediction Using Neural Network
Published Online May 2017 in MECS
In order to find the future demands of energy, the energy consumption prediction at various scales is very important. The accurate energy consumption prediction also plays a key role in efficient production, distribution, selling, operation, planning and management in the energy management system. Power generation systems can be made more reliable if with the accurate energy consumption prediction. Further, if efficient energy consumption is carried out, the economy, fuel utilization, and other sectors dependent on energy management systems can be managed in a better way [1].
The energy consumption prediction can be divided into, short term, medium term, and long-term categories based on the time in which the energy has been utilized. Different techniques have been proposed in the literature for the energy consumption prediction with various evaluation criteria, parameters and the varying degree of accuracies [2]. In this paper, the most successful Artificial Neural Network classifier has been used for the prediction of energy consumption.
Artificial Neural Network has been used for different types of modeling in various disciplines including Medicine, Mathematics, Economics, Engineering, Meteorology, Psychology, Hydrology and Neurology [35]. Neural Networks have become popular since their first inception in 1943 [6]. Neural Networks have strong capability of solving prediction problems with variables having stochastic nature, unknown or non-linear variations, or less controlled environment is required for their determination [7]. Further, due to the flexibility and less assumption-dependency, the physical processing between input and output is not required in Neural Networks [8-9].
For the better management of energy production and storage system, the hourly energy consumption prediction is very important. The objective of this paper is hourly energy consumption prediction using Multi-Layer Perceptron (MLP). Similar to previous works in energy consumption prediction, historical data of energy consumption has been used to predict future consumption.
A total of six weeks data of ten residential buildings has been used for the hourly energy consumption prediction. To evaluate the performance of the proposed approach, Mean Absolute Error (MAE), Mean Squared Error (MSE) and Root Mean Squared Error (RMSE), evaluation measurements were applied.
The remaining structure of the paper is organized as, the section II presents Literature Review, section III contains Proposed Model. Section IV contains details of the Multi-layer Perceptron, section V contains Experimental Results and Discussion and finally, in section VI, the Conclusion is provided.
-
II. Literature Review
The research has been carried since last four decay in the field of energy prediction for the better management of energy resources.
Carpinteiro et al., in [10], used Neural Network based model for the forecasting of the short term load. Authors have introduced an extension of the self-organizing map to STLF. The proposed model has two self-organizing maps for the load forecasting. Euclidian distance has been used for the calculation of the difference between two vectors. The data has been extracted from Brazilian utility. The training of the model has been carried out in two phases: coarse mapping and fine tuning. The model has provided satisfactory load forecasting in short and long forecasting.
Gross et al., in [11], focused on the short term load forecasting. They have used time series and regression models for load forecasting.
Irisarri et al., in [12], presented results on a model for internal short-term load forecasting. An online algorithm using the least squared squares approach has been used. The energy consumption data from January to August 1977 has been used for experimentation. The Kalman filter has been used to model the normal load and nominal temperature. The algorithm can predict the summer and winter session energy consumption.
Ali et al., in [13], proposed a six-stage model for the energy consumption prediction. Fuzzy controller algorithm has been used to output the required power to control the temperature, illumination, and air quality. The authors have also used Fuzzy Logic and Kalman filter. The authors have addressed both energy efficiency and user comfort level in a building environment.
Ali et al., in [14], improved previously proposed method based on Genetic Algorithm. The method has improved the comfort index, with less energy as compared to the previous model.
Kiartzis et al., in [15], used a fuzzy expert system for the forecasting of daily energy consumption. The fuzzy system has multiple inputs and a single output. The product Degree fulfillment method has been used for the scaling of the membership function. The Larsen MaxProduct implication method was used to perform inference operation. The implementation of the model is simple and requires less time for the training of the data, and provided more accurate results.
Miranda in [16], proposed a methodology that uses fuzzy inference over GIS support, to observe the behavior of influence factors on load growth. The authors have coupled the GIS with the fuzzy inference engine for the prediction of energy consumption and load forecasting. The model consists of a fuzzy inference engine, cellular automata engine, scenario generator and grid generator.
Saini in [17], used feed three layered forward Neural Network for the prediction of 7 days ahead peak load forecasting. For experimentation eleven weather parameters and past consumption, load information has been used. The data for training was selected using the sliding window concept. The dimension reduction has been carried out with Principal Component Analysis. The weights and biases have been initialized with Nguyen and Widrow method.
-
III. Proposed Model
The proposed model has four main steps, which are further divided into sub-steps. The main steps of the model are:
-
■ Data Retrieval.
-
■ Data Pre-Processing.
-
■ Feature Extraction.
-
■ Prediction.
Data Retrieval
Data Preprocessing
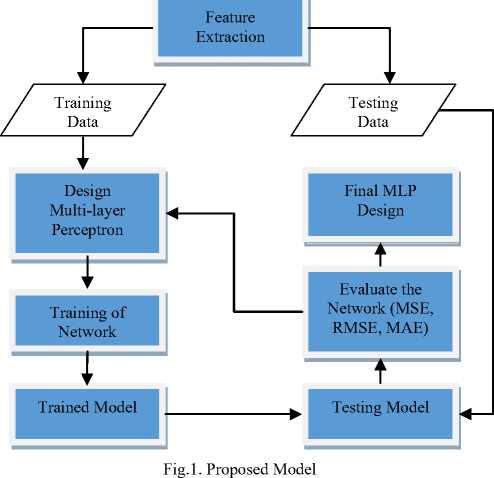
The proposed model has been graphically represented in Figure.1. The detailed description of the processes at each step of the model are provided for the better understanding of the proposed approach for the energy consumption prediction.
The accurate energy consumption prediction will be helpful for the supplier of energy and they will supply the required amount of energy to tackle the problem of the energy crisis and better management of valuable energy resources.
-
A. Data Description
The database consists of six weeks data of energy consumed by 10 residential buildings from September 1 to October 12, 2004. The data contain a total of 10080 samples, which has been divided into 60% training (6048 Samples) and 40% testing (4032 Samples) for experimentation. For the classification and prediction of energy consumption Multi-Layer Perceptron has been selected based on the strong prediction capability.
-
B. Data Preprocessing
The success of the models depends on the data preprocessing step. The accuracy of the system directly depends upon the preprocessing. The preprocessing was performed to make data suitable for the classifier and for the removal of noise. In this paper, the preprocessing of the hourly energy consumption data is performed to make it suitable for the accurate energy consumption prediction. In pre-processing missing values and outlier removal has been carried out. There are different techniques used in literature, but we have used windows based averaging mechanism for outlier removal and handling missing values [18-21]. The most recent 10 values were stored in a temporary buffer so that they can be replaced in case of outlier or missing value in data. The outlier or missing values in the data were replaced with the average of these values.
-
C. Feature Extraction
After preprocessing the feature extraction step has been carried out. The feature extraction also plays an important role in the accuracy of the model. The features can be divided into local and global features. In this paper, four statistical features, i.e. mean, variance, skewness, and kurtosis are extracted from the preprocessed hourly power consumption data. The mean can be calculated using (1), variance by (2), skewness by (3), and Kurtosis using (4).
N
M=N X Xi(1)
i = 1
N
-
V=N X.=,( Xi- »)(2)
N
S = X (Xi- ^(3)
i = 1
N
K = 7F X (Xi- ^)4
i = 1
Where x i represents the power consumption over the ith hour of the day, i = 0, 1, 2,…,23. N represents the total number of hours i.e. 24 for hourly consumption prediction. M (µ) represents mean, V represents variance, S represents skewness and K represents Kurtosis.
-
D. Model Training and Testing
The accuracy of the classifier depends on the amount of training data. For the proper training of the MLP, the database has been divided into training and testing data. For hourly consumption prediction, we have data of 10080 samples, which was divided into 6048 samples (60%) for training and rest of the 4032 samples (40%) for testing of the Multi-layer Perceptron.
-
E. Prediction
The energy consumption prediction has been carried out using Multi-layer Perceptron. The detailed description and design of the Multi-layer Perceptron are provided in Section IV. The performance of the proposed architecture has been evaluated using Mean Absolute Error (MAE), Mean Squared Error (MSE) and Root Mean Squared Error (RMSE).
-
IV. Multi-Layer Perceptron For Prediction
Multi-layer Perceptron (MLP) is a successful prediction algorithm in different areas of research. MLP has few advantages as it provides higher accuracy with complex classification problems. The disadvantages of the MLP are high training time and a large number of training data for accurate prediction. Despite the disadvantages of the MLP, more authors prefer MLP over other algorithms due to its higher accuracy [22-23]. In this paper, we have used MLP for the prediction of energy consumption, the detailed structure, and working of the MLP is as under.
-
A. Problem Specific Parameters
The input parameters for hourly energy consumption prediction are building number, day, hour, previous hour consumption, the mean, the variance, the skewness and the kurtosis of the entire day hourly consumption. The building number ranges from 1 to 10, the day has values from 1 to 42, a total of 42 days data for ten buildings. The hour has values from 1 to 24, past consumption has real values of energy consumption during the last hour. The mean shows the average of 24 hours hourly consumption. The variance shows variations in 24 hours hourly consumption. The Skewness shows the asymmetry in 24 hours hourly consumption and Kurtosis shows peakedness or frequency of extreme 24 hours hourly consumption. The output parameter of the model is next hour energy consumption.
-
B. Structure and Parameters of MLP
Artificial Neural Network with more than one layer is called a Multi-Layer Perceptron, which is a complex structure of elements called Neurons. The Multi-layer Perceptron consists of different types of training algorithms, hidden layer transfer function, and output layer transfer functions. For the design of Multi-Layer Perceptron, tangent sigmoid, linear function, and logarithmic sigmoid functions are important. These functions can be computed using equations (5), (6) and (7) [24].
χ (x) = linear (x) (5)
Ф ( x ) = , 2-2 х — 1 (6)
1 + e 2 x
V ( x ) =
1 + e " x
Hidden layers and output layer of Neural Network use these functions in different combinations for developing the best predictive model as described by the authors in [9], [25-26].
-
C. Graphical Representation of MLP
The final selection of Multi-Layer Perceptron used for experimentation having input, hidden and output layers as shown in Figure 2. The input layer has 8 neurons, the hidden layer has 25 neurons and the output layer has 1 neuron for the prediction of energy consumption. The number of neurons can be increased or decreased, but we have selected a moderate number of Neurons for better energy prediction with minimum training time. In the figure 1 values X1 to X1 represent the Neuron number of the input layer, similarly, the N1 to N25 represent the number of neurons in the hidden layer, and the output layer has the single neuron that represents the predicted energy consumption.
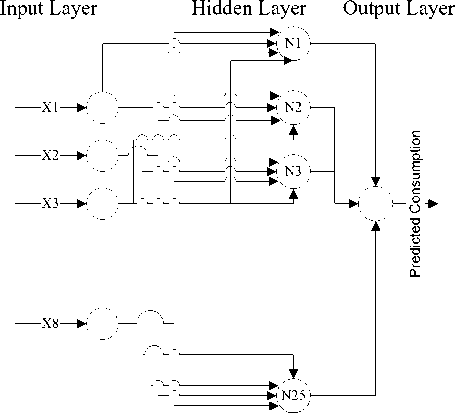
Fig.2. MLP with Three Layers
-
D. MLP Training and Testing
The network was trained and tested for different types of network training functions, hidden layer transfer functions, output layer functions, and using the diverse number of neurons in the hidden layer. After extensive experimentation, a final model of the network was designed in which we used scaled conjugate gradient (trainscg) as a network training function, tangent sigmoid (Tansig) as a hidden layer transfer function and linear function as an output transfer function. In the input layer, there were 8 neurons that represent the input parameters, in the hidden layer, there were 25 neurons, and in the output layer, the number of neurons was one that represents the predicted energy consumption.
For the training of the designed model 60% of the data has been used and remaining 40% has been used for the testing of the model for the prediction of the energy consumption.
The increase in the ratio of training data may improve the performance of the system further.
-
E. Performance Evaluation of MLP
The performance measure for any technique is important to measure the success of the model. For the measurement of performance authors have used different methods. In this paper, the performance of the proposed architecture has been evaluated using Mean Squared Error (MSE), Mean Absolute Error (MAE), and Root Mean Squared Error (RMSE). The performance parameters have been computed using (8), (9) and (10).
n
MSE = - У (Ai - Pi)2(8)
n
I = 1
n
MAE = - У | Ai - Pi(9)
n i = 1
n
RMSE = - У (Ai - pi)2(10)
n
-
V
Where n, represent the number of observations, A represent actual value and P denote predicted value.
-
V. Experimental Results And Discussion
All simulations have been performed on Intel (R) Core (TM) 2 Quad CPU A9550 @ 2.83GHz with MATLAB installed on it. In the experiments, each network model has eight neurons in the input layer, one neuron in the output layer and 5-60 neurons in the hidden layer starting from 5 up to 60 with an increment of 5 to find the best number of Neurons that fits with different types of training functions used in the experiments [9], [27]. In this paper, we have increased the number of neurons in the hidden layer up to 25. We have used trial and error mechanism for changing the number of neurons in the
hidden layer because there is no defined rule for setting the number of neurons in the hidden layer as described by [27]. The average values of MSE, MAE and RMSE observed for the twenty run of the final network model are shown in the table 1.
Table 1. Performance Parameters Measurements
|
Performance Parameter |
Best Value |
Average Value |
Worst Value |
|
MSE |
0.0425 |
0.0758 |
0.1326 |
|
MAE |
0.0253 |
0.0563 |
0.0987 |
|
RMSE |
0.2061 |
0.2753 |
0.3641 |
Figures 3-10 show actual hourly consumed power, predicted hourly consumed power, and the errors observed in the hourly consumption prediction during the different days of the month. For the predictions of energy consumption, we have observed the model with the criteria of the number of days. The observation has been carried out for 4 days, 7 days, 14 days, and 30 days. The figure 3, represent the deviation of actual and predicted values of energy consumption during 4 days from 1st September to 4th September. The absolute error observed in the prediction of energy consumption during 4 days is represented in figure 4.
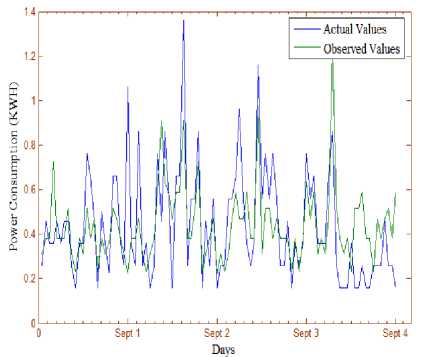
Fig.3. The Actual and the Predicted Values of Energy Consumption of a Single Apartment during Four Days of the Month.
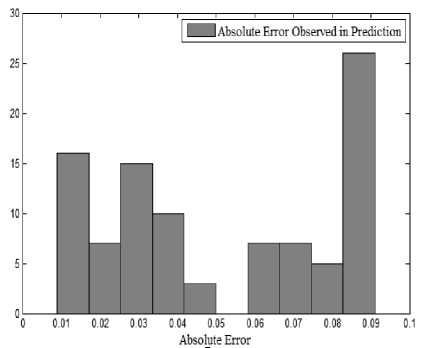
Fig.4. The Histogram of Absolute Error Observed in the Prediction of Energy Consumption of an Apartment during Four Days of the Month .
In the next step, we have selected the data of 7 days energy consumption from 1st September to 7th September. The deviations in actual and predicted values are represented in figure 5. The graph clearly represents the improvement in the prediction as compared to the data of 4 days, because the accuracy of the MLP increases with a large amount of data but the processing time also increased. The absolute error in the prediction of energy consumption during 7 days of a month has been represented in figure 6. The error rate has also decreased as compared to the error rate observed with the data of 4 days. At some point in the histogram, a very high absolute error rate was observed.
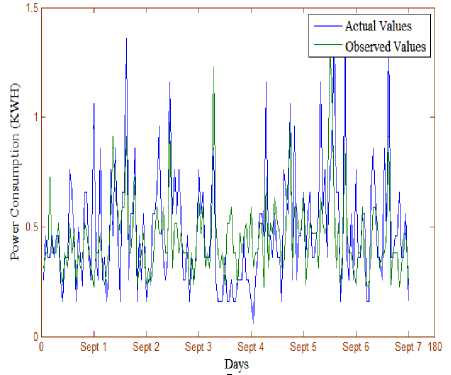
Fig.5. The Actual and the Predicted Values of Energy Consumption of a Single Apartment during one Week of the Month.
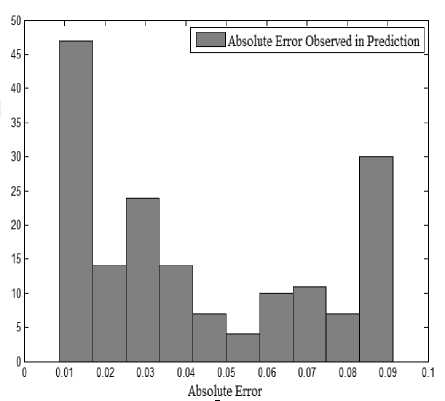
Fig.6. The Histogram of Absolute Error Observed in the Prediction of Energy Consumption of an Apartment during one Week of the Month.
In the next step, we have increased the number of days to 14 from 1st September to 14th September. The deviations in the actual and predicted values are represented in figure 7. The graph shows almost similar patterns as observed with the data of 7 days. If we consider the histogram of the same, it has shown improvements in the prediction as compared to the data of 4 days, and 7 days, the increase in the number of data samples directly affecting the performance of the MLP [28-29]. The absolute error in the prediction of energy consumption during 14 days of a month has been represented in figure 8. The error rate has also decreased as compared to the error rate observed with the data of 4 and 7 days. At the initial of the histogram comparatively higher error rate has been observed, the same can be improved with little modifications in the preprocessing of data.
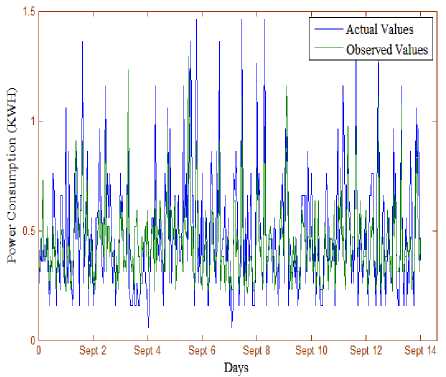
Fig.7. The Actual and the Predicted Values of Energy Consumption of a Single Apartment during two Weeks of the Month.
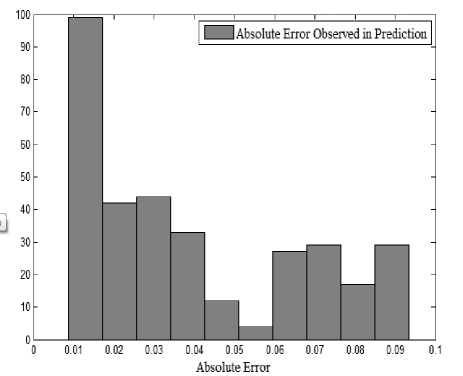
Fig.8. The Histogram of Absolute Error Observed in the Prediction of Energy Consumption of an Apartment during Two Weeks of the Month.
In the last step, we have increased the number of days to 28 from 1st September to 28th September. The deviations in the actual and predicted values are represented in figure 9. The graph shows improved patterns as observed with the data of 4, 7, and 14 days. The histogram of the same show, improvements in the prediction as compared to the data of 4, 7, and 14 days. The absolute error in the prediction of energy consumption during 28 days of a month has been represented in figure 10. The error rate has also decreased as compared to the error rate observed with the data of 4, 7 and 14 days.
If we conclude the overall performance of the system, then it is evident from the figures 3-10 that the error observed in actual and predicted energy consumption for the prediction of hourly consumption prediction is very less that shows the effectiveness of the proposed model. Further, the performance of the system gradually increased with the increase in the number of days if we increase the number of days to 56 days the performance of the model may increase further.
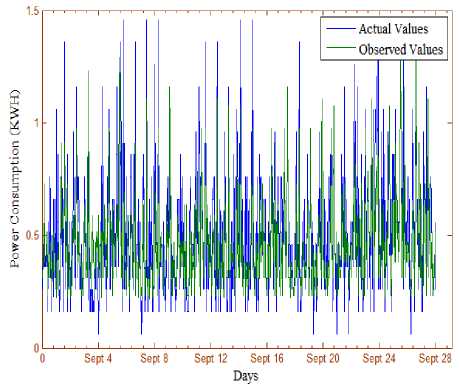
Fig.9. The Actual and Predicted Values of Energy Consumption of a Single Apartment during one Month.
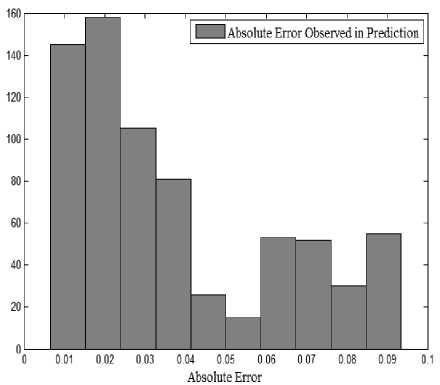
Fig.10. The Histogram of Absolute Error Observed in the Prediction of Energy Consumption of an Apartment during one Month.
-
VI. Conclusion
In this study, we have carried out hourly energy consumption prediction using Multi-Layer Perceptron. Extensive experimentation has been carried out with complex combinations of training algorithms, hidden layer transfer functions and output layer transfer functions. For hourly energy consumption prediction, different structures of Multi-Layer Perceptron were applied to real historical six weeks data (from September 1 to October 12, 2004) of ten residential buildings, which was divided into 60% training (6048 Samples) and 40%
testing (4032 Samples).
The performance of the models was assessed using Mean Square Error (MSE), Root Mean Square Error (RMSE) and Mean Absolute Error (MAE) [30]. A very complex relationship among the training functions of different models, hidden layer transfer functions, output layer transfer functions and the number of Neurons in the hidden layer can be observed.
After excessive experimentation, a final model was chosen in which we have used Scaled Conjugate Gradient as a network training function, tangent sigmoid as a hidden layer transfer function, the linear function in the output layer with 25 neurons in the hidden layer. After trials and errors on different types of training algorithms (trainscg, traincgp, trainlm), hidden layer transfer functions, output layer transfer functions (tansig, logsig, linear) and a different number of neurons in the hidden layer, various architectures of Multi-Layer Perceptron were trained and tested.
References Statistical Features Based Approach (SFBA) for Hourly Energy Consumption Prediction Using Neural Network
- F. Wahid, & D. H. Kim, "An efficient approach for energy consumption optimization and management in residential building using artificial bee colony and fuzzy logic," Mathematical Problems in Engineering, 1-13, 2016.
- Wahid, F., and D.H. Kim, "A Prediction Approach for Demand Analysis of Energy Consumption Using K-Nearest Neighbor in Residential Buildings," International Journal of Smart Home, vol. 10, no.2, pp. 97-108, 2016.
- T. Chow, G. Zhang, Z. Lin, and C. Song, "Global optimization of absorption chiller system by genetic algorithm and neural network," Energy and buildings, vol. 34, pp. 103-109, 2002.
- M. Kumar, N. Raghuwanshi, R. Singh, W. Wallender, and W. Pruitt, "Estimating evapotranspiration using artificial neural network," Journal of Irrigation and Drainage Engineering, vol. 128, pp. 224-233, 2002.
- A. Sozen, and M. A. Akcayol, "Modelling (using artificial neural-networks) the performance parameters of a solar-driven ejector-absorption cycle," Applied Energy, vol. 79, no.3, pp. 309-325, 2004.
- W. S. McCulloch, and W. Pitts, "A logical calculus of the ideas immanent in nervous activity," The bulletin of mathematical biophysics, vol. 5, no.4, pp. 115-133, 1943.
- K. P. Moustris, I. K. Larissi, P. T. Nastos, and A. G. Paliatsos, "Precipitation forecast using artificial neural networks in specific regions of Greece," Water resources management, vol. 25, no.8, pp. 1979-1993, 2011.
- S. Morid, V. Smakhtin, and K. Bagherzadeh, "Drought forecasting using artificial neural networks and time series of drought indices," International Journal of Climatology, vol. 27, no.15, pp. 2103-2111, 2007.
- M. Sahin, "Modelling of air temperature using remote sensing and artificial neural network in Turkey," Advances in Space Research, vol. 50, no.1, pp. 973-985, 2012.
- O. A.S. Carpinteiro, A. J.R. Reis, and A. P. DaSilva, "A hierarchical neural model in short-term load forecasting," Applied Soft Computing, vol. 4, no.4, pp. 405-412, 2004.
- G. Gross, and F. D. Galiana, "Short-term load forecasting," Proceedings of the IEEE, vol. 75, no.12, pp. 1558-1573, 1987.
- G. Irisarri, S.E. Widergren, and P.D. Yehsakul, "On-line load forecasting for energy control center application," IEEE Transactions on Power Apparatus and Systems, vol. PAS-101, no.1, pp. 71-78, 1982.
- S. Ali, and D. H. Kim, "Effective and comfortable power control model using Kalman filter for building energy management," Wireless personal communications, vol. 73, no.4, pp. 1439-1453, 2013.
- S. Ali, and D. H. Kim, "Optimized Power Control Methodology Using Genetic Algorithm," Wireless personal communications, vol.83, no.1, pp. 493-505, 2015.
- S. J. Kiartzis, A.G. Bakirtzis, J.B. Theocharis, and G. Tsagas, "A fuzzy expert system for peak load forecasting. Application to the Greek power system," in 2000. MELECON 2000. 10th Mediterranean, Electrotechnical Conference, pp. 1097-1100, 2000.
- V. Miranda, and C. U. Monteiro, "Fuzzy inference in spatial load forecasting," in Power Engineering Society Winter Meeting, IEEE, pp. 1063-1068, 2000.
- L. M. Saini, "Peak load forecasting using Bayesian regularization, Resilient and adaptive back propagation learning based artificial neural networks," Electric Power Systems Research, vol. 78, no.7, pp. 1302-1310, 2008.
- P. Lauret, E. Fock, R. N. Randrianarivony, and J. F. O. Manicom-Ramsamy, "Bayesian neural network approach to short time load forecasting," Energy conversion and management, vol. 49, no.5, pp. 1156-1166, 2008.
- S.J. Yao, Y.H. Song, L.Z. Zhang, and X.Y. Cheng, "Wavelet transform and neural networks for short-term electrical load forecasting," Energy conversion and management, vol. 41, no. 18, pp. 1975-1988, 2000.
- T. Nengling, J. R. Stenzel, and W. Hongxiao, "Techniques of applying wavelet transform into combined model for short-term load forecasting," Electric Power Systems Research, vol. 76, no. 6-7, pp. 525-533, 2006.
- M.R. Amin-Naseri, and A.R. Soroush, "Combined use of unsupervised and supervised learning for daily peak load forecasting," Energy conversion and management, vol. 49, no.6, pp. 1302-1308, 2008.
- A.G. Bakirtzis, J.B. Theocharis, S.J. Kiartzis, and K.J. Satsios, "Short term load forecasting using fuzzy neural networks," Power Systems, IEEE Transactions on, vol. 10, no.3, pp. 1518-1524, 1995.
- D. Srinivasan, C.S. Chang, and A.C. Liew, "Demand forecasting using fuzzy neural computation, with special emphasis on weekend and public holiday forecasting," IEEE Transactions on, Power Systems, vol. 10, no.4, pp. 1897-1903, 1995.
- T. P. Vogl, J.K. Mangis, A.K. Rigler, W.T. Zink, and D.L. Alkon, "Accelerating the convergence of the back-propagation method," Biological cybernetics, vol. 59, no.4, pp. 257-263, 1988.
- B. Karlik, and A. V. Olgac, "Performance analysis of various activation functions in generalized MLP architectures of neural networks," International Journal of Artificial Intelligence and Expert Systems, vol. 1, no.4, pp. 111-122, 2011.
- P. D. B. Harrington, "Sigmoid transfer functions in backpropagation neural networks," Analytical Chemistry, vol. 65, no.15, pp. 2167-2168, 1993.
- M. Åžahin, "Comparison of modelling ANN and ELM to estimate solar radiation over Turkey using NOAA satellite data," International journal of remote sensing, vol. 34, no.21, pp. 7508-7533, 2013.
- N. Mohammadi, and M. Zangeneh, "Customer Credit Risk Assessment using Artificial Neural Networks," International Journal of Information Technology and Computer Science, vol.8, no.3, pp.58-66, 2016.
- V.A. Olutayo, and A.A. Eludire, "Traffic Accident Analysis Using Decision Trees and Neural Networks", International Journal of Information Technology and Computer Science, vol.6, no.2, pp.22-28, 2014.
- F. Wahid, and D. H. Kim, "Prediction Methodology of Energy Consumption Based on Random Forest Classifier in Korean Residential Apartments," Advanced Science and Technology Letters, 120 (GST 2015): 684-687, 2015.
