Streamlining Stock Price Analysis: Hadoop Ecosystem for Machine Learning Models and Big Data Analytics

Author: Jesslyn Noverlita, Herison Surbakti
Journal: International Journal of Information Technology and Computer Science @ijitcs
Article in issue: 5 Vol. 15, 2023.
Free access
The rapid growth of data in various industries has led to the emergence of big data analytics as a vital component for extracting valuable insights and making informed decisions. However, analyzing such massive volumes of data poses significant challenges in terms of storage, processing, and analysis. In this context, the Hadoop ecosystem has gained substantial attention due to its ability to handle large-scale data processing and storage. Additionally, integrating machine learning models within this ecosystem allows for advanced analytics and predictive modeling. This article explores the potential of leveraging the Hadoop ecosystem to enhance big data analytics through the construction of machine learning models and the implementation of efficient data warehousing techniques. The proposed approach of optimizing stock price by constructing machine learning models and data warehousing empowers organizations to derive meaningful insights, optimize data processing, and make data-driven decisions efficiently.
Big Data Analytics, Hadoop Ecosystem, Machine Learning, Data Warehousing, Scalability, Distributed Processing, Predictive Modeling
Short address: https://sciup.org/15018948
IDR: 15018948 | DOI: 10.5815/ijitcs.2023.05.03
Text of the scientific article Streamlining Stock Price Analysis: Hadoop Ecosystem for Machine Learning Models and Big Data Analytics
The proliferation of data has transformed the way organizations operate. The ability to extract valuable insights from vast amounts of data has become a competitive advantage across industries. However, traditional data processing and analysis techniques are insufficient to handle the sheer volume, velocity, and variety of big data [1]. This necessitates the adoption of advanced technologies and frameworks, such as the Hadoop ecosystem, to overcome these challenges. In recent years, the prevalence of big data technology has revolutionized numerous industries, including retail, manufacturing, healthcare, and finance [2].
The utilization of big data has proven instrumental in enhancing operational efficiency by harnessing valuable insights derived from data analysis. This research paper focuses on investigating the application of big data analytics in the context of the stock market, utilizing a publicly available dataset sourced from The New York Stock Exchange (NYSE) [2, 3]. By leveraging big data analysis, organizations can identify trends, patterns, and correlations that enable informed decision-making processes. Particularly in the stock market, analysis plays a pivotal role for investors and traders in assessing a company's intrinsic value before executing buying or selling decisions. The present study incorporates two files containing the tabulated daily commodity rates of various company shares:
-
• Stock name
-
• Date
-
• Open price
-
• High price
-
• Low price
-
• Close price
-
• Volume
-
• Adjusted close price
-
• Stock name
-
• Date
-
• Dividend price
The New York Stock Exchange (NYSE) Hadoop Ecosystem
The widespread adoption and efficacy of big data technology is largely attributable to the evolution of multifarious frameworks and platforms that cater to the manipulation and scrutiny of colossal data sets. Apache Hadoop takes a preeminent position among these big data platforms, ingeniously amalgamating the powerful MapReduce paradigm and the durable Hadoop Distributed File System (HDFS) for proficient data governance [4]. This technology has been embraced ubiquitously across a myriad of sectors, empowering organizations to distil pertinent insights, thus refining their decision-making apparatus. A case in point is the New York Stock Exchange (NYSE) that has judiciously harnessed big data technology, with a particular emphasis on Apache Hadoop, to conduct in-depth analysis of market fluctuations and draw data-oriented verdicts, conferring upon them a competitive superiority. In parallel, Apache Spark has emerged on the scene as a sought-after big data framework, renowned for its expedited processing velocity and its superior versatility in handling data, thereby outpacing the capabilities of its counterpart, Apache Hadoop [5].
The New York Stock Exchange (NYSE) can harness the capabilities of Apache Hadoop’s MapReduce and Apache Spark frameworks to process and decipher vast quantities of financial data. As illustrated in Table 1, Spark offers superior processing speed and enhanced flexibility in data manipulation, rendering it a prime candidate for processing and analyzing real-time data pertinent to the financial sector, more specifically, within the ambit of stock exchanges. This proves particularly valuable in the dynamic realm of finance where instantaneous data insights are paramount to the decision-making process. In addition, Spark's fundamental component, the Resilient Distributed Dataset (RDD), presents an advantageous data processing approach within distributed systems, exhibiting higher efficiency and fault tolerance compared to MapReduce [6].
RDD programming can be employed for data transformations, including mapping and filtering, as well as operations like counting and collecting. Given its ability to be cached in-memory, RDD enhances data access efficiency. Consequently, Spark can confer a competitive edge to stock exchanges, such as the NYSE, requiring the capability to process and dissect voluminous real-time financial data in order to maintain their standing in the brisk-paced financial industry [7].
Table 1. Comparisons between MapReduce and spark
|
Criteria |
MapReduce |
Spark |
|
Data Processing |
Batch processing |
Both batch processing and real-time processing |
|
Memory Usage |
Disk-based storage |
In-memory |
|
Processing Speed |
Slower |
Faster |
|
Fault Tolerance |
Replication-based fault tolerance |
Resilient Distributed Datasets (RDD) |
|
Machine Learning Libraries |
Limited |
Built-in ML libraries (MLib, GraphX, MLflow) |
|
Streaming Processing |
Limited |
Built-in streaming libraries (Spark Streaming) |
In order to delve deeper into the application of big data processing in assisting the New York Stock Exchange (NYSE) in garnering insights from stock data and facilitating informed decision-making, two variants of descriptive analyses can be undertaken: time series analyses and the identification of the top 10 high-performing companies based on their stock performance. The employment of time series analysis can unearth discernible patterns and trends within the stock data over a specified duration [8]. This empowers NYSE to propose consistently superior-performing stocks to prospective investors, thus enabling more strategic investment decisions. Such an approach could potentially catalyze an increase in trading volume and, consequently, elevate revenue.
Figure 1 illustrates the application of Resilient Distributed Dataset (RDD) programming in generating a time series plot for the adjusted closing price [9]. The task of descriptive time series analysis can be proficiently executed by harnessing the capabilities of Spark, with a particular emphasis on RDD, which outpaces MapReduce in terms of data processing speed. Departing from the conventional approach employed by MapReduce that involves mapping keys and values, RDD employs tuples to associate the date with the adjusted closing price [10]. Subsequently, the data is aggregated on a monthly basis, employing a key reduction technique to consolidate the data.
-
# Convert each Line into a tuple of (date, adjusted_close_price)
data = data,map(lambda x: (datetime.strptime(x[l], ’%Y-%m-%d'), float(x[7])))
-
# Aggregate adjusted_cLose_price by month
aggdata = agg_data.reduceByKey(lambda x, y: x + y)
-
# Sort data by date
aggdata = agg_data.sortByKey()
-
# Convert RDD to Pandas DataFrame
df = df.toPandas()
-
# Plot adjusted close price (aggregated)
fig, ax = pit.subplots(figsize=(12, 8))
-
Fig.1. Python code to generate time series plot for adjusted
Conversely, the exercise of identifying the top 10 companies predicated on their stock performance can bestow invaluable insights into the entities demonstrating superior performance within the NYSE. This can magnetize a greater number of investors and equip them with the necessary information to make judicious decisions about investment portfolios. Figure 2 visually depicts the calculation of the triad of pivotal metrics employed for gauging stock performance, further illuminating this process.
-
# Calculate hey metrics
stock_data[ 1 daily returns' ] = stock_data[‘adjiisted_close_price' ] .pct_change()
stock_data['dividend_yield1] = stoek_data[ dividendprice"] / stock_cata['adjusted_close_price'] stock_data['cumulative_returns'] = (1 + stock_data[1daily_returns"]).cumprod() - 1
Fig.2. Python code to derive top 10 companies based on stock performance
2. Objectives and Background of Study
The crux of this analysis lies in assessing the cumulative returns of each company, with a focus on spotlighting the top 10 companies that exhibit the highest Return on Investment (ROI) in percentage terms. The calculation hinges on three cardinal metrics: daily returns, dividend yield, and cumulative returns. The dividend yield metric is a representation of the proportion of the company's dividend payout to the shareholder, relative to its stock price. In a parallel manner, daily returns are computed utilizing the adjusted closing price, akin to the time series analysis. The culmination of the calculation lies in determining the cumulative returns, which are derived via the utilization of daily returns and the 'cumprod' function. This function computes the cumulative product of daily returns over time, thereby enabling the quantification of the total percentage augmentation in investment value.
The application of these analytical methods to stock data can empower the New York Stock Exchange (NYSE) to form superior, data-driven resolutions and achieve a competitive edge in the brisk and dynamic realm of finance. As the discourse in this paper unfolds, it will shed light on potential enhancements that can be proposed to further refine these two analyses, thus enabling NYSE to extract more profound insights from stock data.
Opportunities exist for the enhancement of the NYSE's big data processing system, particularly through the implementation of a data warehouse for data storage and enhancement of analytical efficiency [11]. Rather than restricting analyses to a descriptive level, which merely presents the existing data, NYSE can elevate its analytical approach to predictive analytics. To this end, this paper will first recommend the deployment of a data warehouse for the storage of stock data, followed by an exploration into broadening the scope of analysis through the utilization of data mining techniques [12]. Within the Hadoop ecosystem, a range of tools exist for data warehousing and data mining. Nevertheless, this paper will draw a comparative study between two primary tools in these categories, namely, Apache Pig and Apache Hive.
Table 2. Comparisons between apache pig and apache hive
|
Criteria |
Apache Pig |
Apache Hive |
|
Type of programming models |
Procedural |
Declarative |
|
Query Language |
Pig Latin |
HiveQL |
|
Syntax |
Scripting |
SQL-like |
|
Loading Time |
More efficient than Hive |
Take more time |
|
Performance |
Slower (Suitable for complex transformation) |
Faster (Suitable for querying large dataset) |
|
Types of Data |
Structured, Unstructured, and Semistructured Data |
Structured and Semi-structured Data Note: it is not efficient to process semistructured data. |
|
Data Warehousing Capabilities |
||
|
Storage |
HDFS |
HDFS and HBase |
|
Data Partitioning |
Manual |
Automatic |
|
Data Indexing |
No |
Automatic |
|
Data Compression |
Custom Functions |
Automatic |
|
Data Mining Capabilities |
||
|
Built-in Functions |
Limited |
Extensive |
|
User Define Functions (UDFs) |
Yes |
Yes |
|
Support Machine Learning |
No |
With Extensions |
|
Streaming Data |
With Streaming Modules |
No |
Upon scrutinizing the merits and drawbacks of Apache Pig and Apache Hive, it becomes evident that each tool possesses its unique set of strengths and limitations. Apache Pig demonstrates superior efficacy when dealing with diverse data types and demands a quicker loading time [12, 13]. Conversely, Apache Hive shows an aptitude more in alignment with data warehousing. Features such as automated data partitioning, indexing, and compression bolster Hive's ability to efficiently store and process vast quantities of structured data. Moreover, Hive incorporates an extension library for machine learning, notably Hive-mall. This library, built atop Hive, provides user-defined functions for executing machine learning tasks like classification and regression using SQL-like syntax, making it particularly suitable and user-friendly for carrying out data mining tasks [14].
In the context of the NYSE, which exclusively demands structured data and greatly values scalability, Apache Hive emerges as the more practical choice. The declarative query syntax employed by Hive, bearing resemblance to SQL, renders it more user-friendly and easier to assimilate compared to Apache Pig's procedural query language [15]. Nonetheless, given its distinct advantages, Apache Pig can be deployed for carrying out data transformations prior to loading the data into Apache Hive. This strategy allows both tools to function synergistically and complement each other's capabilities.
When data mining operations are conducted employing a data warehouse, the preliminary analysis delineated in the previous section can be advanced to encompass time series forecasting. By instituting this enhancement, investors can base their buying and selling decisions on informed premises, thereby assisting companies in honing their investment strategies and risk management to aptly anticipate swings in stock prices. Apache Hive can be harnessed to store and preprocess the time series data, enabling feature extraction and data preparation for the construction of predictive models [13, 16]. The historical stock price data can be ordered systematically, enabling subsequent querying and analysis to generate time series forecasts via an array of techniques. Adopting this strategy will heighten the efficiency of processing and analyzing substantial volumes of time series data and improve the precision in predicting future stock prices.
Beyond time series forecasting, this paper also advocates for the classification of corporations within the NYSE based on stock performance, thereby discerning the investment-worthy entities from the less desirable ones. Apache Hive can serve as an instrumental tool to process and analyze vast quantities of stock market data, as well as undertake data preprocessing and feature engineering, both of which enhance the accuracy of the classification algorithm. Furthermore, Hive's support for distributed processing enables parallel data analysis, boosting the overall efficiency of the process. We proposed the star schema for data warehousing for stock market data to accommodate the improvement of the two initial analyses as shown in Figure 3.
The constructed data warehouse comprises two-dimension tables: 'Dimension Time' and 'Dimension Stock', along with one fact table, named 'Fact Stock Price'. The 'Dimension Time' table is expressly designed within the data warehouse to enable the creation of time series data, which subsequently facilitates time series forecasting. Additionally, several new measures are produced for the classification, serving as innovative metrics in evaluating the investment potential of a given stock company.
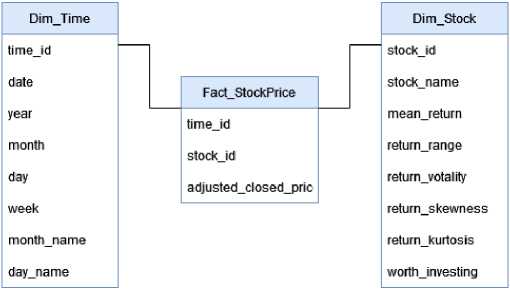
Fig.3. Proposed data warehouse schema
3. Materials and Methods
This paper introduces a machine learning pipeline tailored to carry out two key analyses: time series prediction and company classification based on investment potential, as depicted in Figure 4. The principal methodology employed within this paper integrates several significant phases: data ingestion, data preprocessing, feature extraction, data warehousing, and model development, with visualization as the ultimate goal. Figure 4 delineates the suggested machine learning pipeline designed to execute both time series predictive analytics and classification analysis.
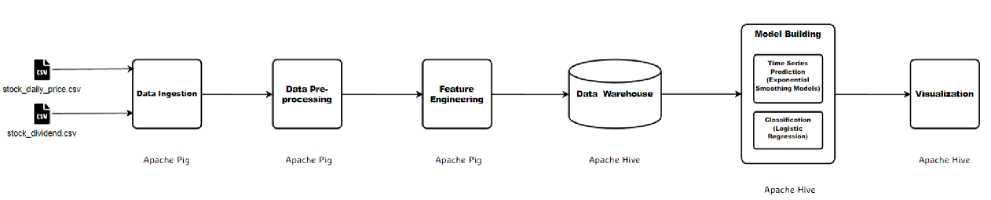
Fig.4. Machine learning pipeline
Data Ingestion : The initial step in executing the dual analyses involves data ingestion, wherein the data is compiled for processing in subsequent stages. The analyses will employ two datasets: stock_daily_price.csv and stock_dividend.csv. These datasets are loaded into Apache Pig, selected for its aptitude in data preprocessing.
Data Pre-processing : Following the loading of datasets into Apache Pig, the data is then pre-processed in alignment with the specific demands of the analyses. As indicated in Table 2, Apache Pig was selected for data preprocessing due to its proficiency in complex transformations and superior data loading speeds. This stage encompasses fundamental validation procedures such as checking for null values and duplicate entries. Additionally, data merging and manipulation take place to meet the schema requirements of the data warehouse. The 'Dimension Time' is generated during this phase, and the stock name is isolated into a separate dimension table, termed 'dim_stock'.
Feature Extraction : This stage aims to identify the appropriate features that are required for conducting the subsequent analyses. As Table 2 suggests, this process occurs within Apache Pig due to its advanced customization capabilities for data manipulation techniques, significantly aiding the feature extraction phase. During this stage, several new metrics that can gauge the stock performance are created.
Data Warehousing : Upon appropriate processing, the data will be loaded into a data warehouse deployed within Apache Hive. The construction of the data warehouse adheres to the schema illustrated in Figure 3. Apache Hive emerges as the preferred choice for data warehousing due to its SQL-like declarative query language, which enables efficient execution of Online Analytical Processing (OLAP) queries. At this stage, the fact and dimension tables will serve as foundational data sources, ultimately facilitating subsequent analyses.
Model Construction: In this research paper, we propose two primary types of analyses for enhancing big data analytics: time series prediction and classification. For time series prediction, we will employ the Exponential Smoothing Model, a widely utilized algorithm known for its simplicity and effectiveness in time series analysis. This algorithm provides powerful predictive capabilities while being computationally efficient, making it an ideal choice for stock prediction analysis. On the other hand, for classification tasks, we will employ Logistic Regression, a well-established algorithm suitable for binary outcomes and multi-variable predictors, which aligns with the classification objectives for the NYSE dataset. Logistic Regression has demonstrated a high accuracy rate in predicting stock performance. To conduct these analyses, we will leverage Apache Hive, a powerful platform capable of implementing machine learning algorithms through external libraries, as highlighted in Table 2.
Visualization : The ultimate objective of these analyses is visualization. The purpose of visualization is to make sense of the analytical results, simplifying their comprehension. Apache Hive will be employed for visualization tasks, given the ease it offers in querying data from the data warehouse. Moreover, since model development also takes place within Apache Hive, it's considerably more practical to undertake both operations within the same platform.
There are multiple metrics to assess stock performance, particularly the returns they generate. In terms of price, the 'adjusted close price' is considered more accurate than an average, as it accounts for stock dividends, thereby representing the net price of the stock after dividend distribution. Subsequently, 'daily return' is also taken into account, calculated using the logarithmic function of both closing and opening prices. Following this, a series of statistical measures are performed to generate new metrics, as depicted in Figure 5. By the end of this stage, five new measurements and one indicator variable are generated, which acts as an identifier of a company's investment worthiness. Figure 5 below presents the computation of statistical measurements serving as potential features for the analyses.
-
-- Compute various statistics for each stock
statistics = FOREACH grouped_data GENERATE group AS stock_name,
AVG(merged_data.daily_return) AS mean_return, STO(merged_data.daily_return) AS std_return, MIN(merged_data.daily_return) AS min_return, MAX(merged_data.daily_return) AS max_return, COUNT(merged_data.daily_return) AS num_returns, SUM(merged_data.dividend_price) AS total_dividends, COUNT(merged_data.dividend_price) AS num_dividends, MIN(merged_data.open_price) AS start_price, MAX(merged_data.close_price) AS end_price;
-
-- Compute additional features
statistics - FOREACH statistics GENERATE stock_name, max_return - min_return AS return_range, std_return / mean_return AS return_volatility, (double)MERGE(merged_data.daily_return) AS daily_return_bag;
Fig.5. Feature extraction code in Apache pig
4. Results and Discussion
Primarily, the initial section of this paper presents two descriptive analyses. The first analysis concentrates on the utilization of RDD programming to execute fundamental data transformations, while leveraging in-memory data processing. The outcomes of these analyses are detailed in Figures 6 and 7. Figure 6 depicts the stock price fluctuations over the first 10 years, displaying significant volatility followed by a sharp decline in mid-1982, eventually stabilizing until 2010. Conversely, Figure 7 presents a bar chart showcasing the top 10 companies with the highest cumulative return, computed using the formula illustrated in Figure 2.
After conducting the descriptive analyses, a data warehouse was proposed to elevate the analysis through the incorporation of data mining techniques. Specifically, time series prediction and classification were employed to construct prediction models for stocks, empowering investors to make more informed purchasing decisions. The predicted results are showcased in Figures 8 and 9. Figure 8 illustrates the one-year prediction, revealing a modest increase in the average stock price over the upcoming year. This insight enables potential investors to identify opportune moments for stock purchase or sale, both at the beginning and towards the end of the year. On the other hand, Figure 9 demonstrates the classification achieved using logistic regression. This model leverages metrics such as mean_return, return_range, return_volatility, return_skewness, and return_kurtosis to predict the investment worthiness of a company. The closer the results are to 1, the more promising the company is deemed for investment purposes.
Evaluating the machine learning pipeline employed in these analyses, the primary tools utilized are Apache Pig and Apache Hive. Both of these tools are built on top of MapReduce, utilizing the MapReduce API for parallel data processing. The utilization of these tools offers convenience compared to developing complex Java MapReduce programs, showcasing the advantages of using APIs. When executing a Pig script or Hive query, a MapReduce job is triggered to complete the process. Thus, the seamless transition between the use of MapReduce API in these analyses is noteworthy.
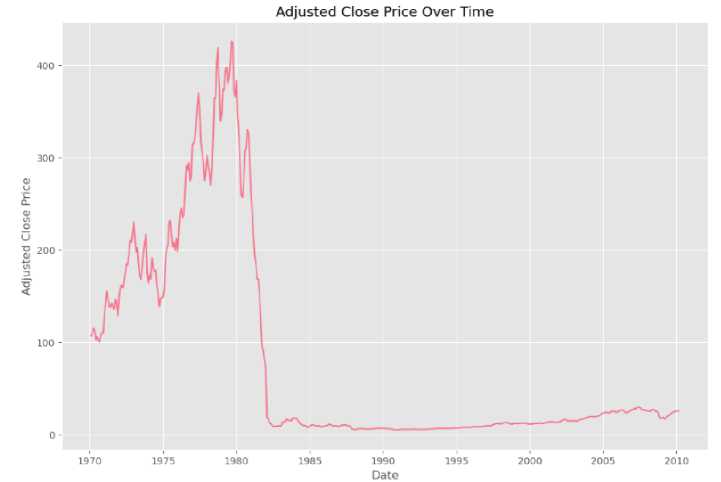
Fig.6. Descriptive time series analysis for adjusted close price
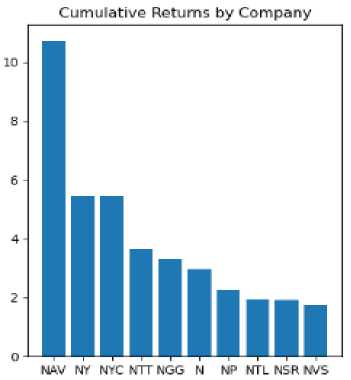
Fig.7. Top 10 companies based on stock performance
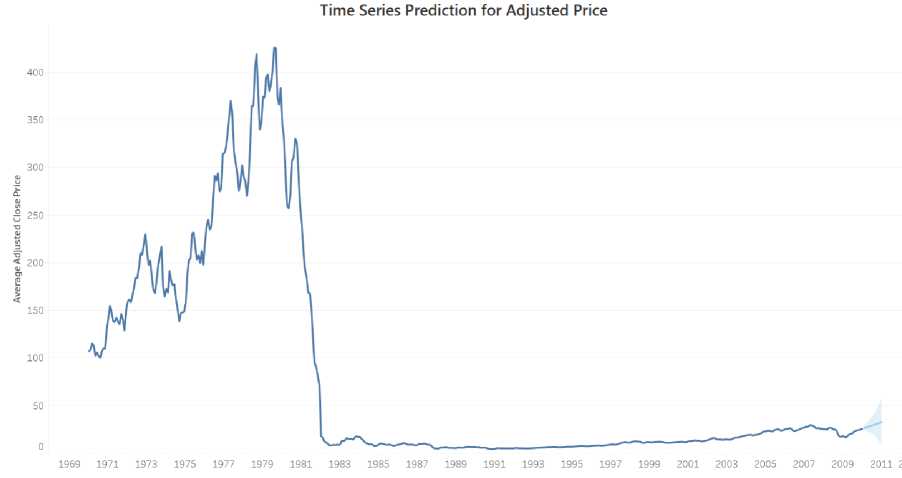
Fig.8. Time series prediction
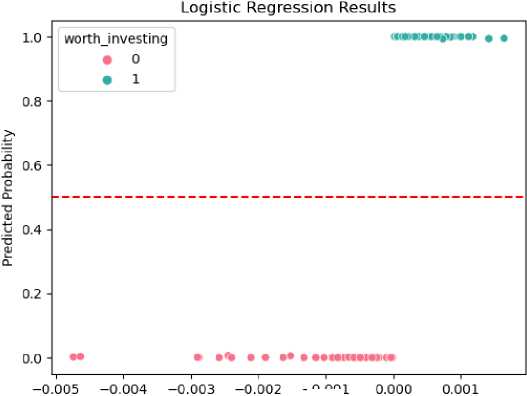
Worth investing = -1.31435801 + 8.34771646e-05 ineanreturn -
1.810350310-03 returnrange + 5.09231465e-01 returnvolatility +
4.26222407e-02 return skewness + 4.217455716-02 return kurtosis
-0.001
Mean Return
-
Fig.9. Logistic regression classification
Furthermore, as mentioned, Apache Pig and Apache Hive encompass overlapping features, such as data preprocessing. Not all tasks conducted with Apache Pig in these analyses are indispensable, as they can also be accomplished using Apache Hive. For instance, there is no need to create a new dataset consisting of the fact table when it can be achieved using HiveQL. To further refine the pipeline employed in this paper, all three initial phases can be performed using Apache Hive instead of Apache Pig. This modification is feasible since Apache Hive is also built on top of MapReduce, enabling it to process data in a manner similar to Apache Pig. Another essential API utilized in the analyses is RDD, categorized as a low-level API. RDD offers a more flexible programming model for distributed computing; however, it necessitates greater manual management from the programmer. While RDD provides fault tolerance, it is more intricate to write, as evident from the code snippet in Figure 1.
On the other hand, DataFrames serve as an alternative programming API, representing an extended model of RDD. In contrast to RDD, DataFrames present a more user-friendly programming syntax for data processing, organizing the data into tabular structures akin to relational databases. Leveraging DataFrames in these analyses can simplify the programming tasks while still capitalizing on the efficient data processing capabilities offered by Spark. This is because the analyses proposed in this paper are relatively less complex and can be effectively managed using DataFrames, mirroring the functionality observed in Hive. Conversely, RDD is better suited for intricate analyses that require complex machine learning algorithms. Figure 10 illustrates the aggregation of adjusted close prices using DataFrames. This code achieves the same outcome as depicted in Figure 1, while the syntax employed in RDD appears more complex. The simplicity afforded by DataFrames demonstrates their superiority in handling such tasks.
Fig.10. Aggregating adjusted close price using data frame in spark
5. Conclusions
To summarize, this paper commenced by comparing MapReduce and Spark, reaching the conclusion that Spark is better suited for processing real-time data, leveraging replicated-based fault-tolerant processing through RDD. Considering the context of the NYSE, where financial data is time-sensitive and requires real-time analysis, Spark emerges as the more appropriate choice. Subsequently, two descriptive analyses were conducted: time series analysis and identification of the top 10 companies based on stock performance. These analyses aim to enhance the NYSE's understanding of trends within their stock data and assist potential investors in making informed purchasing decisions.
Subsequently, the paper proposes the implementation of a data warehouse utilizing Apache Pig and Apache Hive for data mining purposes. This expansion of the analysis’s entails transitioning from descriptive to predictive analyses, encompassing time series prediction and the classification of companies based on investment worthiness. Section 3 outlines a machine learning pipeline that capitalizes on both Apache Pig and Apache Hive as the primary processing tools. The paper also delves into different APIs employed in the analyses, including the MapReduce API utilized in both Apache Pig and Apache Hive, as well as RDD in Apache Spark. The effectiveness of the proposed pipeline is evaluated in the final section, demonstrating that Apache Hive alone is sufficient to perform the entire spectrum of machine learning tasks, rendering the generation of a new dataset using Apache Pig unnecessary. Furthermore, it is suggested that leveraging RDD for the descriptive analyses proves inefficient due to the complexity involved in the process. Instead, employing a higher-level API such as data frames can streamline the process while still reaping the benefits offered by Spark.
References Streamlining Stock Price Analysis: Hadoop Ecosystem for Machine Learning Models and Big Data Analytics
- J. C. Urenda and V. Kreinovich, “Data Processing: Beyond Traditional Techniques,” Studies in Big Data, pp. 225–242, 2022, doi: 10.1007/978-3-031-16780-5_37.
- V. Goswami, P. Jadav, and S. K. Soni, “Review on How IIoT Has Revolutionized Greenhouse, Manufacturing and Medical Industries,” Recent Advances in Mechanical Infrastructure, pp. 179–192, 2022, doi: 10.1007/978-981-16-7660-4_16.
- T. W. de Wit and V. Menon, “Informed Trading Support for the Amateur Investoron the New York Stock Exchange,” 2019 IEEE International Conference on Big Data (Big Data), Dec. 2019, Published, doi: 10.1109/bigdata47090.2019.9006544.
- D. Veeraiah and J. N. Rao, “An Efficient Data Duplication System based on Hadoop Distributed File System,” 2020 International Conference on Inventive Computation Technologies (ICICT), Feb. 2020, Published, doi: 10.1109/icict48043.2020.9112567.
- M. Fotache, M.-I. Cluci, and V. Greavu-Şerban, “Low Cost Big Data Solutions: The Case of Apache Spark on Beowulf Clusters,” Proceedings of the 5th International Conference on Internet of Things, Big Data and Security, 2020, Published, doi: 10.5220/0009407903270334.
- N. Nway Nway, J. Myint, and E. Chaw Htoon, “Evaluating Checkpoint Interval for Fault-Tolerance in MapReduce,” 2018 International Conference on Cyber-Enabled Distributed Computing and Knowledge Discovery (CyberC), Oct. 2018, Published, doi: 10.1109/cyberc.2018.00046.
- K. Wendt, “Traditional Stock Exchanges,” Social Stock Exchanges, pp. 61–76, 2022, doi: 10.1007/978-3-030-99720-5_3.
- M. Kulkarni, A. Jadha, and D. Dhingra, “Time Series Data Analysis for Stock Market Prediction,” SSRN Electronic Journal, 2020, Published, doi: 10.2139/ssrn.3563111.
- S. Narayanan, P. Samuel, and M. Chacko, “Improving prediction with enhanced Distributed Memory-based Resilient Dataset Filter,” Journal of Big Data, vol. 7, no. 1, Feb. 2020, doi: 10.1186/s40537-020-00292-y.
- P. Singh, S. Singh, P. K. Mishra, and R. Garg, “RDD-Eclat: Approaches to Parallelize Eclat Algorithm on Spark RDD Framework,” Second International Conference on Computer Networks and Communication Technologies, pp. 755–768, 2020, doi: 10.1007/978-3-030-37051-0_85.
- K. Rubulis, J. Vempers, and E. Žeiris, “Development of Framework for Designing an Analytical Data Warehouse: Case of e-Municipalities,” Proceedings of the 12th International Joint Conference on Knowledge Discovery, Knowledge Engineering and Knowledge Management, 2020, Published, doi: 10.5220/0010056001610171.
- H. Surbakti and A. Ta’a, “Cognitive Approach Using SFL Theory in Capt uring Tacit Knowledge in Business Intelligence,” 2019 International Conference on Data and Software Engineering (ICoDSE), Nov. 2019, Published, doi: 10.1109/icodse48700.2019.9092615.
- Y. K. Gupta and T. Mittal, “Comparative Study of Apache Pig & Apache Cassandra in Hadoop Distributed Environment,” 2020 4th International Conference on Electronics, Communication and Aerospace Technology (ICECA), Nov. 2020, Published, doi: 10.1109/iceca49313.2020.9297532.
- U. P. K. Dr. K and Dr. L. R. Bhavanam, “Usage of HIVE Tool in Hadoop ECO System with Loading Data and User Defined Functions,” International Journal of Psychosocial Rehabilitation, vol. 24, no. 04, pp. 1058–1062, Feb. 2020, doi: 10.37200/ijpr/v24i4/pr201080.
- E. Elliott, “Spark SQL and Hive Tables,” Introducing .NET for Apache Spark, pp. 107–118, 2021, doi: 10.1007/978-1-4842-6992-3_6.
- P. Konagala, “Big Data Analytics Using Apache Hive to Analyze Health Data,” Research Anthology on Big Data Analytics, Architectures, and Applications, pp. 979–992, 2022, doi: 10.4018/978-1-6684-3662-2.ch046.
