Stress-strain properties of polymer-based composite materials according to experimental evidence

Author: Piskunov A.A., Lukankin S.A., Petropavlovskikh O.K., Sharipov A.M., Ibragimova A.A.
Journal: Nanotechnologies in Construction: A Scientific Internet-Journal @nanobuild-en
Section: The results of the specialists’ and scientists’ researches
Article in issue: 1 Vol.18, 2026.
Free access
Introduction. The use of polymer composites as structural materials for bridge superstructures represents a promising area for scientific research and development, particularly in challenging climatic and geological engineering conditions. The use of polymer composites as structural materials for bridge superstructures represents a promising area for scientific research and development, particularly in challenging climatic and geological engineering conditions. The aim of the work is to identify methods for increasing the efficiency of using polymer composite materials in bridge span structures based on the study of their physico-mechanical characteristics as part of experimental studies. Methods and materials. The relevance of this research stems from the need to develop a structurally similar model of a bridge superstructure made of polymer composite materials that meets modern stability and safety requirements, thereby facilitating infrastructure development in remote northern regions. The variety of fibers, matrix materials and reinforcement schemes used in the creation of polymer composite structures makes it possible to control characteristics such as strength, rigidity, operating temperature and other physical and mechanical properties of materials. Results and Discussion. The study included a brief overview of the components of polymer composite materials and the development of a testing program, which led to the production and testing of a batch of flat samples using domestically produced materials. Selecting the composition, adjusting the component ratios and improving the composite's macrostructure allows for optimal performance characteristics depending on the requirements. Conclusion. Tests of flat FRP samples aimed at determining the values of their physico-mechanical, strength and deformation characteristics have been carried out. The test results obtained for FRP are comparable to those of traditional structural materials. The expediency of using fiberglass in highly loaded structural elements is substantiated, which demonstrates the potential for developing a bridge superstructure design from FRP. The prospects for further research based on computational and experimental analysis of nodal connections of elements from FRP are outlined.
Polymer composite material, static testing, filler, reinforcing fiber, matrix, binder, bridge, bridge structure, superstructure
Short address: https://sciup.org/142247069
IDR: 142247069 | DOI: 10.15828/2075-8545-2026-18-1-54-67
Text of the scientific article Stress-strain properties of polymer-based composite materials according to experimental evidence
Original article
Пискунов А.А., Луканкин С.А., Петропавловских О.К., Шарипов А.М., Ибрагимова А.А. Физико-механические характеристики композитных материалов на основе полимеров по экспериментальным данным. Нанотехнологии в строительстве. 2026;18(1):54–67. – EDN: TPGTYO.
According to the Transport Strategy of the Russian Federation [1], the development of railways, highways and transport infrastructure is necessary to improve the accessibility of regions, particularly remote and Arctic ter- ritories [2, 3, 4, 5]. The introduction of polymer-based composite materials in various sectors of the national economy is determined by the National Project [6], the purpose of which is to develop the production and use of polymer composite materials and products made from them.
Nanotechnologies in construction
Нанотехнологии в строительстве
2026; 18 (1):
54–67
Nanob
THE RESULTS OF THE SPECIALISTS’ AND SCIENTISTS’ RESEARCHES
Bridge superstructures made of fiber reinforced plastics (FRP) are a relevant engineering solution, the development of which requires scientific research to analyze technical, technological, and operational issues affecting the safety and operational reliability of bridge structures [7, 8, 9].
In the Far North, bridge structures are exposed to low temperatures [10]. Compared to traditional structural materials, the use of polymer composites in bridge construction under extreme conditions offers several advantages. These structures provide high strength, corrosion resistance, dielectric properties and the ability to operate in challenging climatic conditions [11, 12, 13]. Superstructures made of polymer composites are lighter than those constructed from traditional materials, reducing foundation loads [14].
Tests were conducted to determine the elastic and strength physical and mechanical properties of the FRP. For each type of test, samples were made from domestically produced components, with the filler made from different types of fiberglass and polyurethane, epoxy, and film matrices used as binders. The number of layers and the angle of placement of the reinforcing fibers in the samples varied, allowing for optimization of the physical and mechanical properties of the materials.
METHODS AND MATERIALS
The main characteristic of fiber composite materials is the controlled anisotropy of mechanical properties along and across the fibers, which is achieved by changing the laying angles of the reinforcing fibers [15]. As an example, Table 1 shows the anisotropy of the KMU-3 composite material, which contains carbon fiber and an epoxy resinbased binder (Table 1).
Cross-stacking of monolayers helps to reduce the anisotropy of the material, decreasing the sensitivity to stress concentrations in the plane of layer stacking.
Figure 1 shows a graph illustrating changes in the tensile modulus E and the shear modulus G depending on the reinforcement angle for unidirectional fiberglass SK-5-211, which consists of T-25 fiber-glass cloth and 5-211B epoxy binder.
FRP consists of a filler and a matrix: the filler is a reinforcing element that provides the necessary physical and mechanical properties of the material and the matrix is a binder that regulates the joint work of the reinforcing elements.
Matrix materials absorb the stress generated in the composite under the influence of external loads [16, 17]. Fibers provide rigidity and strength to the material in the direction of their orientation [18, 19]. The interaction between the matrix and fiber in FRPs occurs at several levels. Adhesive interactions occur at the molecular level [20]. The interaction between the matrix and the fiber occurs at the microscopic level and at the macroscopic level the interaction is expressed in the distribution of loads [21].
The filler influences the formation of the main characteristics of FRPs, especially their strength properties. The theoretical strength of materials σм increases with the elastic modulus Е and the surface energy γ of the substance and decreases with increasing distance between adjacent atomic planes α0 [22]:
σм = (γ Е /α0)1/2. (1)
Thus, high-strength solids must have a high modulus of elasticity, significant surface energy and the highest possible number of atoms per unit volume. Beryllium, boron, carbon, nitrogen, oxygen, aluminum and silicon satisfy these criteria. Glass, carbon, boron, and organic fibers are used to create high-modulus fiber-reinforced polymer composite materials. Fibers and whiskers of a number of carbides, oxides, nitrides and other compounds are also used. The most commonly used polymer composite materials in bridge construction are carbon fiber reinforced plastic and fiberglass [23].
The main types of inorganic reinforcing fibers are glass fibers and glass threads. The use of inorganic fibers for the production of polymer composite materials is due to their fire resistance and resistance to aggressive environments [24].
Carbon fibers are brittle materials, so the textile structures required for reinforcement are manufactured using three types of precursor fibers: polyacrylonitrile, viscose
Table 1. Anisotropy of the properties of the polymer composite material KMU-3
|
Properties of carbon fiber reinforced plastics, kgf/mm2 |
Reinforcement angle |
||
|
[0] |
[0, 90, ±45] |
[0, 90] |
|
|
σx+ |
80 |
30 |
50 |
|
σx– |
75 |
50 |
42 |
|
τ xy |
7 |
12 |
8 |
|
Е x |
14 000 |
5400 |
7000 |
|
G xy |
600 |
1750 |
700–800 |
Nanotechnologies in construction
Нанотехнологии в строительстве
2026; 18 (1):
54–67
Nanob

THE RESULTS OF THE SPECIALISTS’ AND SCIENTISTS’ RESEARCHES
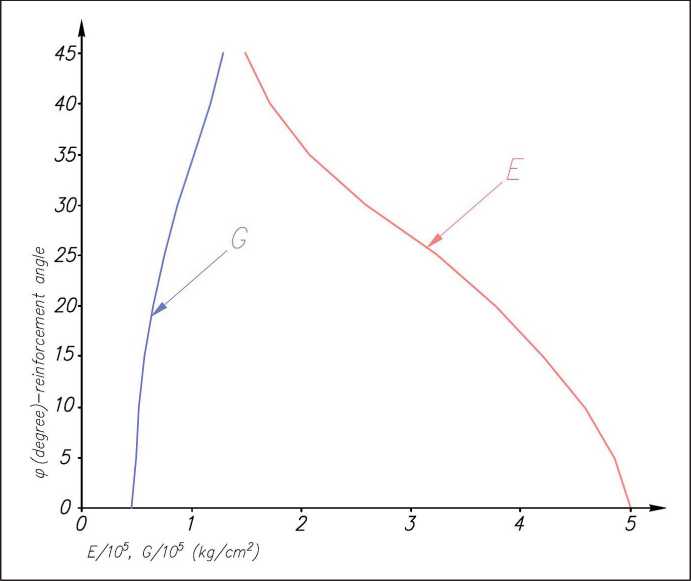
Fig. 1. Change in the elastic modulus E and shear modulus G depending on the reinforcement angle for fiberglass SK-5-211
and pitch (obtained from petroleum and coal tar pitches) [25, 26]. Carbon fibers are characterized by high heat resistance, flame retardancy and resistance to chemical influences [27, 28].
Reinforcing components in composite materials can be presented in various forms, such as monofilaments, twisted threads, tows, meshes, fabrics, tapes, canvases, etc. One of the most common reinforcing components for PCM are fabrics. They can vary in fiber type, weaving method and intended purpose. A single fabric can use different combinations of fiber types, materials and weaving methods. Non-woven fibrous fillers include various types of non-woven, tangled, dissected and unoriented fibers, which can be presented in the form of individual strands, webs, mats, non-woven meshes, veils, paper, cardboard, etc.
The selection of the matrix and the analysis of its applicability in structures are carried out individually, taking into account the rheological properties of the material and the properties associated with the features of the structure formation processes: glass transition, crystallization and hardening.
There are two main classes of binders used as a binding material: thermoplastic (harden when cooled) and thermosetting (harden as a result of a chemical reaction) [29].
The most common thermoplastics based on carbon-chain polymers include polyethylene, polypropylene, polyvinyl chloride, polystyrene and polyacrylates [30].
Thermosets are divided into categories depending on the base used: phenolic plastics (based on phenolformaldehyde resins); aminoplasts (based on melamine and urea-formaldehyde resins); ester plastics (based on polyester resins); epoxy plastics (based on epoxy resins).
Polyester and epoxy resins are used as binders for polymer composite structures. Epoxy resins are stronger than polyester resins, but they are also more rigid and brittle. Epoxy resins are characterized by strength, heat resistance and good adhesion to reinforcing fibers among all thermosetting plastics, which makes them preferable for the manufacture of products subject to high loads [30].
To conduct the tests, sets of samples were made from domestically produced materials based on T10 and T25 fiberglass fabrics. The following matrix materials were used: VK-51 film adhesive, L285 and ED20 epoxy resins, Huntsman polyurethane binder and XT118 epoxy composition. During the study, static tests of FRP samples were conducted for tension, compression, shear in the sheet plane and interlayer shear in order to select the optimal combination of structural materials in accordance with current GOST requirements.
The object of the study is samples for each “fillermatrix” combination, obtained by cutting from flat monolithic panels manufactured by vacuum forming (cold laying). In total, more than 400 dry samples (RTD) were tested under normal climatic conditions (23±5)°C in accordance with GOST 12423-2013.
RESULTS AND DISCUSSION
Tensile testing
The tests were carried out under normal room temperature conditions on a testing machine that provided stretching of the sample at a given constant speed of movement of the active grip (Fig. 2). Figure 3 shows
Nanotechnologies in construction
Нанотехнологии в строительстве
2026; 18 (1):
54–67
THE RESULTS OF THE SPECIALISTS’ AND SCIENTISTS’ RESEARCHES
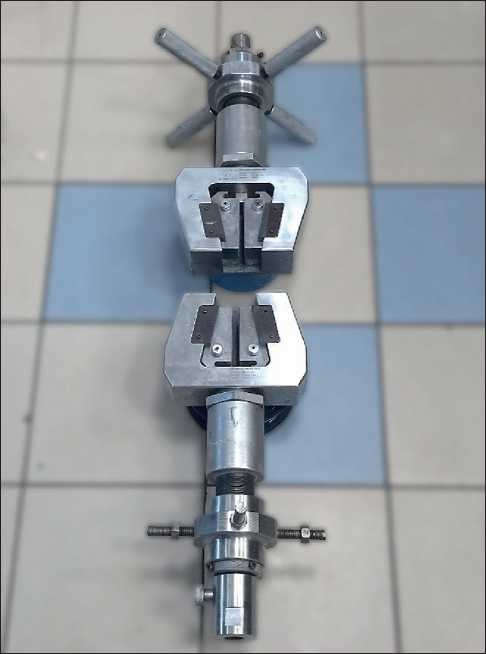
Fig. 2. The appearance of the grippers for tensile testing a photo illustration of FRP samples before and after tensile testing.
It follows from the graph (Fig. 4) that at the initial stage there is a linear relationship between load and deformation, the material withstands loads. As the load increases, the curve begins to bend, indicating the onset of plastic deformation. Further, the curves have similar outlines until the strength limit is reached, which indicates the homogeneity of the properties of the samples during testing. After reaching the maximum load, a decrease in load is observed, which indicates the onset of destruction of the sample through displacement of fibers or damage to the matrix.
The graph (Fig. 5) shows the relationship between stress and strain. At low strain values, a linear section is observed where the material behaves elastically. This indicates that the stress is proportional to the strain and corresponds to Hooke’s law. A significant increase in stress indicates the onset of plastic deformation. At stresses from 400 to 550 MPa, changes occur due to the achievement of the limiting state and the destruction of the material.
The tensile test results of the FRP samples are shown in Table 2. Fiberglass-based polymer composite materials have demonstrated diversity in the value of the perceived maximum load during tensile testing. According to the
Nanob
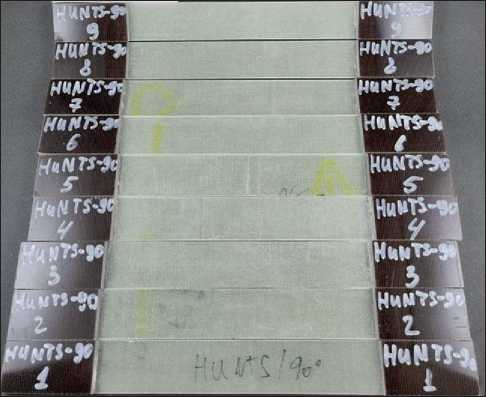
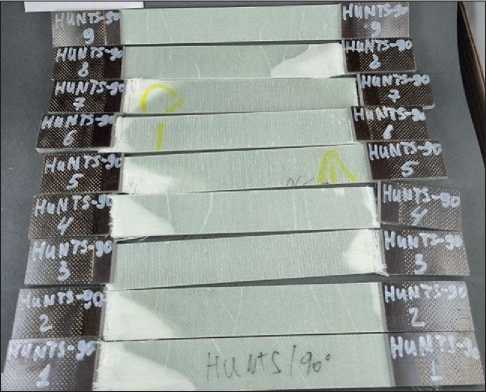
Fig. 3. Photo illustration of FRP samples based on T-10 fiberglass and Huntsman binder, reinforcement direction 90° before and after tensile tests
test results, the tensile strength of FRP samples can reach 621.9 MPa, which is comparable to the characteristics of traditional materials. Samples with T10 filler, reinforced at an angle of 0°, demonstrate the highest values of tensile strength based on VK-51 film adhesive and XT118 and ED20 epoxy resins. However, for samples with T25 filler and a similar VK-51 matrix, a lower tensile strength is provided. The best results are achieved with combinations with a reinforcement angle of 0°, while the opposite effect is achieved with combinations with a reinforcement direction of 45°.
Compression tests
The essence of the method is to test FRP samples for compression at a constant rate of deformation, while the sample is installed in the tooling of the testing machine so that the longitudinal axes of the grippers and the sample
Nanotechnologies in construction
Нанотехнологии в строительстве
2026; 18 (1):
54–67
Nanob
THE RESULTS OF THE SPECIALISTS’ AND SCIENTISTS’ RESEARCHES
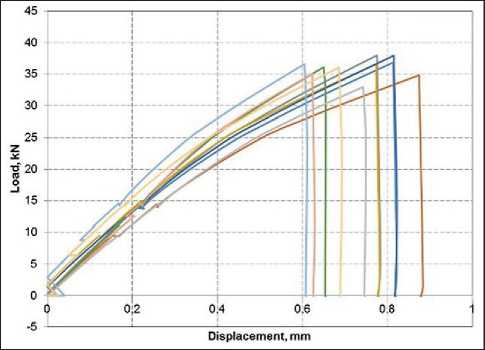
Fig. 4. Graph of the dependence of displacement on load during tensile testing of FRP samples based on T-25 glass fabric and VK-51 binder, reinforcement direction 0°
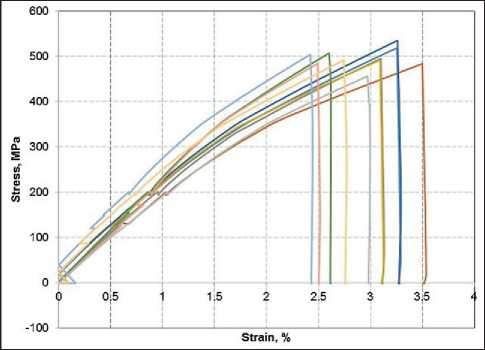
Fig. 5. Graph of the stress-strain state during tensile testing of FRP samples based on fiberglass T-25 and binder VK-51, reinforcement direction 0°
Table 2. Results of tensile testing of samples
A photo illustration of polymer composite material samples before and after compression tests is shown in Figure 6.
Table 3 shows the results of compression testing of samples from FRP. The compressive strength ranges from 146.7 MPa to 341.6 MPa. Similar to the tensile test results, samples with a reinforcement angle of 0° have the highest values, which may indicate optimal reinforcement of the material in this direction. Combinations with reinforcement angles of 90° and 45° show a decrease in strength.
Shear tests in the plane
The test method consists in stretching a sample with V-shaped incisions fixed in two grips in such a way that the working area of the sample between the tops of the incisions is parallel to the loading axis, which ensures the creation of shear deformations in the sample. Each half of the device consists of a gripper and two gas-insulated jaws. Three bolts create a clamping force on each sponge to fix the sample under load (Fig. 7).
Photographs of samples tested for shear in the plane of the sheet are shown in Figure 8.
Nanotechnologies in construction
Нанотехнологии в строительстве
2026; 18 (1):
54–67
Nanob
THE RESULTS OF THE SPECIALISTS’ AND SCIENTISTS’ RESEARCHES
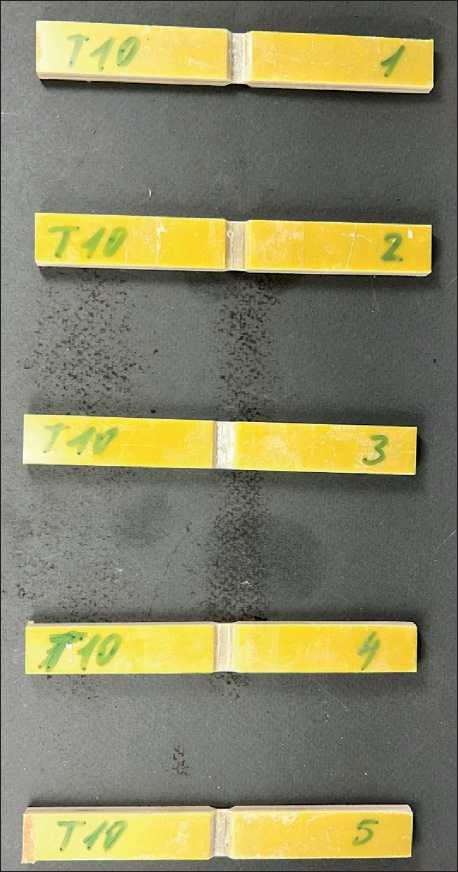
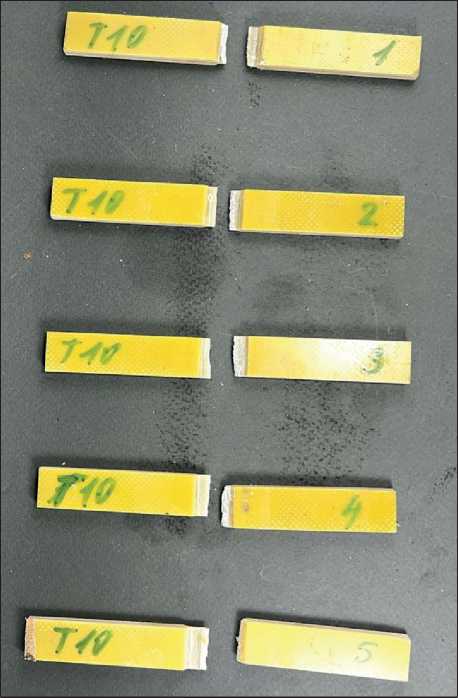
Fig. 6. Photo illustration of FRP samples based on T-10 fiberglass and VK-51 binder, quasi-isotropic reinforcement direction before and after compression tests
Table 3. Compression test results of the samples
|
No. |
Filler, direction of reinforcement |
Binder |
Width, mm |
Thickness, mm |
Max. load, kN |
Compressive strength, MPa |
|
1 |
Т10, 0º |
VK-51 |
14.870 |
1.417 |
7.101 |
341.596 |
|
2 |
Т10, 90º |
VK-51 |
14.980 |
1.403 |
4.681 |
223.384 |
|
3 |
Т10, 45º |
VK-51 |
15.051 |
1.375 |
3.021 |
146.723 |
|
4 |
Т10, quasi -isotropic |
VK-51 |
14.987 |
1.194 |
4.654 |
260.099 |
|
5 |
Т25, 0º |
VK-51 |
15.560 |
1.615 |
9.119 |
362.737 |
It follows from the graph (Fig. 9) that at the first stages of testing, all samples show a linear increase in load with increasing displacement. When the graph moves to the plastic region, each sample reaches its maximum load value. Then a plateau is observed – the samples withstand a given load, but show differences in strength and resistance to constant shear. Subsequently, the graph lines tend sharply downward, indicating the limiting state of the material.
At the beginning of the tests under low loads, the samples exhibit linear elastic deformation. Then most of the samples reach their maximum load, after which a sharp decrease begins, indicating destruction (Fig. 10).
The graph (Fig. 11) shows elastic deformations at the initial stage of the test, after which the transition to plastic deformation occurs. Differences in the maximum load values and displacement between samples emphasize
Nanotechnologies in construction
Нанотехнологии в строительстве
2026; 18 (1):
54–67
THE RESULTS OF THE SPECIALISTS’ AND SCIENTISTS’ RESEARCHES

Fig. 7. The appearance of tooling for shear testing in the sheet plane variations in strength characteristics, where brittle fracture occurs in some samples, while others under the same loads are in the zone of plastic deformation.
The graph (Fig. 12) shows that the samples have different characteristics in terms of strength and rigidity. The reinforcement direction, stated as quasi-isotropic,
Nanob
may explain some features of the behavior of the samples: in such cases, the properties of the materials may vary depending on the angle of application of the load. The samples demonstrated a non-uniform response to shear loads, which underscores the importance of choosing optimal reinforcement angles to achieve the required physical and mechanical characteristics of the materials.
In the initial section of the graph (Fig. 13), a linear relationship is noted, indicating the ability of the material to withstand loads without significant deformations. The samples reach peak load values, after which the load growth slows down with increasing displacement and the process of inelastic deformations begins. Subsequently, there is a sharp drop in load with increasing displacement, which indicates a loss of strength.
The test results of the FRP samples for shear in the plane are shown in Table 4. The shear strength in the plane of the FRP samples reaches 91.9 MPa. Positive results were shown by FRP samples with filler laid at 45° and quasi-isotropically reinforced, however, the same samples in tensile and compression tests showed the opposite result.
Interlaminar shear tests
The effectiveness of the matrix-binder interaction in a given sample is assessed by the material’s ability to resist tensile loads arising between the layers of the polymer composite structure. Short beam tests were conducted on a testing machine capable of loading samples at a specified, constant speed with the active grip and measuring the load. A photographic illustration of samples before and after interlaminar shear testing is shown in Figure 14.
Table 5 presents the interlaminar shear test results for FRP samples. The interlaminar shear strength for combinations with different binder types ranged from 23.5 MPa to 28.2 MPa. Samples based on Huntsman polyurethane binder and L285 epoxy resin performed less satisfactorily
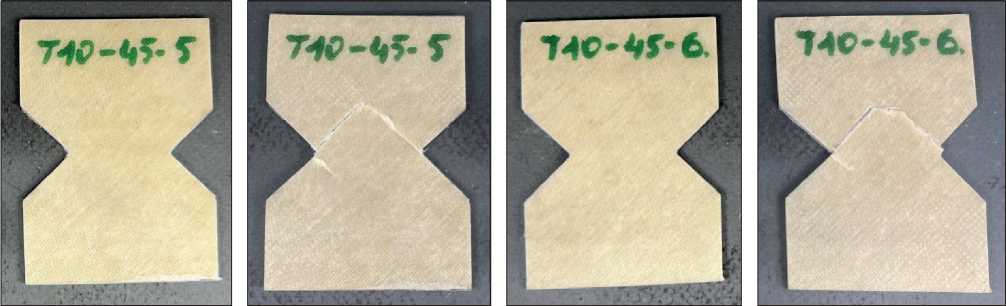
Fig. 8. Photo of samples from FRP based on fiberglass T-10 and binder VK-51, reinforcement direction 45° before and after shear tests in the plane
Nanotechnologies in construction 2026; 18 (1):
Нанотехнологии в строительстве 54–67
Nanob
THE RESULTS OF THE SPECIALISTS’ AND SCIENTISTS’ RESEARCHES
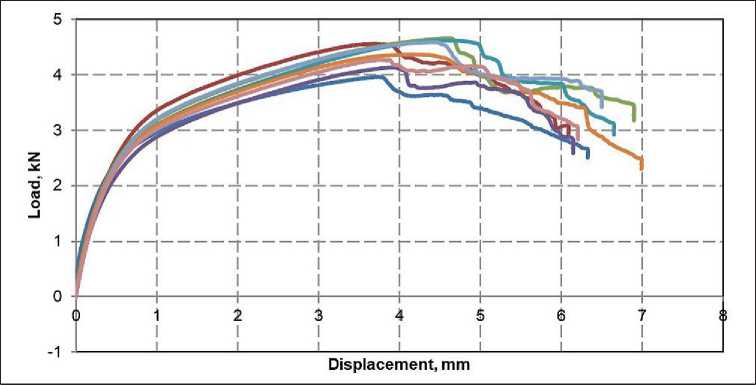
Fig. 9. Graph of the dependence of displacements on the load during shear testing in the plane of FRP samples based on fiberglass T-10 and binder VK-51, reinforcement direction 0°
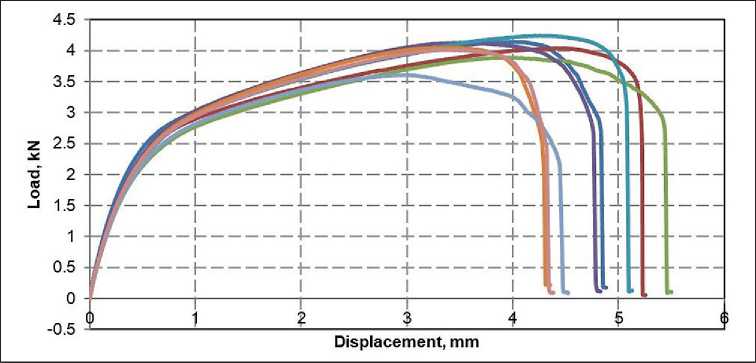
Fig. 10. Graph of the dependence of displacements on the load during shear testing in the plane of FRP samples based on fiberglass T-10 and binder VK-51, reinforcement direction 90°
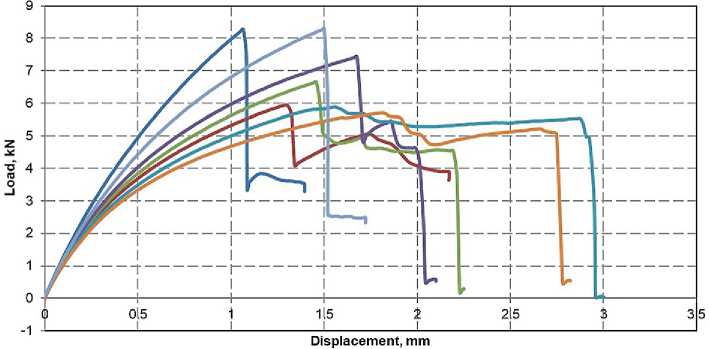
Fig. 11. Graph of the dependence of displacements on the load during shear testing in the plane of FRP samples based on fiberglass T-10 and binder VK-51, reinforcement direction 45°
Nanotechnologies in construction 2026; 18 (1):
Нанотехнологии в строительстве 54–67
Nanob
THE RESULTS OF THE SPECIALISTS’ AND SCIENTISTS’ RESEARCHES
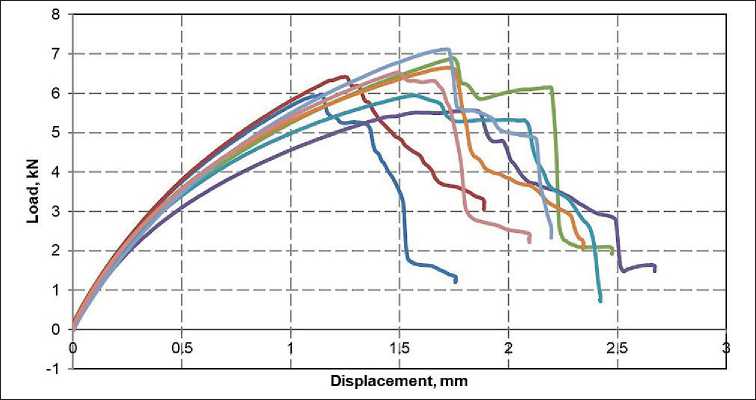
Fig. 12. Graph of the dependence of displacements on the load during shear testing in the plane of FRP samples based on fiberglass T-10 and binder VK-51, the reinforcement direction is quasi-isotropic
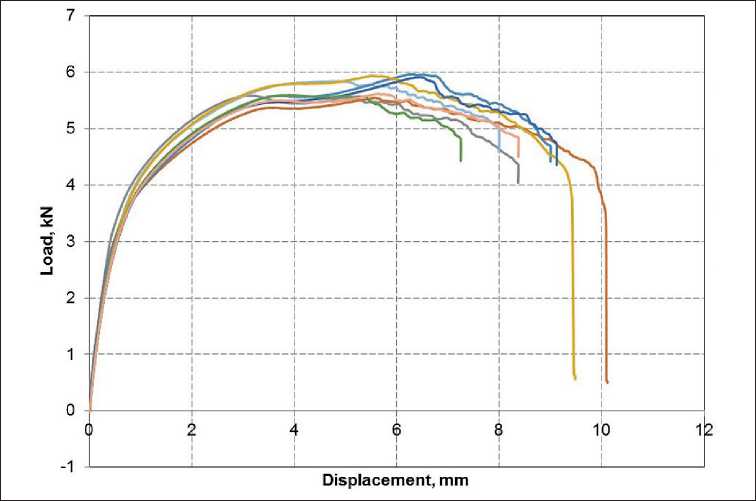
Fig. 13. Graph of the dependence of displacements on the load during shear testing in the plane of FRP samples based on fiberglass T-25 and binder VK-51, reinforcement direction 0°
Table 4. Results of shear tests of samples in the plane
|
No. |
Filler, direction of reinforcement |
Binder |
Thickness, mm |
Height, mm |
Max. load, kN |
Tensile strength, MPa |
Shear modulus, GPa |
|
1 |
Т10, 0º |
VK-51 |
1.624 |
29.504 |
4.398 |
91.858 |
3.000 |
|
2 |
Т10, 90º |
VK-51 |
1.574 |
29.765 |
4.016 |
85.752 |
3.227 |
|
3 |
Т10, 45º |
VK-51 |
1.560 |
29.759 |
6.888 |
148.499 |
8.581 |
|
4 |
T10, quasi-isotropic |
VK-51 |
1.553 |
30.003 |
6.387 |
137.165 |
6.440 |
|
5 |
Т25, 0º |
VK-51 |
2.008 |
30.123 |
5.747 |
95.050 |
3.022 |
Table 5. Results of interlayer shear test samples
|
No. |
Filler, direction of reinforcement |
Binder |
Width, mm |
Thickness, mm |
Max. load, kN |
Shear strength, MPa |
|
1 |
Т10, 0º |
Huntsman |
10.025 |
7.406 |
2.249 |
23.528 |
|
2 |
Т10, 0º |
L285 |
10.383 |
7.386 |
2.560 |
25.034 |
|
3 |
Т10, 0º |
XT118 |
10.141 |
9.395 |
3.141 |
24.852 |
|
4 |
Т10, 0º |
ED20 |
10.141 |
9.395 |
3.587 |
28.235 |
Nanotechnologies in construction 2026; 18 (1):
Нанотехнологии в строительстве 54–67
THE RESULTS OF THE SPECIALISTS’ AND SCIENTISTS’ RESEARCHES
Nanob
