Structural and elastic properties of Fe-Ge alloys: ab initio studies

Author: Zagrebin M.A., Matyunina M.V., Sokolovskiy V.V., Buchelnikov V.D.
Section: Физика
Article in issue: 2 т.12, 2020.
Free access
In this paper, with the help of the density functional theory, the structural and elastic properties of A2, B2, D03, and L12 phases of Fe100-xGex alloys (12,5 ≤ x ≤ 28,125 at. %) have been studied. The electronic and full ionic relaxations were used for the investigation of crystal structures. The concentration dependencies of the atomic volumes, structural phase transition temperatures, tetragonal and rhombohedral shear moduli have been calculated. We show that the atomic volume curves correlate with the sequence of phase transitions observed experimentally: A2→B2→D03 (x ≤ 22 at. % of Ge content). The structural phase transition temperatures increase with the Ge concentration. The calculated tetragonal moduli for the D03, A2, and L12 structures decrease with the increasing of the Ge content, what agrees with the experimental results. The dependence of rhombohedral shear moduli as a function of Ge concentration does not change significantly with increasing Ge atoms. The C44 is increased for the D03 phase, while for A2, B2, and L12, it decreases.
Ab initio, crystal structure, phase transformations, elastic moduli
Short address: https://sciup.org/147234108
IDR: 147234108 | UDC: 538.91 | DOI: 10.14529/mmph200206
Структурные и упругие свойства сплавов Fe-Ge: исследования ab initio
В работе представлены исследования структурных и упругих свойств фаз A2, B2, D03 и L12 сплавов Fe100-xGex (12,5 ≤ x ≤ 28,125 ат. %), выполненные при помощи теории функционала плотности. Кристаллические структуры исследовались при помощи двух типов релаксаций: электронной и полной ионной. Построены концентрационные зависимости атомных объемов, температур структурных фазовых переходов, тетрагональных и ромбоэдрических модулей сдвига. Кривые зависимостей величин атомного объема соответствует последовательности фазовых переходов, наблюдаемых экспериментально: A2 → B2 → D03 (x ≤ 22 ат. % содержания Ge). Показано, что температуры структурных фазовых переходов возрастают с увеличением концентрации Ge. В соответствии с экспериментальными результатами рассчитанные тетрагональные модули для структур D03, A2 и L12 уменьшаются с ростом атомов Ge в сплавах. Величина ромбоэдрического модуля сдвига существенно не изменяется с увеличением числа атомов Ge. C44 увеличивается для фазы D03, в то время как для A2, B2 и L12 уменьшается.
Text of the scientific article Structural and elastic properties of Fe-Ge alloys: ab initio studies
The discovery of large magnetostrictive strains in iron-gallium alloys in 1999 started the extensive study of rare-earth-free binary alloys based on α-Fe [1, 2]. These alloys are promising materials for sensors and actuator applications. Among them, iron-gallium alloys are the most thoroughly investigated. The phase diagram of Fe-Ge alloys is very similar to Fe-Ga systems in the Fe-rich region [3]. Ga and Ge are p -elements that have a significant influence on electronic structures of binary compounds, which, in turn, determines their structural and magnetic properties. In both alloys, in the range of Ga(Ge) content up to 12 at. %, the phase diagram is characterized by the existence of the disordered α-phase (A2 structure). At these compositions, the values of magnetostriction (λ 100 ) for Fe-Ga and Fe-Ge are similar and positive [1]. The further increase of Ga content up to 19 at. % leads to the formation of mixing phase D03+A2 [4]. The magnetostriction of Fe81Ga19 reaches 340·10–6 in slowly cooled samples. In the case of Fe81.5Ge18.5, B2 and D03 phases are observed [6], and λ100 = –96·10–6 [1]. In contrast to Fe-Ga alloys, the properties of Fe-Ge systems are not well investigated. Experimental studies of phase formation and transitions in alloys with Ge additives are presented in [5–13, etc.]. For Fe-Ge alloys in the phase region x ≤ 22 at. %, three types of the base-centered cubic ( bcc ) structures with different ordering (fully disordered A2, partially ordered B2, and ordered D0 3 ) exist [5, 7, 9, 10, 13]. In the concentration range of Ge content 22 ≤ x ≤ 28 at. %, low temperature face-centered cubic ( fcc ) L1 2 and high-temperature hexagonal D019 phases were also observed [5, 6, 8, 10–12]. The effect of the addition of Ge atoms on the elastic properties of Fe-Ge alloys is considered in [1, 14]: with the increase of Ge atoms in Fe lattice the tetragonal elastic modulus decreases.
The magnetic moments and Curie temperatures of Fe100– x Ge x alloys were investigated theoretically in [15–18]. With adding of Ge atoms the total magnetic moment and Curie temperature reduced. Cao et al . [19] with the help of a full-potential-linearized augmented plane wave method studied the magnetostriction as a function of Ge concentration. They found that λ 100 increased linearly with x up to 11 at. % and then decreased. In our recent work [15, 18] based on the total energy calculation of Fe 100– x Ge x alloys with different structures, the phase diagram as a function of x was constructed. Nevertheless, the existing theoretical results are insufficient to understand the relation between phase transformations and magneto-elastic properties.
Therefore, this study aims to investigate the structural and elastic properties of cubic phases of Fe 100– x Ge x (12,5 ≤ x ≤ 28,125 at. %) alloys within different approaches to geometry optimization. The paper is organized as follows. Section 2 presents the details of ab initio calculations. Section 3 contains
Физика
the main results and discussion. Conclusions are provided at the end of the article (Section 4).
1. Calculation details
Ab initio calculations were performed by using the projector augmented wave (PAW) method implemented in the Vienna ab initio simulation package (VASP) [20, 21]. The exchange-correlation effects were treated in generalized gradient approximation (Perdew–Burke–Ernzerhof formalization [22]). Pseudopotentials were taken for the following electronic configurations: Fe(3 p 63 d 74 s 1) and Ge(4s24 p 2). Kinetic energy cut-off was 450 eV, and kinetic energy cut-off for the augmentation charges was 800 eV. The Brillouin zone integration was performed by the Monkhorst–Pack scheme [23] with 8×8×8 k -point sampling. The calculations were converged with the energy accuracy of 10–7 eV. The geometry optimization of 32-atom supercells was carried out with the help of electronic and ionic relaxation. In the case of electronic relaxation, the equilibrium lattice parameters a 0 were obtained from the dependency of total energy E on the cell volume with a fitting to the Birch–Murnaghan equation of states. While the ionic optimization was fulfilled assuming that the cell shapes and ions degrees of freedom were fixed. The following phases in Fe100– x Ge x (12,5 ≤ x ≤ 28,125 at. %) alloys, which were observed experimentally, were considered: A2 (α-Fe-type structure , space group Im 3 m no. 229), B2 (CsCl-type structure , space group Pm 3 m no. 221), D0 3 (BiF 3 -type structure, space group Fm 3 m no. 225), and L1 2 (Cu 3 Au-type structure, space group Pm 3 m no. 221). To create off-stoichiometric compositions in 32-supercell for each structure, either Fe or Ge atoms were replaced by Ge or Fe on randomly chosen lattice sites, respectively. This allowed us to change the composition with the step of 3,125 at. %.
After obtaining the lattice constants, we calculated the elastic moduli for cubic structures using strain tensors, which correspond to isotropic, orthorhombic, and monoclinic deformations. We assumed that the volume of the unit cell was constant, and the distortion parameter changed in the range of ±3 %. Additional calculation details can be found in [24].
2. Calculation results
The calculated equilibrium lattice parameters a 0 , total energies per atom E 0 , and formation energies E form for electronic and ionic relaxation are presented in Table. The formation energy can be defined as a difference between the total energy per atom of an alloy and total energies per atom of its components in their equilibrium bulk structures:
Eform = Eo (Feioo-x Gex)-32[(100-x)EF (Ft) + xEGe]/100, where EaFte(Ge) is the total energy per atom of alloys components, x is the Ge content concentration. For A2, B2, D03, and L12 cubic structures, the lattice parameter increases with Ge content. In the case of B2 and D03 phases, the lattice constant decreases for systems with an excess of Ge (x > 25 at. %). For the comparison, the experimentally obtained lattice constants are also included in Table. For both relaxations, the values of lattice parameters are in good agreement with each other and with experimental results. The difference between a0el and a0ion is less than 0,5 %, and between a0el and a0exp is approximately 1 %. The differences between the obtained total energy values are negligible, and the D03 structure is energetically favorable for all considered Ge concentrations.
-
B2, D03, and L12 structures are stable because their formation energies are negative ( E form< 0). A2 phase is stable at Ge content x < 18 at. %. However, in the disordered A2 structure, the arrangement of atoms in the lattice has a significant effect on the ground state properties and formation energy, and we considered only one configuration.
Fig. 1(a) shows the atomic volume V a as a function of Ge concentration in the range of 12,5 ≤ x ≤ 28,125 at. %. The available experimental values [6, 9, 10] for the A2 structure are also presented in Fig. 1(a). The closest to the experiment are A2 phase results obtained with electronic relaxation and Ge content of up to x = 21,875 at. %. In the range of x > 22 at. %, the experimental volume changes slightly, while the theoretical estimation continues to increase. The lowest and the largest V a are observed for the most stable phase D0 3 and A2 structure, respectively. The V a of the B2 structure is close to D03. Under the transition from disordered to ordered state, the unit-cell parameters decrease slightly and, therefore, the atomic volume also decreases [25–27]. The obtained dependencies of V a on Ge content correspond to the sequence of phase transitions observed experimentally [5, 13]:
A2→B2→D03 (8≤ x ≤22 at. %). The fcc phase L12 in the range of 21,875 ≤ x ≤ 28,125 at. % has a minimum of V a in stoichiometric composition Fe 75 Ge 25 , which is in agreement with the experimental data [11]. The L12 phase is experimentally observed in the narrow Ge concentration range x ≈ 22÷25,7 at. % [5, 11, 28, 29]. Here, we simulated a wider range of concentrations for the L1 2 phase, since the minimal concentration step in the 32-atoms supercell is 3,125 at. %.
Table
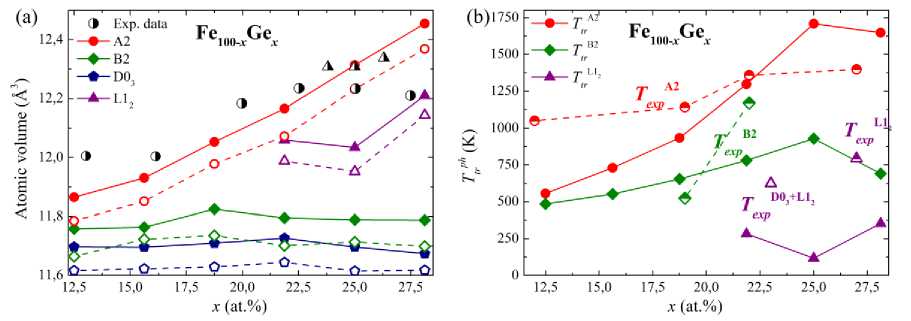
Fig. 1. Dependence of (a) Fe 100– x Ge x atomic volume V a , and (b) calculated temperatures of structural phase transitions on Ge concentration, x . Atomic volumes V a ( x ) were obtained by two types of relaxations: electronic (filled symbols) and full ionic (open symbols). Experimental atomic volumes (half-filled symbols) for A2 (circles) and L1 2 (triangles) structures were taken from [6, 9–11]. The experimental values of T tr were taken from [8, 11–13]
Optimized lattice constant a 0 (Å), total energy E 0 (eV/atom), and formation energy E form (m eV/atom ) of Fe 100– x Ge x alloys in comparison with experimental data ( a 0exp ). The positive values of formation energy are bolded
|
x |
Phase |
Electronic relaxation |
Ionic relaxation |
exp a 0 |
||||
|
el a 0 |
E 0 |
form |
ion a 0 |
E 0 |
Er form |
|||
|
12,5 |
A2 |
2,874 |
–7,803 |
–12,845 |
2,867 |
–7,802 |
–11,566 |
2,885 (13,03 at.%)1 |
|
B2 |
2,865 |
–7,809 |
–18,965 |
2,857 |
–7,809 |
–19,022 |
||
|
D0 3 |
5,72 |
–7,851 |
–60,717 |
5,707 |
–7,851 |
–60,709 |
||
|
15,625 |
A2 |
2,879 |
–7,680 |
–6,744 |
2,873 |
–7,680 |
–6,697 |
2,885 (16,13 at.%)1, 2,891 (14 at.%)2 |
|
B2 |
2,865 |
–7,695 |
–22,112 |
2,862 |
–7,696 |
–22,087 |
||
|
D0 3 |
5,720 |
–7,743 |
–69,712 |
5,708 |
–7,743 |
–69,665 |
||
|
18,75 |
A2 |
2,889 |
–7,556 |
0,718 |
2,883 |
–7,556 |
0,737 |
2,899 (20 at.%)2 |
|
B2 |
2,870 |
–7,580 |
–23,354 |
2,863 |
–7,580 |
–23,306 |
||
|
D0 3 |
5,722 |
–7,636 |
–79,794 |
5,709 |
–7,636 |
–78,904 |
||
|
21,875 |
A2 |
2,898 |
–7,418 |
21,643 |
2,890 |
–7,418 |
22,019 |
2,902 (22.5 at.%)2 2,885 (21 at.%)3 |
|
B2 |
2,868 |
–7,462 |
–22,965 |
2,860 |
–7,463 |
–23,219 |
||
|
D0 3 |
5,725 |
–7,530 |
–90,285 |
5,711 |
–7,529 |
–89,203 |
||
|
L1 2 |
3,640 |
–7,505 |
–65,941 |
3,633 |
–7,505 |
–65,358 |
||
|
25 |
A2 |
2,909 |
–7,275 |
47,329 |
2,903 |
–7,275 |
47,684 |
2,903 (25 at.%)2 |
|
B2 |
2,867 |
–7,343 |
–19,991 |
2,861 |
–7,343 |
–19,911 |
||
|
D0 3 |
5,720 |
–7,423 |
–100,095 |
5,707 |
–7,423 |
– 100,083 |
||
|
L1 2 |
3,638 |
–7,413 |
–90,031 |
3,629 |
–7,412 |
–89,481 |
3,6654 |
|
|
28,125 |
A2 |
2,920 |
–7,135 |
70,431 |
2,914 |
–7,136 |
70,408 |
2,901 (27,5 at.%)2 |
|
B2 |
2,867 |
–7,218 |
–12,121 |
2,860 |
–7,218 |
–12,141 |
||
|
D0 3 |
5,716 |
–7,277 |
–71,689 |
5,707 |
–7,277 |
–70,947 |
||
|
L1 2 |
3,655 |
–7,247 |
–41,225 |
3,649 |
–7,247 |
–41,201 |
3,6684 (26,3 at.%) |
|
1 Data were taken from [6].
2 Data were extrapolated from [10].
3 Data were taken from [7].
4 Data were taken from [11].
Физика
Fig. 1 (b) presents the calculated temperatures of structural phase transitions Ttrph as a function of Ge concentration and their comparison with the available experimental data [8, 11–13]. The estimations of T p can be obtained from AE ® kBTt A , where A E = E 0 - E min , E min is the energy of the most energetically favorable structure (D03 in this case), and kB is the Boltzmann constant. The structural phase transition temperature is the temperature, above which the corresponding phase exists. For all considered structures, T p values increase with Ge concentration. The slope of the theoretical T A 2 ( x ) curve is steeper than the experimental one. For x > 22 at. %, the experimental Te A xp 2 curve changes slightly, while the theoretical estimation of Ttr A2 continues to increase up to 25 at. % of Ge. For the B2 structure, the experimental Te B xp 2 curve increases more rapidly than the theoretical one. The pure structure L1 2 is experimentally observed at about 25 at. % of Ge content (through the D019→L12 transition). The range 22 ≤ x ≤ 27 at. % is characterized by different mixtures of the B2, D03, D019, and L12 phases [5, 8, 13].
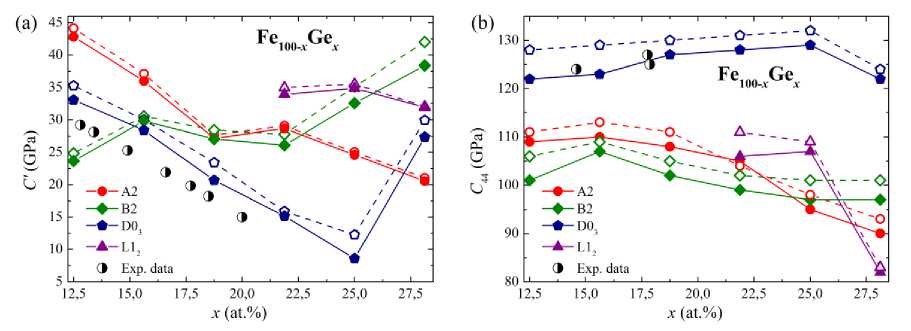
Fig. 2. Dependence of (a) tetragonal C' and (b) rhombohedral C 44 shear moduli of Fe 100- x Ge x alloys on Ge concentration, x . The results were obtained by two types of relaxations: electronic (filled symbols) and full ionic (open symbols). Experimental values (half-filled symbols) were taken from [1] for C' and from [14] for C 44
The concentration dependencies of tetragonal C ' and rhombohedral C 44 shear moduli are presented in Fig. 2 (a, b) together with the room-temperature experimental results. For both elastic moduli, the closest to the experimental values were calculation results for the D03 structure obtained by electronic relaxation. The increase of Ge concentration up to x = 25 at. % leads to a decrease in the tetragonal elastic modulus. This indicates a pronounced softening of the D03 structure. The rhombohedral shear modulus C 44 does not change significantly with x , only slightly decrease for structures with Ge excess ( x > 25 at. %). The same concentration dependencies for both C ' and C 44 were obtained theoretically for the D0 3 phase in the Fe-Ga system [24]. In the case of A2 and L1 2 structures, the tetragonal shear modulus decreases in the considered range of 12,5 ≤ x ≤ 28,125 at.%. For A2, B2, and L12 structures, the rhombohedral shear modulus C 44 has a trend similar to C '.
Conclusion
We have studied the structural and elastic properties of Fe-Ge alloys by using the first-principles methods. Crystal structure optimization was performed for phases A2, B2, D03, and L12 of Fe100–xGex (12,5 ≤ x ≤ 28,125 at. %). We considered two types of relaxations: electronic and full ionic. We showed that the lattice constants increase with Ge concentration in both approaches, and the difference between obtained lattice constant, total energy, and formation energy is negligible. The D03 structure is energetically favourable for all considered Ge concentrations. The dependence of atomic volume Va (x) on Ge content corresponds to the sequence of phase transitions observed experimentally (A2→B2→D03) in the range 8 ≤ x ≤ 22 at. %. We estimated the temperature of structural phase transitions Ttrph as a function of Ge concentration and found that the slope of the calculated curve for the A2 phase is steeper than for the experimental one. Moreover, we obtained the dependencies of tetragonal C' and rhombohedral C44 shear moduli on Ge content. For A2, D03, and L12 structures the increase of Ge concentration leads to a decrease in the tetragonal elastic moduli. The rhombohedral shear moduli do not change significantly with x. In general, results obtained by electronic relaxation are in good agreement with the experimental data.
Acknowledgments
This work was supported by Russian Science Foundation grant No. 18-12-00283 (Sections 2 and 3), V. Sokolovskiy and V. Buchelnikov gratefully acknowledge the financial support of Ministry of Science and Higher Education of the Russian Federation in the framework of increase Competitiveness Program of NUST “MISIS” (Grant No. K2-2019-006), implemented by a governmental decree dated 16th of March 2013, No 211, M. Zagrebin acknowledge the financial support of Young Scientist Support Foundations of Chelyabinsk State University.
References Structural and elastic properties of Fe-Ge alloys: ab initio studies
- Restorff J.B., Wun-Fogle M., Hathaway K.B., Clark A.E., Lograsso T.A., Petculescu G. Tetragonal magnetostriction and magnetoelastic coupling in Fe-Al, Fe-Ga, Fe-Ge, Fe-Si, Fe-Ga-Al, and Fe-Ga-Ge alloys. Journal of Applied Physics, 2012, Vol. 111, pp. 023905. D0I:10.1063/1.3674318
- Clark A.E., Hathaway K.B., Wun-Fogle M., Restorff J.B., Lograsso T.A., Keppens V.M., Petculescu G., Taylor R.A. Extraordinary magnetoelasticity and lattice softening in bcc Fe-Ga alloys. Journal of Applied Physics, 2003, Vol. 93, Iss. 10, pp. 8621-8623. D0I:10.1063/1.1540130
- Turtelli R.S., Nunesa C.B., Teixeira L.C., Grössinger R., Suzuki P.A., Barbatti C. Magnetostriction of polycrystalline Fe-Ge alloys. Journal of Alloys and Compounds, 2009, Vol. 471, Iss. 1-2, pp. 5255. DOI: 10.1016/j.jallcom.2008.03.038
- Ikeda O., Kainuma R., Ohnuma I., Fukamichi K., Ishida K. Phase equilibria and stability of ordered b.c.c. phases in the Fe-rich portion of the Fe-Ga system. Journal of Alloys and Compounds, 2002, Vol. 347, Iss. 1-2, pp. 198-205. D0I:10.1016/S0925-8388(02)00791-0
- Enoki H., Ishida K., Nishizawa T. Miscibility gap due to ordering in the bcc Fe-Ge system. Metallurgical transactions A, 1987, Vol. 18A, pp. 949-955. D0I:10.1007/BF02668543
- Chessin H., Arajs S., Colvin R.V., Miller D.S. Paramagnetism and lattice parameters of Iron-rich iron-germanium alloys. Journal of Physics and Chemistry of Solids, 1963, Vol. 24, Iss. 2, pp. 261-273. DOI: 10.1016/0022-3697(63)90131-8
- Golovin I.S., Ivleva T.V., Jäger S., Jencus P., Neuhäuser H., Redfern S.A.T., Siemers C. Structure and anelasticity of Fe-Ge alloys. Solid State Phenomena, 2008, Vol. 137, pp. 59-68. DOI:10.4028/www. scientific .net/S SP.137.59
- Golovin I.S., Jäger S., Mennerich Chr., Siemers C., Neuhäuser H. Structure and anelasticity of Fe3Ge alloy. Intermetallics, 2007, Vol. 15, Iss. 12, pp. 1548-1557. DOI:10.1016/j.intermet.2007.06.004
- Konygin G.N., Yelsukov E.P., Porsev V.E. The structure and magnetic properties of the non-equilibrium Fe100-xGex (x=5-40 at%) system produced by mechanical alloying. Journal of Magnetism and Magnetic Materials, 2005, Vol. 288, pp. 27-36. DOI:10.1016/j.jmmm.2004.07.052
- Cabrera A.F., Sánchez F.H. Mössbauer study of ball-milled Fe-Ge alloys. Phys. Rev. B, 2002, Vol. 65, pp. 094202. DOI: 10.1103/PhysRevB.65.094202
- Kanematsu K., Ohoyama T. Magnetic and X-ray studies of iron-germanium system II. Phase diagram and magnetism of each phase. Journal of the Physical Society of Japan, 1965, Vol. 20, pp. 236242. DOI: 10.1143/JPSJ.20.236
- Sarkar S., Bansal C., Chatterjee A. Gibbs-Thomson effect in nanocrystalline Fe-Ge. Phys. Rev. B, 2000, Vol. 62, pp. 3218-3222. DOI: 10.1103/PhysRevB.62.3218
- Belamri Z., Hamana D., Golovin I.S. Study of order-disorder transitions in Fe-Ge alloys and related anelastic phenomena. Journal of Alloys and Compounds, 2013, Vol. 554, pp. 348-356. DOI: 10.1016/j.jallcom.2012.11.012
- Petculescu G., LeBlanc J.B., Wun-Fogle M., Restorff J.B., Yuhasz W.M., Lograsso T.A., Clark A.E. Magnetoelastic coupling in Fe100-xGex single crystals with 4
- Matyunina M.V., Zagrebin M.A., Sokolovskiy V.V., Buchelnikov V.D. The structural Phase Diagrams of Fe-Y (Y=Ga, Ge, Al) alloys. Materials Research Proceedings, 2018, Vol. 9, pp. 162-166. DOI: 10.21741/9781644900017-31
- Khmelevska T., Khmelevskyi S., Ruban A.V., Mohn P. Magnetism and origin of non-monotonous concentration dependence of the bulk modulus in Fe-rich alloys with Si, Ge and Sn: a first-principles study. Journal of Physics: Condensed Matter, 2006, Vol. 18, no. 29, pp. 6677-6689. DOI: 10.1088/0953-8984/18/29/009
- Zagrebin M.A., Matyunina M.V., Sokolovskiy V.V., Buchelnikov V.D. the effect of exchange-correlation potentials on magnetic properties of Fe- (Ga, Ge, Al) alloys. Journal of Physics: Conference Series, 2019, Vol. 1389, VII Euro-Asian Symposium "Trends in Magnetism", 8-13 September 2019, Ekaterinburg, Russian Federation, pp. 012087. DOI: 10.1088/1742-6596/1389/1/012087
- Matyunina M.V., Zagrebin M.A., Sokolovskiy V.V., Buchelnikov V.D. First principles study of structural and magnetic properties in Fe100-xGex alloys. Physica B: Condensed Matter, 2020, Vol. 580, pp. 411934. DOI: 10.1016/j.physb.2019.411934
- Cao J.X., Zhang Y.N., Ouyang W.J., Wu R.Q. Large magnetostriction of Fe1-xGex and its electronic origin: Density functional study. Physical Review B, 2009, Vol. 80, Iss. 10, p. 104414. DOI: 10.1103/PhysRevB.80.104414
- Kresse G., Joubert D. From ultrasoft pseudopotentials to the projector augmented-wave method Phys. Rev. B, 1999, Vol. 59, Iss. 3, pp. 1758. DOI: 10.1103/PhysRevB.59.1758
- Kresse G., Furthmuller J. Efficient iterative schemes for ab initio total-energy calculations using a plane-wave basis set. Physical Review B, 1996, Vol. 54, Iss. 16, pp. 11169-11186. DOI: 10.1103/PhysRevB.54.11169
- Perdew J.P., Burke K., Ernzerhof M. Generalized gradient approximation made simple. Phys. Rev. Lett., 1996, Vol. 77, Iss. 18, pp. 3865-3868. DOI: 10.1103/PhysRevLett.77.3865
- Monkhorst H.J., Pack J.D. Special points for Brillouin-zone integrations. Physical Review B, 1976, Vol. 13, Iss. 12, pp. 5188-5192. DOI: 10.1103/physrevb.13.5188
- Matyunina M.V., Zagrebin M.A., Sokolovskiy V.V., Pavlukhina O.O., Buchelnikov V.D., Bala-gurov A.M., Golovin I. S. Phase diagram of magnetostrictive Fe-Ga alloys: insights from theory and experiment. Phase Transitions, 2019, Vol. 92, Iss. 2, pp. 101-116. DOI: 10.1080/01411594.2018.1556268
- Warren B E. X-ray diffraction. New York (NY), Dover Publications, 1990, 400 p.
- Balagurov A.M., Bobrikov I.A., Sumnikov S.V., Golovin I.S. Dispersed clusters in (Fe, Cr)3Al alloys: Neutron time-of-flight diffraction study. Physical Review Materials, 2019, Vol. 3, Iss. 1, pp. 013608. DOI: 10.1103/physrevmaterials.3.013608
- Balagurov A.M., Samoylova N.Yu., Bobrikov I.A., Sumnikova S.V., Golovin I.S. The first- and second-order isothermal phase transitions in Fe3Ga-type compounds. Acta Crystallographica, 2019, Vol. B75, pp. 1-10. DOI: 10.1107/S2052520619013106
- Fernandez A., Tejedor L., Bru L. Electron microscopy study of phase change DO19^L12 in the Fe3Ge compound. Physica Status Solidi (a), 1976, Vol. 34, p. K17. DOI: 10.1002/pssa.2210340147
- Chen Q.Z., Ngan A.H.W., Duggan B.J. The L12^D019 transformation in the intermetallic compound Fe3Ge. Journal of Materials Science, 1998, Vol. 33, P. 5405-5414. DOI: 10.1023/A: 1004454402007
