Structural body composition profile and obesity prevalence at female students of the University of Belgrade measured by multichannel bioimpedance protocol

Author: Dopsaj M., Djordjevi-niki M., Khafizova A., Eminovi F., Markovi S., Yanchik E., Dopsaj V.
Journal: Человек. Спорт. Медицина @hsm-susu
Section: Физиология
Article in issue: 2 т.20, 2020.
Free access
Aim. University students represent a specific group of young people in the final phase of biological, social and professional maturing and, at the same time, they are finishing their education and preparing themselves for long life obligations and period of living as an adult. The aim of this study was to determine the quantitative characteristics, descriptive models and prevalence of the body structure of the female students of the University of Belgrade. Material and Methods. The sample consisted of 862 female students of the University of Belgrade (26 Faculties) from all study programs (from bachelor to PhD). The average age of students was: 22.2 ± 2.6 years. The whole sample was divided into eight BMI sub-classes according to WHO standards. All measurements were performed in the period 2014-2018 and were conducted according to the standardized procedure, using the InBody 720 measurement system. Results. Based on the results of the BMI prevalence, it can be argued that 6.85 % of female students are underweight, 80.14 % has normal BMI value, 9.64 % are overweight and only 3.13 % of the students are obese. Considering percent of body fat (PBF) as a criteria of nutritional status, 0.5 % of female students had PBF under the essential biological level (below the 10.0 % limit), 1.9 % had PBF at an essential level, 19.4 % had PBF at the level of athletes, 33.3 % had fitness level of PBF, 29.4 % had normal body fat level, and the percent of the sample in the obese category was as high as 15.6 %. Results of ANOVA Regression have shown that trend of body fat changes per kg•m-2 of BMI was between 1.5496 and 1.5181 % depending on the regression model, with a standard error of estimation value of 4.59 % of body fat. Conclusion. Based on the results of this study, it can be concluded that the morphological status of the female students of the University of Belgrade is at the level of persons with normal BMI, but with twice as big prevalence of underweight (6.85 %), i.e. malnutrition, than obesity (3.13 %), i.e. overnutrition.
Bmi prevalence, percent of body fat, female students, body composition, university of belgrade
Short address: https://sciup.org/147233600
IDR: 147233600 | UDC: 615.4 | DOI: 10.14529/hsm200207
Исследование состава тела и распространенности ожирения у студенток Белградского университета с использованием биоимпедансного анализа
Цель. Студенты университета представляют особую группу молодых людей на заключительном этапе биологического, социального и профессионального становления, которые заканчивают свое образование и готовятся к долгосрочным обязательствам и взрослой жизни. Целью данного исследования было определение количественных характеристик, описательных моделей и закономерностей строения тела студенток Белградского университета. Материалы и методы. Выборка состояла из 862 студенток Белградского университета (26 факультетов) всех учебных программ (от бакалавриата до аспирантуры). Средний возраст учащихся составил 22,2 ± 2,6 года. Все испытуемые были разделены на восемь подгрупп в зависимости от ИМТ в соответствии со стандартами ВОЗ. Все измерения проводились в период 2014-2018 гг. в соответствии со стандартизированной процедурой с использованием системы InBody 720. Результаты. Исходя из деления на подгруппы в зависимости от ИМТ, можно утверждать, что 6,85 % учащихся женского пола имеют недостаточный вес, 80,14 % имеют нормальное значение ИМТ, 9,64 % имеют избыточный вес и только 3,13 % учащихся страдают ожирением. Используя показатель процентного содержания жира (ПСЖ) в организме в качестве критерия нутритивного статуса, можно сделать вывод, что у 0,5 % учениц ПСЖ ниже необходимого биологического уровня (ниже 10,0 %), у 1,9 % - ПСЖ находится на достаточном уровне, у 19,4 % - ПСЖ достигает уровня спортсменов, у 33,3 % ПСЖ свидетельствует о хорошей физической форме, 29,4 % демонстрируют нормальные показатели ПСЖ, а процент выборки с повышенными показателями ПСЖ составляет 15,6 %. Результаты регрессии ANOVA показали, что тенденция изменения содержания жира в организме на кг•м-2 ИМТ составила от 1,5496 до 1,5181 % в зависимости от регрессионной модели со стандартной ошибкой оценки в 4,59 %. Заключение. На основании результатов данного исследования можно сделать вывод о том, что морфологический статус студенток Белградского университета находится на уровне лиц с нормальным ИМТ, при этом дефицит веса встречается вдвое чаще (6,85 %), чем ожирение (3,13 %).
Text of the scientific article Structural body composition profile and obesity prevalence at female students of the University of Belgrade measured by multichannel bioimpedance protocol
The term body composition or body structure defines the system of organs and interaction of all organic tissues, as a set of biological substances, of which the human organism consists [9]. Inappropriate body composition status generally points out to insufficiency or sufficiency of some tissue substances, and at the same time, it is usually a risk indicator for the possible occurrence of various diseases, mainly with a background in non-communicable diseases [24].
Generally speaking, body composition cha- racteristics are strongly determined by individual characteristics of the person, i.e. of endogenous and exogenous factors. But, it is a fact that a system of longitudinal monitoring of the state of the body composition has to exist, whether due to the purpose of continuously tracking a person's development, or as some internal, external, or even global system, used for monitoring growth and development of the general population during growing and aging [19, 21]. Also, a scientific system based on standards of body composition is very important for planning measures and me- thods for corrections, as well as changes in physical activity or changes in the strategy of eating habits [2, 11, 23].
Systematic analysis of the published data have shown that the trend of an increment in the percent of overweight and obese people is more and more visible in the world population [8]. The latest study has shown that, at a global level, the prevalence of obesity has increased by 7.6 % in men and 8.5 % in women over the last 40 years [16]. It seems that gaining body weight above the age and gender average level is no longer exclusively the problem of highly developed countries and that developing countries are equally affected by negative changes of obesity pandemic [1, 14].
University students represent a specific group of young people in the final phase of biological, social and professional maturing, and, at the same time, they are finishing their education and preparing themselves for long life obligations and period of living as adults [22, 23]. It has been found that students are exposed to different stressful situations, such as parting from the family, the constant pressure of studies, emotional maturity difficulties, non-expected social issues, and financial problems regardless of place of living [15, 17]. All these different life situations may affect the result of their success on the studies, but also can influence their quality of life and change previous life habits [17, 18].
According to the latest available data, the University of Belgrade (BU), as the largest University center in Serbia, attends approximately about 70000 to 80000 students every year (University of Belgrade 2017, http:// rs/sr/mediji/. Until now, there is no scientifically valid general data’s about body composition characteristics of this student population, although, the country faced specific geopolitical, and socio-economic changes in the last three decades.
In relation to the previous, the aim of this study was to determine the quantitative characteristics, descriptive models and differences of the body structure of the female students of the University of Belgrade using the multisegmental bioelectrical impedance analysis (BIA). BIA is a widely used, standard, method for determining whole body composition and a fast, non-invasive, easy-to-apply and valid scientific measurement method with regard to age and body shape [20, 21]. The current status of body composition cha- racteristics, obtained using BIA, enables us to define referent data of the current population indicators for female students of the University of Belgrade, which is the basic scientific foundation required in order to establish a system for continuous monitoring of the female student population in the future.
The Sample
The sample of subjects in this research consisted of 862 female students of the University of Belgrade (BU, from all study programs (bachelor to PhD). The average age of female students was: 22.2 ± 2.6 years (Min-Max = 18.0 – 34.0 yrs.). The whole sample was divided, according to WHO standards, into eight BMI sub-classes as follows: Underweight (< 18.49, N = 58), Normal range I (18.50–22.99, N = 582), Normal range II (23.00–24.99, N = 109), Overweight I (25.00–27.49, N = 61), Overweight II (27.50–29.99, N = 22), Obese class I (30.0– 34.99, N = 29), Obese class II (35.00–39.99, N = 7) and Obese class III (≥ 40.00, N = 3) (http://:apps/who/int/bmi/). For PBF (percent of body fat) the ACE (US) classification was used ([1] .
Measurement
All measurements were performed in the period 2014–2018 at the University of Belgrade, Faculty of Sport and Physical Education, in Methodological-research laboratory ( MIL ) and Faculty of Medicine – Institute for Hygiene and Medical Ecology, in Belgrade. Measurements were conducted according to the standardized procedure, using the method of segmental multichannel bioimpedance of the newest generation – InBody 720 [13].
All measurements were conducted in the mo- rning hours (between 8:30 and 11:00 AM.). All subjects were informed in advance about a nutrition/activity regime required on the day of the measurement and on a day before. They did not take any food or liquid on the morning of the testing procedure, did not have any intense physical activity within 12 hours prior to measurement, did not consume any alcohol within 48 hours prior to testing and were asked to perform all physiological needs before the measurement. Subjects were in the standing position for at least 5 minutes prior to measurement for redistribution of body fluids. During the measurement all subjects were in light sports clothing and had no metal accessories. The measurement was performed in a standing position in accordance with the manufacturer's recommendations (hands aside placed 15 cm laterally from the body) [6].
Variables
This study included eleven (11) variables, of which six primary (6) and five (5) derived, i.e. index variables, defined in the form of morphological indices used to further describe morphological body structure of the tested sample.
The primary variables were the following: 1. BH – body height, expressed in cm; 2. BM – body mass, expressed in kg; 3. TBW – total body water, expressed in L; 4. Protein – expressed in kg; 5. Mineral – expressed in kg; 6. BF – total body fat mass, expressed in kg.
The derived (index) variables were the following: 7. BMI – body mass index, expressed in kg·m–2; 8. PTBW – percent of total body water, expressed in %; 9. PP – percent of protein mass, expressed in %; 10. PM – percent of the mineral mass, expressed in %; 11. PBF – percent of the fat mass, expressed in %.
Further, 4D model of body structure was calculated for all BMI classes in absolute and relative terms in accordance with the previously described procedure [3, 5].
Statistical analysis
All results were analyzed by applying the descriptive statistical procedure in order to calculate measures of central tendency and dispersion of data (Mean ± SD). General differences in relation to WHO BMI subgroups of the participants as well as in relation to the interaction of these factors were tested using Multivariate analysis of the variance (MANOVA) and Factorial analysis of the variance (Factorial ANOVA). Partial Eta squared (Partial ɳ2) was calculated as a measure of effect size. Also, partial differences between the defined BMI subsamples were determined by application of post hoc tests using Bonferroni correction criteria. In order to determine the dependencies between the two criteria variables of body composition status (BMI and PBF), linear regression analysis was used. All data analyses were conducted using SPSS v.17 statistical software. The level of statistical significance was defined for the probability of 95 %, i.e. p ≤ 0.05.
Results
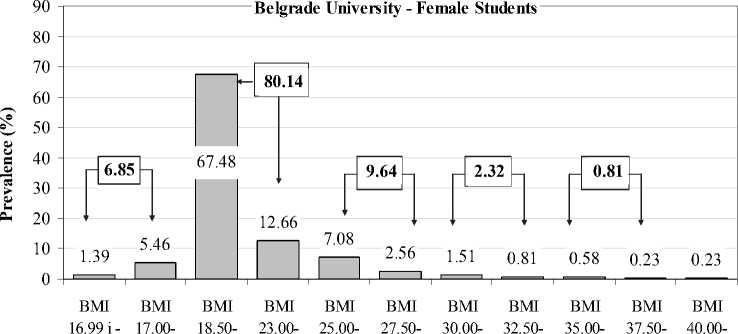
The results of the prevalence in relation to BMI subclasses are shown in Fig. 1. The results
18.49 22.99 24.99 27.49 29.99 32.49 34.99 37.49 39.99
BMI (kg/m2)
Fig. 1. Results of the BMI subclasses prevalence in female students of the University of Belgrade Basic descriptive results and established general and between-group differences of the sample regarding BMI subclasses are shown in Table 1
н
Fat Essential Fat Athletes
Fitness Normal Fat
PBF (%)
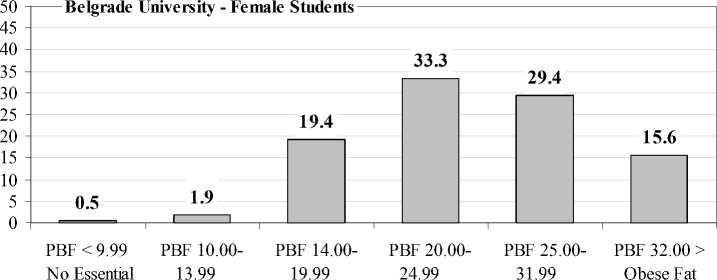
Fig. 2. Results of the PBF subclasses prevalence in female students of the University of Belgrade
22.99
24.99
27.49
29.99
34.99
39.99
BMI Classes
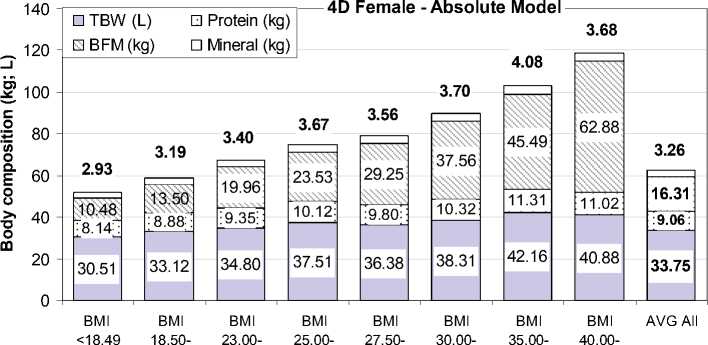
Fig. 3. 4D model of the body structure (absolute value) in female students of the University of Belgrade according to the WHO BMI subclasses criteria
of the prevalence regarding PBF subclasses are shown in Fig. 2.
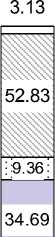
4D body structure models (absolute and relative values) in relation to the analyzed WHO BMI subclasses criteria are shown in Fig. 3 and 4.
The relation between two criteria body variables – BMI and PBF with a defined models of prediction PBF in function of BMI, for the examined sample of female students of the University of Belgrade is shown in Fig. 5.
Discussion
The aim of this study was to determine the quantitative characteristics, descriptive models and differences of the body structure of the female students of the University of Belgrade, defined by use of multisegmental bioelectrical impedance analysis (BIA) method. Generally speaking, the results will give biofeedback information about nutritional status based on the body composition values among the female student population in the main and biggest University in the Republic of Serbia [7].
According to the results it can be argued that average basic anthropo-morphological characteristics of the respondents, as as criteria sample of female BU students, were: Age = 22.3 ± 2.6 yrs., (18.0 to 34.0, Min and Max); BH = 168.3 ± 6.7 cm, (146.0 to 190.0, Min and Max); BM = 62.2 ± ± 10.7 kg, (41.2 to 143.7, Min and Max); BMI = = 22.02 ± 3.6 kg·m–2, (14.43 to 48.63, Min and Max); and PBF = 25.34 ± 7.16 %, (5.80 to 54.28, Min and Max).
60 Q.
E
■о ° 20
TBW % Protein (%)
PBF (%) Mineral (%)
5.63
5.43
20.13
15.64
58.60
4D Female - Relative Model
22.98
, , , , 15.14
5.02
29.64
13.83
4.90
■ 31.41 ■ 13.53
4.50

37.10
4.10

42.01
3.95

44.21
56.44
51.50
50.16

12.39

11.43

10.97
46.00
25.34
14.68
54.70
5.28
42.46
40.87
|
BMI |
BMI |
BMI |
BMI |
BMI |
BMI |
BMI |
BMI |
AVG All |
|
<18.49 |
18.50- |
23.00- |
25.00- |
27.50- |
30.00- |
35.00- |
40.00- |
|
|
22.99 |
24.99 |
27.49 |
29.99 |
34.99 |
39.99 |
BMI Classes
Fig. 4. 4D model of the body structure (relative value) in female students of the University of Belgrade according to the WHO BMI subclasses criteria
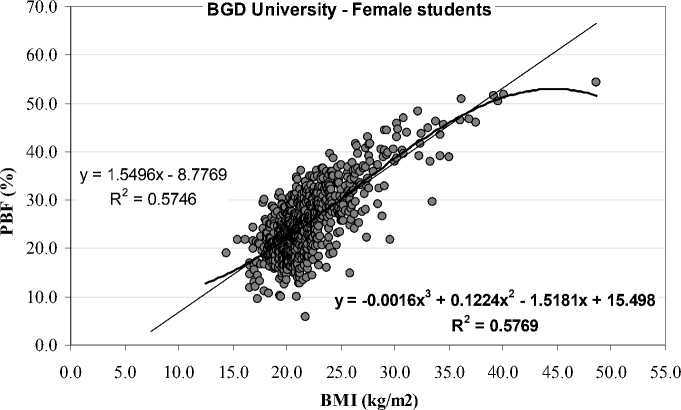
Fig. 5. The relation between two criteria body variables – BMI and PBF with a defined models of prediction
Based on the results of the BMI prevalence, it can be argued that 6.85 % of female students are underweight, 80.14 % has a normal BMI value, 9.64 % are overweight and only 3.13 % of the students are obese (Fig. 1). Inside the normal BMI group, as many as 67.48 % of female students are in the Normal weight class I (BMI = = 18.50 – 22.99 kg·m–2). Considering PBF as a criteria of nutritional status according to the obtained results (Fig. 2), as many as 0.5 % of the female students had PBF under the essential biological level (below 10.0 %), 1.9 % had PBF at an essential level, 19.4 % had PBF at the level of athletes, 33.3 % had fitness level of PBF, 29.4 % had normal body fat level, and as many as 15.6 % were in the obese category.
The results of the applied MANOVA have shown that, on a general level, statistically significant differences between BMI groups exist, as well as that the groups differ at the level of 40.9 % between themselves when considering absolute (Table 1, Wilks' lambda Value = 0.122, p = 0.000, ɳ2 = 0.409) and 23.2 % when considering relative values (Table 1, Wilks' lambda Value = 0.347, p = 0.000, ɳ2 = 0.232).
Considering the partial differences (Between-
Table 1
The descriptive results with BMI subclass differences in female students of the University of Belgrade
|
m H |
.S S ад 2 ^- £ |
m |
S -y |
m H Ph |
Ph Ph |
Ph m Ph |
2 Ph |
|
|
Underweight |
30.1 ± 3.2* |
8.1 ± 0.9* |
10.0 ± 2.6* |
2.9 ± 0.3* |
59.1 ± 3.3* |
15.8 ± 0.9* |
19.5 ± 4.4* |
5.7 ± 0.3* |
|
Normal I |
33.1 ± 3.6* |
8.9 ± 1.0* |
13.5 ± 3.2* |
3.2 ± 0.4@ |
56.4 ± 3.5* |
15.1 ± 1.0* |
23.0 ± 4.8* |
5.4 ± 0.3* |
|
Normal II |
34.8 ± 4.2* |
9.3 ± 1.2* |
20.0 ± 3.3* |
3.4 ± 0.5& |
51.5 ± 3.3* |
13.8 ± 1.0 |
29.6 ± 4.5* |
5.0 ± 0.3 |
|
Overweight I |
37.5 ± 4.0# |
10.1 ± 1.1# |
23.5 ± 4.3* |
3.7 ± 0.4 # |
50.2 ± 3.7* |
13.5 ± 1.1 |
31.4 ± 5.0* |
4.9 ± 0.3 |
|
Overweight II |
36.4 ± 5.6§ |
9.8 ± 1.5§ |
29.3 ± 4.8* |
3.6 ± 0.6§ |
46.0 ± 4.2* |
12.4 ± 1.2* |
37.1 ± 5.8* |
4.5 ± 0.4* |
|
Obese I |
38.3 ± 6.5¥ |
10.3 ± 1.8¥ |
37.6 ± 4.5* |
3.7 ± 0.6¥ |
42.5 ± 3.2* |
11.4 ± 0.9* |
42.0 ± 4.3* |
4.1 ± 0.3* |
|
Obese II |
40.8 ± 4.2£ |
10.9 ± 1.1£ |
49.5 ± 5.3* |
4.0 ± 0.5£ |
38.8 ± 3.0* |
10.3 ± 0.8£ |
47.1 ± 4.1* |
3.8 ± 0.3* |
|
Obese III |
40.9 ± 6.0† |
11.0 ± 1.6† |
62.9 ± 11.8* |
3.7 ± 0.5© |
34.7 ± 0.8* |
9.4 ± 0.3* |
52.8 ± 1.1* |
3.1 ± 0.1* |
|
MANOVA |
Wilks' lambda = 0.122, p = 0.000, ɳ2 = 0.409 |
Wilks' lambda = 0.347, p = 0.000, ɳ2 = 0.232 |
||||||
|
ANOVA |
F = 29.59, p = 0.000 |
F = 30.33, p = 0.000 |
F = 508.44, p = 0.000 |
F = 31.46, p = 0.000 |
F = 157.7, p = 0.000 |
F = 138.0, p = 0.000 |
F = 157.6, p = 0.000 |
F = 173.9, p = 0.000 |
|
Partial ɳ2 |
0.195 |
0.199 |
0.806 |
0.205 |
0.563 |
0.530 |
0.563 |
0.587 |
Legend: * p = 0.000, statistically significant differences between all groups; # p = 0.000, Overweight I vs. all other BMI subgroups except Overweight II, Obese I, II and III; § p = 0.000, Overweight II vs. all other BMI subgroups, except Overweight I, Obese I, II and III; ¥ p = 0.005, Obese I vs. all other BMI subgroups, except Overweight I and II, Obese II and III; £ p = 0.001, Obese II vs. all other BMI subgroups, except Overweight I and II, Obese I and III; f p = 0.001, Obese III vs. all other BMI subgroups, except Overweight I and II, Obese I and II; @ p = 0.000, Normal range I vs. all other BMI subgroups, except Obese III; & p < 0.05, Normal range II vs. all other BMI subgroups, except Overweight II and Obese III; © p = 0.005, Obese III vs. all other BMI subgroups, except Underweight
Subjects Effects) for the absolute body composition variables the largest effect between BMI groups was found for Body Fat (BF) variable (F = 508.44, p = 0.000) which was responsible for 80.6 % differences between BMI group (Table 1, ɳ2 = 0.806), than Minerals, Protein and TBW (20.5, 19.9 and 19.5 %, respectively, Table 1). For the relative body composition variables, all effects are very similar with values between 53.0 % for Percent of Protein mass (PP) to 58.7 % for Percent of Mineral mass (PM) in the body (Table 1).
In a previous study, which initially examined the body composition of physically active BU students it was determined that BMI prevalence of overweight and obese female students was 8.09 and 2.95 %, respectively, while underweight prevalence was 4.42 % [5]. When comparing the results of the previously mentioned and this study it can be argued that the general prevalence of overweight and obese female students of the University of Belgrade is 10.16 % (8.09 vs 0.64 %) and 6.10 % (2.95 vs 3.13 %) higher in relation to prevalence of physically active students, respectively. Also, it should be pointed out that the prevalence of female students in the underweight category is higher in the general population of 58
female BU students for as much as 54.98 % (4.42 vs 6.85 %) in relation to physically active female students [5].
According to the previous comparison of the results we can conclude that the tested sample of general BU population of female students, when compared to physically active students from the same University, shows the characteristics of bimodal distribution differences, i.e. there is a tendency accentuated toward a 1.5 times higher prevalence of skinny and approximately 1.2 times greater prevalence of overweight and obese population of students.
In relation to prevalence of overweight, obese and underweight but considering fat tissue in the body, the results of previously published study have shown that physically active female students of the University of Belgrade [5] have lower PBF prevalence level by 18.64 % (24.78 vs 29.40 %), by as much as 60.33 % (9.73 vs 15.60 %) and 6.19 % (2.26 vs 2.40 %), respectively than general BU female population (Fig. 2).
When analyzing the results of working women aged 35.2 years [4] it can be concluded that the prevalence of underweight and obese was 2.14 (9.64 vs 30.27 %) and 2.22 (3.13 vs 10.09 %) higher in relation to the results of this study.
Regarding the prevalence in relation to the category of underweight, it can be concluded that it is 1.5 times lower (6.85 vs 3.67 %) in adult women in relation to the results of this study.
The results of 4D absolute body composition model have shown that the measured female sample has an average level of total body water, total body fat mass, protein mass and mineral mass in the body at the level of 33.75 L, 16.31 kg, 9.06 kg, and 3.26 kg, respectively (Fig. 3). According to 4D relative model, body composition of the sample of female subjects consists of 54.70 % of water, 25.34 % of body fat, 14.68 % of protein and 5.28 % of minerals (Fig. 4).
If we make a comparison of the results between the 4D relative model in relation to working-age Belgrade women population and BU female students, it can be argued that the highest level of changes in the body composition has been established in relation to body fat (PBF 24.34 vs 30.32 %), where adult females have 16.42 % higher PBF in the body, while at the same time they have 8.02 %, 7.31 % and 7.02 % less minerals, protein and TBW, respectively [4].
According to the discussed results of this and other studies [5], there is an obvious positive effect of physical exercise in relation to body structure in the young BU female population. It is also obvious that the different conditions of life in the population of women older than 13 years or even more, and subjects from the actual study, resulted in a potentiated change in the body composition with a significant increase in the percentage of body fat, while at the same time there is a reduction of three biologically relevant tissues, i.e. minerals, water, and protein [4, 19].
Previously published American study dealing with changes in body structure in first-year students have shown that, despite excellent conditions for physical exercise within the college, which students had at their disposal, body weight, percent of body fat and BMI in students during the first year of studies increased by 1.28 kg, 0.20 % and 0.47 kg·m–2, respectively [10]. The second study [12] found that besides increasing all morphological status variables during the first year of the study, during the summer break, the trend continuously increased in all observed variables (BM increased by 1.3 kg during the school year and increased by 0.1 kg through the summer holiday; PBF increased during the school year by 0.9 % and increased further by 1.7 % through the summer holiday;
while BMI increased by 0.8 kg·m–2 during the summer break). These results only testify how much the body composition of young adult females, whether they are of the same or similar age, or different age generations, is sensitive to all-life effects.
Based on the results of statistical differences between groups in relation to BMI values (Table 1) it can be concluded that statistically significant differences exist at all subgroups for BF and PBF (%) which proves that the fat components of the body (absolute and relative) are the main factor of body structure differences in young women. In the relation to the other three body composition components, i.e. TBW, Proteins, and Minerals, regardless to absolute and relative aspects, statistically significant differences were found among almost all groups, with some BMI subgroups pairs where differences have not been statistically significant (Table 1).
In general, it can be concluded that 80.14 % of female students of the University of Belgrade belong to the category of optimal BMI value, where the prevalence of overweight and obesity is at the level of 12.77 % (9.64 and 3.13 %, respectively). It should be noticed that underweight prevalence is at the level of 6.85 % (Fig. 1). According to the PBF criteria, the prevalence of obesity is 15.60 %, while 2.4 % of BU female student population is in the essential and no essential fat class (Fig. 2). Also, according to the results of regression analysis (Fig. 5), it should be noticed that relation between BMI and PBF(%) is statistically significant at 57.46 % of mutual relation (Adj. R2 = 0.5746, F ANOVA = 1162, p = = 0.000, Standard Error = 4.59 % of body fat). The trend of body fat increase per 1 kg·m–2 of BMI was between 1.5496 to 1.5181 % depending on the regression model (Fig. 5).
Conclusion
In relation to the obtained results it can be argued that the average basic morphological characteristics of the respondents as criteria sample of female BU students were: BH = 168.3 ± ± 6.7 cm, BM = 62.2 ± 10.7 kg, BMI = 22.02 ± ± 3.6 kg·m–2, and PBF = 25.34 ± 7.16 %.
Based on the results of the BMI prevalence, it can be argued that 6.85 % of female students are underweight, 80.14 % have a normal BMI value, 9.64 % are overweight and only 3.13 % are obese. Considering percent of body fat (PBF) as a criteria of nutritional status, 0.5 % of female students had PBF under the essential biological level (below the 10.0 % limit), 1.9 % had PBF at an essential level, 19.4 % had at the level of athletes, 33.3 % had fitness level of PBF, 29.4 % had normal body fat level, and the percent of the sample in the obese category was as high as 15.6 %.
The results of 4D absolute body composition model have shown that the measured female sample has an average level of total body water, total body fat mass, protein mass and mineral mass in the body at the level of 33.75 L, 16.31 kg, 9.06 kg and 3.26 kg, respectively. According to 4D relative model, body composition of the sample of female subjects consists of 54.70 % of water, 25.34 % of body fat, 14.68 % of protein and 5.28 % of minerals.
Based on the results of this study, it can be concluded that the morphological status of the female students of the University of Belgrade is at the level of persons with normal BMI, but with twice as big prevalence of underweight (6.85 %), i.e. malnutrition, than obesity (3.13 %), i.e. overnutrition.
Acknowledgment
The paper is a part of the project “Effects of the Applied Physical Activity on Locomotor, Metabolic, Psychosocial and Educational Status of the Population of the Republic of Serbia”, number III47015, funded by the Ministry of Education, Science and Technological Development of the Republic of Serbia – Scientific Projects 2011–2019 Cycle.
References Structural body composition profile and obesity prevalence at female students of the University of Belgrade measured by multichannel bioimpedance protocol
- American Council on Exercise. Available at: https://www.acefitness.org/ (accessed 13.02.2019).
- Azizi M., Aghaee N., Ebrahimi M., Ranjbar K. Nutrition Knowledge, the Attitude and Practices of College Students. Facta Univ Phys Educ Sport, 2011, vol. 9, no. 3, pp. 349-357.
- Bankovic V., Dopsaj M., Terzic Z., Nesic G. Descriptive Body Composition Profile in Female Olympic Volleyball Medalists Defined Using Multichannel Bioimpedance Measurement: Rio 2016 Team Case Study. Int J Morphol, 2018, vol. 36, no. 2, pp. 699-708. DOI: 10.4067/S0717-95022018000200699
- Djordjevic-Nikic M., Dopsaj M., Rakic S. et al. Morphological Model of the Population of Working-Age Women in Belgrade. Physical Culture (Belgrade), vol. 67, no. 2, pp. 103-112. DOI: 10.5937/fizkul1302103D
- Dopsaj M., Ilic V., Djordjevic-Nikic M. et al. Descriptive Model and Gender Dimorphism of Body Structure of Physically Active Students of Belgrade University: Pilot Study. Anthropologist, 2015, vol. 19, no. 1, pp. 239-248. DOI: 10.1080/09720073.2015.11891658.
- Dopsaj M., Markovic M., Kasum G. et al. Discrimination of Different Body Structure Indexes of Elite Athletes in Combat Sports Measured by Multi-Frequency Bioimpedance Method. Int J Morphol, 2017, vol. 35, no. 1, pp. 199-207. DOI: 10.4067/S0717-95022017000100033.
- Dopsaj M., Markovic S., Jovanovic J. et al. BMI: Analysis of the Population Indicators in Working Population of the Republic of Serbia in Relation to Gender and Age. Physical Culture (Belgrade), 2018, vol. 72, no. 2, pp. 148-160. DOI: 10.5937/fizkul1802148D
- Finucane M., Stevens G.A., Cowan M.J. et al. National, Regional, and Global Trends in Body-Mass Index Since 1980: Systematic Analysis of Health Examination Surveys and Epidemiological Studies With 960 Country-Years and 9.1 Million Participants. Lancet, 2011, vol. 377, pp. 557-567. DOI: 10.1016/S0140-6736(10) 62037-5
- Heyward V., Stolarczyk L. Applied Body Composition Assessment. Champaign, IL: Human Kinetics. 1996.
- Hoffman D., Policastro P., Quick V., Lee S-K. Changes in Body Weight and Fat Mass of Man and Woman in the First Year of College: A Study of the "Freshman 15". J Am Coll Health, 2006, vol. 55, no. 1, pp. 41-45. DOI: 10.3200/JACH.55.1.41-46
- Huang T.T.K., Harris K.J., Lee RE. et al. Assessing Overweight, Obesity, Diet, and Physical Activity in College Students. J Am Coll Health, 2003, vol. 52, no. 2, pp. 83-86. DOI: 10.1080/07448480309595728
- Hull H., Morrow M., Heesch K. et al. Effects of the Summer Months on Body Weight and Composition in College Woman. J Women's Health, 2007, vol. 16, no. 10, pp. 1501-1515. DOI: 10.1089/jwh.2006.0329
- InBody 720 The Precision Body Composition Analyzer: User's Manual, 1996-2005 Biospace Co., Ltd., Korea: Gangnam-gu, Seoul.
- Kelly T., Yang W., Chen C-S. et al. Global Burden of Obesity in 2005 and Projections to 2030. Int J Obesity, 2008, vol. 32, pp. 1431-1437. DOI: 10.1038/ijo.2008.102.
- Klemenc-Ketis Z., Kersnik J., Eder K., Colariè D. Factors Associated With Health-Related Quality of Life Among University Students. Serb Arch Med, 2011, vol. 139, no. 3-4, pp. 197-202. DOI: 10.2298/SARH1104197K
- NCD Risk Factor Collaboration (NCD-RisC). Trends in Adult Body-Mass Index in 200 Countries from 1975 to 2014: A Pooled Analysis of 1698 Population-Based Measurement Studies With 19.2 Million Participants. Lancet, 2016, vol. 387, no. 10026, pp. 1377-1396. DOI: 10.1016/S0140-6736(16)30054-X
- Nola I.A., Jelinic J.D., Matanic D. et al. Differences in Eating and Lifestyle Habits Between First and Sixth-year Medical Students from Zagreb. Coll Antropo, 2010, vol. 34, no. 4, pp.1289-1294.
- Perusse-Lachance E., Tremblay A., Drapeau V. Lifestyle Factors and Other Health Measures in a Canadian University Community, Appl Phys Nutrit Metab, 2010, vol. 35, no. 4, pp. 498-506. DOI: 10.1139/H10-035
- Rakic S., Dopsaj M., Djordjevic-Nikic M. et al. Profile and Reference Values for Body Fat and Skeletal Muscle Mass Percent at Females, Aged from 18.0 to 69.9, Measured by Multichannel Segmental Bioimpedance Method: Serbian Population Study, Int J Morphology, 2019, vol. 37, no. 4, pp. 1286-1293. DOI: 10.4067/ S0717-95022019000401286
- Saraykin D.A., Khusnutdinova A.A., Pavlova V.I. et al. Adaptation of Professional Athletes to Various Physical Loads by Means of Body Composition Changes. Human. Sport. Medicine, 2018, vol. 8, no. 3, pp. 47-59. (in Russ.) DOI: 10.14529/hsm180305
- Sillanpää E., Cheng S., Häkkinene K. et al. Body Composition in 18-to 88-year-old Adults - Comparison of Multifrequency Bioim-pedance and Dual-Energy X-ray absorptiometry. Obesity, 2014, vol. 22, no. 1, pp. 101-109. DOI: 10.1002/oby.20583
- Tarnus E., Bourdon E. Anthropometric Evaluations of Body Composition of Undergraduate Students at the University of La Reunion. Advances Phys Educ, 2006, vol. 30, no. 4, pp. 248-253. DOI: 10.1152/advan.00069.2005
- Wardle J., Haase A.M., Steptoe A. Body Image and Weight Control in Young Adults: International Comparisons in University Students from 22 Countries. Int J Obesity, 2006, vol. 30, pp. 644-651. DOI: 10.1038/sj.ijo.0803050
- World Health Organization. Global Status Report on Noncommunicable Diseases 2014. WHO: Geneva, Switzerland, 2014.
