Structural dynamics of the economy: impact of investment in old and new technologies

Author: Sukharev Oleg S., Voronchikhina Ekaterina N.
Journal: Economic and Social Changes: Facts, Trends, Forecast @volnc-esc-en
Section: Socio-economic development strategy
Article in issue: 4 т.13, 2020.
Free access
The purpose of the study is to determine the degree of impact of investment in technological renewal on economic growth, to establish the ratio of the contribution of investment in old and new technologies to the growth rate. This problem is solved when considering the GDP structural dynamics by expenditure in the case of the United States, Germany, Russia and China. The research methodology is based on structural analysis, which establishes a “structural formula” assessing the contribution of investment in new and old technologies to the growth rate of the economy, as well as the contribution of other GDP components by expenditure. This approach allows us to distinguish the existing models of economic growth in the countries under consideration - consumer, investment, mixed models and technological development modes according to the sensitivity of the overall technological economy to investment in new and old technologies. Investment in new technologies is understood as investment in technological innovations, and the overall technological efficiency of the economy is determined by the ratio of the volume of innovative goods shipped and the volume of non-innovative goods, works, and services. The investment breakdown method helps to assess the contribution of investment in new technologies to economic growth, both in a comparative way relative to other GDP components, and for the considered countries. The result of the study is the identification of the economic growth model by the largest contribution to GDP component in the period under review, the contribution to the rate of investment in new and old technologies, as well as the determination of the sensitivity of technology to investment in new and old technologies in the United States, Germany, China and Russia. The analysis found that the impact of investment on the GDP dynamics and the level of technology is not synchronized, which requires to change the approach to macroeconomic policy, aimed not only at stimulating investments as a driver of growth, but also their distribution in such a way which would lead to an increase in the technology of the economy together with changing the institutions.
Gdp structure by expenditure, investment, old and new technologies, manufacturability, economic growth,
Short address: https://sciup.org/147225481
IDR: 147225481 | UDC: 330.5, | DOI: 10.15838/esc.2020.4.70.4
Text of the scientific article Structural dynamics of the economy: impact of investment in old and new technologies
The structural dynamics of the economy is covered by the problem of growth with permanent changes in elements of the economic structure, and the growth of these elements is determined by their interaction and mutual influence. This vision of economic changes has not been reflected in economic growth theories for a long time [1]. The problem was not only the complexity of the phenomenon and the long-term nature of structural changes, but also the fact that the aggregate approach in growth modeling prevailed over the structural representation. Industry shifts, measured by labor movement, or skill changes, or industry diversification models [2], due to the effect of productivity [3–5] have only recently been used, not to mention taking into account the effect of structural reforms or integration on economic growth [6; 7] or the effect of effective structural changes on growth [8]. Schumpeter’s direction in economic science over the past quarter of a century made it possible to take into account technological and institutional changes in its impact on economic growth [9–11].
Structural dynamics began to be presented in models that are not focused on a long period, since rapid changes in technologies and institutions affect the rate of development of economic elements that contribute to the overall dynamics in a period of rapid global changes [12].
Thus, economic growth can be decomposed by the contribution of elements of the economic structure to the overall rate, tracking short-term changes. Each element, its share in the economy, and its dynamics are influenced by factors that can act together or separately. In particular, lowering the interest rate can increase gross consumption and boost investment, but worsen, for example, the country’s export position through the mechanism of foreign exchange inflows and the strengthening of the national currency, which will constrain exports and reduce the cost of imports. Accordingly, the ratio of the contribution of gross consumption and investment to the rate of economic growth, as well as net exports, will change. Structural reforms, carried out simultaneously, can somehow strengthen or weaken this process by changing the contribution of the GDP component to the overall dynamics. In addition to changing the contribution and the rate of gross investment, its structure also changes. This aspect is very poorly considered in models of technological changes and economic growth [2; 13], and economic diversification does not always reduce development risks [14] and contributes to the progress in the technology field [15]. The structure of investments becomes a determining factor in influencing economic dynamics and technological changes.
Let us review the problem of determining the contribution of investments in new and old technologies to the rate of economic growth, as well as determining the modes of technological development according to the sensitivity of the economy producibility to each type of investment. The solution to this task, undertaken below, will allow identifying not only structural, macroeconomic growth policies in the strategic dimension but also creating diagnostic tools in structural dynamics for studied countries (the USA, Germany, Russia, and China) in the current mode of technological development.
Research methodology. Structural analysis of GDP dynamics and economy producibility
The structural dynamics of the economy can be determined by changing the elements of the aggregate indicator, which is a generalized characteristic of this dynamics, GDP in particular. Modern development is expressed in its permanent increase, but its components change their share in GDP value and the rate of dynamics, which affects the value of the overall rate of economic growth. By changing the ratio of the shares of GDP components and its rate, it is possible to assess structural changes that take place, and to investigate the problem of structural dynamics and economic growth. However, we note that each GDP component is very heterogeneous. In particular, investments are made in various types of activities, projects and technologies, so the investment structure also changes permanently and has an impact on the rate of economic growth.
We understand new technologies as newly created advanced technologies, and we consider previosly used technologies to be old ones1. Producibility, in the strict sense, should be understood as a possibility of obtaining the same result but with lower costs, which can be achieved by using more advanced or completely new technology for the studied time interval. Moreover, at the initial stage of applying the technology, these issues usually grow due to the high cost of the technology, but then they pay off with wide opportunities for using this new technology. However, within the task of quantitative assessment of producibility, we apply the “level of producibility” indicator, which can be defined as the ratio of the volume of shipped goods and services created using new innovative technologies to a total volume of goods and services related to non-innovative ones2. The distribution of investments can be represented between new and old technologies. It is this distribution that can be used to characterize technological renewal, since it has a certaineffect on producibility – the creation of benefits on new and old technologies. In this case, gross investment as a component of GDP can be represented as the sum of investments in new and old technologies, namely I = In + Is. GDP Y = С +1 + G + Nx, representing the sum of gross consumption (C), investment (I), government spending (G) and net exports (Nx) will be written as Y = C + In + Is + G + Nx. By differentiating both expressions for GDP by expenditure, we obtain structural formulas that allow estimating the contribution of each GDP element to the rate of economic growth. The structural formula with total investments will be the following:
g = gc * c + gl * i + gG * a + q)
+ gNx*b ’ where:
= = @® ; == = . =' = (9(3
== = (9(3 ^ = (3® -GDP growth rates and its component;
C . I G Nx , , , ......
c = -, t = -, a = -, b = — — structural GDP parameters by expenditure, the share of gross consumption, investment, government spending and net exports respectively.
g = gc * c + gin *n + gls * s +
+ gG * a + gNx * b , (2)
where:
9 m, g is are the growth rate of investment in new and old technologies respectively, n, 5 are shares of new investments (n = у) and old (s = у ) technologies in GDP.
Expressions (1)–(2) are the “structural formula” that allows estimating the contribution of each GDP component to the rate of economic growth.
According to structural formulas (1) and (2), it is clear that each GDP component contributes to the country’s economic growth rate. We would like to note that this contribution changes, and we may talk about the dominance of a particular GDP component at a certain interval in terms of its contribution to the growth rate. As the contribution changes over time, so does the dominance of components. If the main contribution of growth rate is made by gross consumption, we can talk about the consumer model of economic growth, if investment spending – about the investment growth model. If net exports dominate the contribution, then there is a foreign economic growth model. Provided that government spending will make the main contribution to the growth rate, although this is not a typical case for the countries, this will be growth model at the expense of the public sector. In any case in the theoretical sense it is possible only in terms of assessing the impact of the considered components. In case when it is not possible to determine the dominant value of any component, its contribution to the time interval is mixed, we can talk about a mixed growth model without an explicit dominant. In order to influence economic growth, looking for economic policy tools, it is not superfluous to assess the range of these components and factors that affect their dynamics and share in GDP. Without a doubt, changing GDP components can show coherent dynamics and have the same reasons for their change. For example, if the percentage decreases, both investment and consumption can increase. However, it is not a fact that investments will increase in the same way as new and old technologies. It depends on the size of the interest rate offset, its initial level and other institutional conditions that affect the process of technological substitution.
Occuring changes usually cover all elements of the structure and, therefore, the ratio of investments in new and old technologies constantly changes. Moreover, the ratio may change in different ways with this dynamics of the total investment value.
Thus, total investments grow, and the structure of investment distribution in new and old technologies, for example, is maintained with a corresponding increase in the value of each investment. However, the distribution structure may change as the total investment increases or decreases. It is also quite possible that the total amount of investment does not change, but the structure of investment distribution between old and new technologies changes. Similar changes can occur not only when total investment increases, but also when it decreases. No matter how the investment distribution schemes change, they undoubtedly affect the process of technological renewal, that is how old technologies are replaced by new technologies. Technological renewal affects the process of creating new types of goods and its effectiveness. The scale and speed of production, in turn, also depend on how investments are distributed, and the distribution is determined by the initial efficiency. Each economy has its own share of benefits generated by new technologies and investments in new technologies. In this regard, they differ in their contribution to the rate of economic growth, since the dynamism of technological renewal also depends on many institutional conditions and the initial increased technological potential.
Expression (2) can be converted to the following form, taking into account the structure of investments in “new-old” technologies. Then it is possible to write that:
dI T d y dIs „ x — = Is — +-- (1 + у )
dt dt dt
In
Y = Is dY dt
d is
is
= Y (gi n - g is )
.
Is = —
I Is Y
I = Is + In = (1 + y ) Is
Considering (3), the structural formula (2) is rewritten as:
д = 9 1П * (1 + У) * У * i s * di s +
+ g is * (1 + У) * i s * di s + . (4) + gc * c + gG * a. + gNX * b
From expression (4), which differs from expression (2) only by writing, it follows that the contribution of investments in new and old technologies to the growth rate differs and depends, first, on the value of the rate of each type of investment and secondly, on the share of investments in the total amount of investment or on the size of the investments distribution: Y = In/Is .
The growth rate of each type of investment will be determined by the current regime of technological development and renewal. This mode is determined by how much producibility will increase from ongoing investments in new and old technologies. In particular, the most significant value is the increase in producibility from the implementation of investments in new technologies. It is quite possible that investments in new technologies do not lead to a significant increase in producibility, which is more influenced by investments in old technologies. This suggests that the economy is hampered by technological replacement and renewal processes for one reason or another.
If the share of investments in new technologies depends entirely on the amount of investment in new technologies, i.e. how it is possible to increase investment in new technologies, the growth rate of such investments will depend on the rigidity of the institutions that regulate decisions on technology replacement. In addition, credit institutions, the motives of agents to switch to new technologies, the availability of these new technologies before their practical implementation, as well as the readiness of all parts of the economy to accept such technological innovations will affect both the emerging mode of technological development and the amount of investment in new technologies and their dynamism. Increased investments in new technologies may lead to the increase of the overall level of technology, but it may not lead to a significant increase. The same applies to investments in old technologies. Thus, the following technological development regimes can be distinguished according to the sensitivity of technology to investments in new and old technologies ( Tab. 1 ).
The increase of investments in old technologies can boost the overall technological level of the economy and hinder it in new technologies. In this case, the overall producibility may increase. In this regard, the modes called “leadership” and “rapid progress” suggest that technology increases. Moreover, main contribution to the increase should be made by investments in new technologies, especially for the “leadership” mode of technological development. The growth of investments in old technologies in this mode acts in the direction of reducing the producibility, but the overall producibility increases. In this case, this increase is solely caused by new technologies, and the mechanism for replacing old technologies with new ones also works at the level of investment. When developing under the “renunciation” mode, the growth of investments in new technologies does not increase producibility – it decreases, and investments in old technologies act in the direction of increasing producibility. In this case, the overall producibility may increase. We see a technological rapid progress, when both types of investments contribute to improving the technological level. Here is the elasticity of producibility for each type of investment, which characterizes which type of investment provides a greater increase in producibility. Given the fact that this mode of technological development is designated as a “rapid progress”, investments in new technologies should have a greater impact on improving overall producibility. If the growth of investments in new and old technologies does not lead to the increase in the producibility of
Table 1. Main modes of technological development of the economy in terms of sensitivity to the elements of the investment structure
|
Investment growth In, Is |
Producibility (increase / decrease) |
|||
|
Leadership |
Renunciation |
Rapid progress |
Degradation |
|
|
In |
Increase |
Decrease |
Increase |
Decrease |
|
Is |
Decrease |
Increase |
Increase |
Decrease |
|
Source: own compilation. |
||||
the economy, then this regime can be described as technological degradation. A high level of technological backwardness, significant costs, and low efficiency are characteristics of this mode of technological development.
Using the proposed matrix of main technological regimes in Table 1, it is possible to rank countries or individual regions by the type of technological regime, linking it to the model of economic growth.
The increase of the technological level has a lot of aftereffects, so investments alone are not enough. In addition, there may be a saturation effect – when the increase of the technological level becomes more difficult to achieve further due to growing costs, expanding needs for new investments, and increasing institutional development problems. Emerging imbalances on labor and capital markets also act in the same way, affecting technological renewal.
The initial technological level also determines the dynamism and efficiency of the economy and the possibility of replacing it with technology. The process of replacing technologies is focused on the expected revenue, payback, which depends on the current technological capabilities and the state of markets.
Presented structural analysis is useful not only for identifying a specific economy from a point of view of its implemented growth model but also for technological development. It can also be used in comparative studies while comparing the results of countries’ economic development, for obtaining forecast in the field of technology development and the quality of economic growth, the structure of the economy. It can be used for verification of macroeconomic policy measures, since the identification of the growth and technological development model makes it possible to coordinate the methods of sectoral and macroeconomic impacts, which often conflict with each other.
Next, we will overview the application of the presented approach on the example of the largest players in the global dynamics: the United States, Germany, China, and Russia as an important player in modern global competition in some technological areas. We will perform a structural analysis of GDP dynamics according to the received expression (2), taking into account the structure of investments – the division of investments into investments in technological innovations and other investments, as the difference between gross investments and investments in technological innovations (they are considered investments in old technologies). Then we will analyze the sensitivity of technology, which is understood as the ratio of the volume of innovative goods and services shipped to the value of non-innovative products, to investments in new and old technologies, which will allow identifying the current model of technological development of each country. The result of the analysis is an assessment of the impact of the investment structure and technological renewal on countries’ economic growth, showing different economic dynamics and characterized by different levels of technological development.
Comparative analysis of structural dynamics of the USA, German, Chinese, and Russian economies
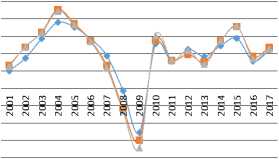
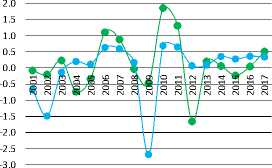
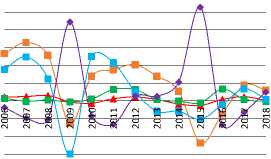
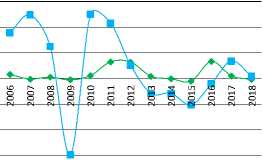
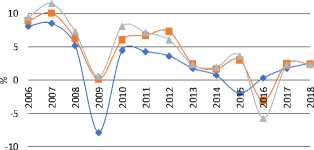
Let us present the structural dynamics of GDP in the following countries: the United States, Germany, China, and Russia in the period of 2001–20173 (Fig. 1–4)4, separately highlighting the change in the contribution of investments in new and old technologies (Fig. 1–4, in the center) and evaluating the accuracy of calculation (Fig. 1–4, right), comparing the calculation using “structural formulas” (1) and (2) with the actual data on the growth of these countries’ economies. For China and Russia, the deviation of calculated values from actual values is the most significant, which can be associated with the quality of data
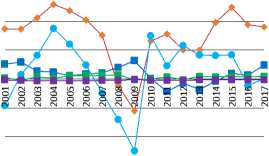
— ♦ — gC*c — ■ — gG*a — ■ — gIn*n
—•— gIs*s — ■ — gNx*b
Figure 1. Structural dynamics of GDP by component (left), investment contribution (center), and calculation accuracy (right), USA, 2001–2017
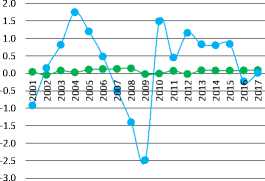
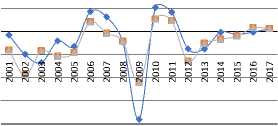
—•— gIn*n —•— gIs*s
-1
-2
-3
-4
— ♦ — empirical
■ calculation by the formula: g = gС*c + gIn*n + gIs*s + gG*a + gNx*b calculation by the formula: g = gС*c + gI*i + gG*a + gNx*b
Source: World Bank data. Available at:
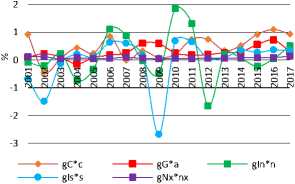
Figure 2. Structural dynamics of GDP by component (left), investment contribution (center), and calculation accuracy (right), Germany, 2001–2017
2.5
—•— gIn*n —•— gIs*s

-4
-6
— ♦ — empirical
■ calculation by the formula: g = gС*c + gIn*n + gIs*s + gG*a + gNx*b
—*— calculation by the formula: g = gС*c + gI*i + gG*a + gNx*b
Source: Eurostat data. Available at:
Figure 3. Structural dynamics of GDP by component (left), investment contribution (center), and calculation accuracy (right), China, 2001–2017
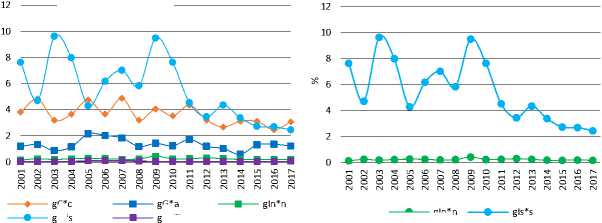
gIn*n gC*c gIs*s gG*a gNx*b
Source: World Bank data. Available at:
empirical calculation by the formula: g = gС*c + gIn*n + gIs*s + gG*a + gNx*b calculation by the formula: g = gС*c + gI*i + gG*a + gNx*b
-2
-4
-6
— ■ — gC*c
— ■ — gIs*s
—*— gG*a
— ♦ — gNx*b
Figure 4. Structural dynamics of GDP by components (left), investment contribution (center), and calculation accuracy (right), Russia, 2006–2018
-2
-4
-6
— ♦ — gIn*n — ■ — gIs*s
—•— GDP growth rate
— ■ — calculation by the formula: g = gС*c + gIn*n + gIs*s + gG*a + gNx*b calculation by the formula: g = gС*c + gI*i + gG*a + gNx*b
-8
Source: Rosstat data. Available at: or with peculiarities of its presentation. For Germany and the United States, the accuracy of the calculation is quite high.
Figure 1 shows that the USA has developed a consumer growth model over the period, since gross consumption contributes mainly to economic dynamics. The second most important contribution is made by investments in old technologies. Investment in new technologies contributes very little to the growth rate.
The German economy had been characterized by the mixed model of economic growth before 2012, which does not show a single dominant component of GDP as a contribution to the growth rate. However, the peculiarity is that investments in new technologies make the main contribution to the rate of economic growth in Germany in certain years. Over a significant period of time, the contribution to the growth rate of investments in new technologies is comparable to or higher than the contribution to the growth rate of investment in old technologies. Since 2012, gross consumption has become dominant in terms of its contribution to the growth rate, and the contribution of investments in old technologies has become higher than the contribution to the growth rate of investments in new technologies. Thus, it can be argued that the consumer growth model in the United States and Germany has been characterized by a higher contribution to the rate of investments in old rather than new technologies since 2012.
In the Chinese economy, the investment model of economic growth has developed, since it is investments that make the greatest contribution to the growth rate. However, the contribution to the rate of investments in old technologies is much higher than the contribution to the growth rate of investments in new technologies. It is noteworthy, in contrast to the United States, that government spending makes a significant contribution to China’s growth rate. However, the fundamental contribution to the growth rate is made by investments in old technology, which is a symbol of development of traditional sectors of the Chinese economy.
Averagely, the growth rate of the Russian economy was higher than the growth rate of the US and German economies in 2006–2017. According to figure 4 (left), Russia is characterized by the consumer-mixed model of economic growth, and there are years when gross consumption completely dominates in the contribution to the growth rate, and there are only three years in the studied period when the main contribution is made by investments in the growth rate. In 2009 and 2015 crisis years, the main contribution to the growth rate was made by net exports, acting as a component of resistance to the crisis. In 2016, the main contribution to the growth rate was made by investments in new technologies, which is associated with local support for innovation and the implementation of appropriate programs for the modernization of the Russian economy. However, these priority implementations did not significantly increase the overall producibility of the Russian economy (Fig. 5).
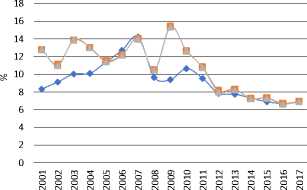
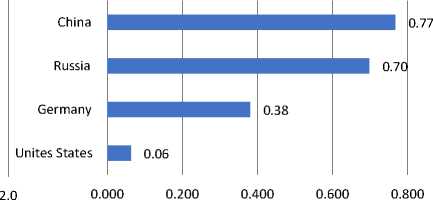
Figure 5 provides an overview of the overall producibility in the countries. As we can see, the highest level is demonstrated by Germany, for which investments in new technologies make the greatest contribution to the economic growth rate. The USA is inferior to it. The producibility of China and Russia coincide in 2013 alone, and
Russia is inferior to China all the time according to this indicator, and, if the producibility in Russia had been increasing until 2013, it has been averagely declining since 2013. There are increase and decrease periods of producibility in Germany, but the value of this indicator is about 2.5 times higher than in Russia.
In addition to the amount of investment in new and old technologies, studied countries differ in the sensitivity of producibility to investments in new and old technologies. Next, an econometric analysis was undertaken that allowed distinguishing link models between producibility and investments in new and, separately, in old technologies (Fig. 6–9) .
The United States’ economy shows the dependence on investments in new and old technologies as the main factors for increasing the producibility. It should be noted that, in terms of investments in old and new technologies, the United States is an undisputed leader among studied countries, investing from
Figure 5. Producibility in the United States, Germany, China and Russia, 2009–2018
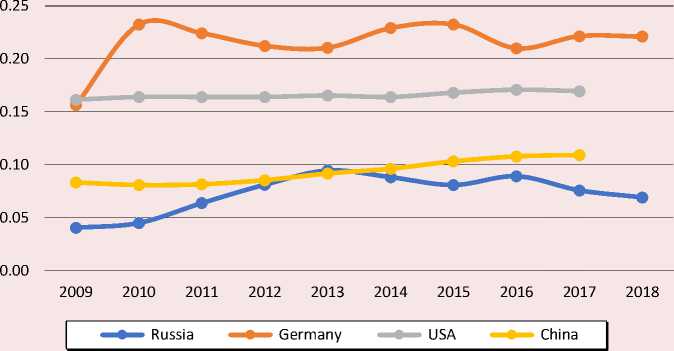
Source: World Bank data. Available at: ; Eurostat data. Available at: eurostat/data/database; Rosstat data. Available at: ; данные The Bureau of Economic Analysis data. Available at: ; National Bureau of Statistics of China data. Available at:
2 to 3 trillion US dollars annually in old and from 400 to 500 billion US dollars in new technologies5. The second position is occupied by China, investing from 2.5 to 4 trillion annually in old technologies and from 100 to 220 billion US dollars in new technologies.
Germany invests 530–650 billion US dollars in old technologies, and 90–120 billion US dollars in new technologies. Russia is inferior to all studied countries, having the smallest amount of investment in old and new technologies –
400 billion and 18 billion dollars, respectively. It is less than China’s investments, 2–6 times less than Germany’s, and more than 20 times less than the United States’ investments in new technologies.
The German economy highly depends on investments in new technologies to improve its producibility and less – on investments in old technologies (Fig. 7) . Both types of investments act in the direction of increasing overall producibility.
Figure 6. Producibility and investment in new technologies* (left) and old** (right) technologies in the United States, 2009–2017, in 2010 prices
0.172
ɣ = 0.0001 * In + 0.12 • ♦
0.170 R2 = 0.82 •
5- 0.168 R2adj = 0.79 ---------------------1------------
0.166 __________________________________ * ♦ ______________
0.164 ----------------------------*--
0.162
0.160
300 350 400 450500
Investment in new technology, constant 2010 bln US$ empirical ♦ model
0.172 ɣ= 0.00000001 * Is^2 - 0,00002 * Is + 0.2•
0.170 R2 = 0.84*
1 0.168 R2adj= 0.82________________________^4_____
0.166
0.164 ----------------------------et—*—*-----
♦
0.162 ----------------------------------------j-------------------------
0.160 0 500 1 000 1 500 2 000 2 500 3 000 3 500
Investment in new technology, constant 2010 bln US$ empirical ♦ model
* Model statistics: F-test = 33, D-Wcalculation = 2.6 Є [1.32; 2.68], White test: χ2 calculation = 1.17, χ2 crit. = 15.5
** Model statistics: F-test = 18.6, D-Wcalculation = 1.7 Є [1.32; 2.68], White test: χ2 calculation = 2.25, χ2 crit. = 15.5 Source: World Bank data. Available at:
Figure 7. Producibility and investments in new* (left) and old** (right) technology in Germany, 2009–2017, in 2010 prices
|
0.25 |
♦ |
||
|
0.20 |
|||
|
• |
ɣ= 0.001 * In^(0.47) |
||
|
R2 = 0.91 |
|||
|
0.10 |
R2adj = 0.9 |
||
|
0.05 |
0.00
80 000 90 000 100 000 110 000 120 000
|
0.25 |
t t» « |
♦t |
||
|
♦ |
||||
|
n 1 c |
• |
ɣ= 0.2 * Is^(0.006) |
||
|
R2 = 0.85 |
||||
|
0.10 |
R2adj = 0.83 |
|||
|
0.05 |
||||
0.00
500 000 530 000 560 000 590 000 620 000 650 000
Investment in new technology, constant 2010 mln US$
Investment in new technology, constant 2010 mln US$
♦ empirical о model
• empirical о model
* Model statistics: F-test = 11.7, D-Wcalculation = 2 Є [1.32; 2.68], White test: χ2 calculation = 0.22, χ2 crit. = 15.5 ** Model statistics: F-test = 5.7, D-Wcalculation = 1.7 Є [1.32; 2.68, White test: χ2 calculation = 0.09, χ2 crit. = 15.5 Source: Eurostat data. Available at:
Figure 8. Producibility and investments in new* (left) and old** (right) technology in China, 2009–2017, in 2010 prices
0.12
ɣ = 0.0003 * In + 0.05 . • •
0.10 R2 = 0.93 + 0.05
0.08 R2adj = 0.92 ♦ ♦♦ -------------------------
0.06
0.04
0.02
0.00
0 50 100 150 200 250
Investment in new technology, constant 2010 bln US$ с empirical • model
0.12
ɣ= 0.00000002 * Is^2 - 0.0001 * Is + 0.2
0.10 R2=0.99 .0001 Is + 0.2
S 0.08 R2adj= 0.99----- ♦ ♦ ♦ ♦ -------------------
0.06
0.04
0.02
0.00
0 1 000 2 000 3 000 4 000 5 000
Investment in new technology, constant 2010 bln US$
empirical
model
* Model statistics: F-test = 94.2, D-Wcalculation = 1.4 Є [1.32; 2.68], White test: χ2 calculation = 1.55, χ2 crit. = 15.5 ** Model statistics: F-test = 923.4, D-Wcalculation = 1.7 Є [2.6; 2.68], White test: χ2 calculation = 0.39, χ2 crit. = 15.5 Source: World Bank data. Available at:
0.10
0.09
0.08
0.07
0.06
0.05
0.04
0.03
0.02
0.01
0.00
Figure 9. Producibility and investments in new* (left) and old** (right) technology in Russia, 2009–2017, in 2010 prices
ɣ= -0.02 * In^2 + 0.85 * In - 7.28 R2 = 0.6
R2adj = 0.56
15 16 17 18 19
Investment in new technology, constant 2010 bln US$
Investment in new technology, constant 2010 bln US$
empirical О model
empirical
model
China’s economy has shown the increase of producibility with increased investment in new and old technologies (Fig. 8) , although there were more investments in old technologies than in new technologies.
As it is shown in Figure 9, in the Russian economy, in 2009–2017, a certain increase of investments in old technologies increased producibility and then led to its decline. The increase of investments in new technologies was accompanied by a general decline of the producibility. The reasons are, presumably, the low sensitivity of technological chains due to their existing gaps to investment in new technologies and its insufficient scope.
Therefore, there was a period when the producibility increased due to investments in old technologies, and it decreased while investing in new and old technologies.
Since there is the growth of investments in new technologies with the reduction of overall producibility in the Russian economy, and the increase of investments in old technologies takes place with the growth and decline of producibility, the nature of technological development is between “renunciation” and
“technological degradation” modes (Tab. 2) . Moreover, there is a movement from one mode to another.
The Chinese economy demonstrates the “breakthrough” type of technological development mode. Due to the fact that, in the German economy, investments in new technologies have the greatest impact on technological growth, and investments in old technologies have almost no effect on increasing producibility, this regime can be classified as the “technological leadership” type (Tab. 2). The United States has seen the increase of producibility from two types of investments, but this growth is not high, which is typical for the “technological leadership” regime, and the breakthrough can only be observed in certain technological areas. Thus, in the United States, in general, two modes of technological development are combined.
According to Table 2, which shows the current model of the economic growth and technological development for each country, leadership in the field of technological development is provided with the mixed and consumer growth model, the technological breakthrough is characteristic of the investment growth model. The loss of positions and technological degradation are evident for the consumer-mixed growth model. Despite the existing conditionality of regime allocation, however, the technological breakthrough is characteristic of the investment model of economic dynamics. Other modes of technological development can be manifested in different models of economic growth.
An average annual growth rate in Russia was second after China’s (Tab. 3) in 2001–2017. However, the stability of growth, measured by
Table 2. Economic growth models and technological development regimes in the USA, Germany, China, and Russia
|
Country |
Economic dynamics model* (according to Fig. 1–4) |
Sensitivity of producibility to investments in new technologies |
Sensitivity of producibility to investments in old technologies |
Technological development mode** (according to Fig. 6–9) |
|
Unites States |
Consumer |
Investment growth – producibility growth (minor) |
Investment growth – producibility growth (minor) |
Leadership / rapid progress |
|
Germany |
Mixed |
Investment growth – producibility growth (strong influence) |
Investment growth – producibility weak growth (weak impact) |
Leadership |
|
China |
Investment |
Investment growth – producibility growth |
Investment growth – producibility growth |
Rapid progress |
|
Russia |
Consumer mixed |
Investment growth – reduced producibility |
Investment growth – reduction and slight increase in producibility |
Renunciation / Degradation |
|
* Economic dynamics models for the USA, Germany, China for 2001–2017, for Russia – from 2006–2018 due to available data for the relevant years. ** Technological development regimes are highlighted for countries in the period of 2009–2017 due to the availability of data for the indicated years at the time of the study. Source: own compilation according to Fig.1–9 and Tab. 1. |
||||
Table 3. Average annual growth rate and its sustainability, 2000–2018
Average annual GDP growth rate, % The standard deviation of the change in GDP per capita constant 2010, $ Russia 3.77 1 932.09 Germany 1.41 3 284.1 United States 2.07 912.3 China 9.14 222.4 Source: World Bank data. Available at: ; Eurostat data. Available at: ; Rosstat data. Available at:
the standard deviation of per capita GDP for 2000–2018, was low (the deviation is high), unlike China and the United States. However, the innovative growth model in Germany was characterized by the greatest instability, which is inherent in the innovation dynamics.
The rate of economic growth strongly depended on the contribution to the rate of investments in new and old technologies for Germany and China; moreover, it depended more on the contribution to the investment growth in old technologies. As for the United States, the contribution of investments’ growth rate in new technologies practically did not affect the growth rate, unlike the contribution of investments in old technologies, which had a stronger impact on the growth rate. In Russia, the contribution to investments’ growth rate in new technologies hardly affected the growth rate, but the contribution of investments in old technologies significantly affected the growth rate.
In Figure 10 , there is a calculation of the sensitivity of producibility to changes in investments in new and old technologies for 2010–2017. The graph includes an indicator that expresses a change of producibility as a percentage with the increase of investments per one percentage point.
1% increase of investments in new technologies reduced the Russian economy’s producibility by 1.48%. This result requires an intensification of efforts to invest in new technologies, expanding the scope of its application and the volume of investments. Particular attention should be paid to increasing the economic environment’s susceptibility to new technologies. The producibility of German economy is especially sensitive to investments in new technologies. With 1% increase of investments in new technologies, the producibility increased by 1.5%, which is approximately equal to the decrease of the producibility of the Russian economy. In terms of producibility sensitivity to investments in new technologies, China is placed second after Germany, and the former is followed by the United States. China’s economy producibility is sensitive to investments in old technologies the most, while the Russian economy is the second most sensitive one in this aspect. Next, there is Germany with a two-fold margin and the United States with a ten-fold margin in terms of producibility’s sensitivity to investments in old technologies in relation to the Russian and Chinese economies. It led to a very interesting ratio. Investments in old technologies can make a significant contribution to GDP dynamics,
-1.48
-2.0 -1.5 -1.0 -0.5
Germany
Unites States
China
Russia
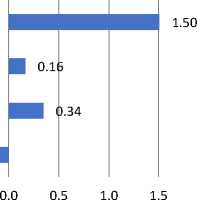
Figure 10. The sensitivity of producibility to changes in investments in new (left) and old (right) technologies, 2010–2017
1.000
∆ɣ/∆Is
∆ɣ/∆In
Source: World Bank data. Available at: ; Eurostat data. Available at: data/database; Rosstat data. Available at:
but producibility does not significantly increase. Investments in new technologies may not contribute to GDP dynamics, but it can significantly influence the increase of producibility. In Germany alone, the impact on GDP dynamics and producibility for investment in new technologies are the same. It is clear that two pairs were formed out of four countries. The first pair is Germany and the United States, where the sensitivity of producibility is high in relation to investments in new technologies and low – in relation to investments in old ones. The second pair is Russia and China, where, on the contrary, the sensitivity is high in relation to investments in old technologies and low – in relation to investments in new technologies.
Thus, an important task is to change the conditions of investment distribution between new and old technologies, change institutions, investment motives in order to change the sensitivity of producibility reaction to the incoming resource in the form of investments, etc. Therefore, a usual increase of investments to ensure growth is not enough. Moreover, the contribution to growth may take place, but producibility will not change significantly. In our opinion, this circumstance is a valuable condition for planning a growth policy, since narrowing the situation down solely to the growth rate may result in the fact that, in the future, corresponding factors might be underdeveloped and lead to the country’s competitive defeat on global market.
Conclusions
The conducted research contributes to development of the theory of economic growth and technological change by taking into account the structure of investments in new and old technologies, highlighting the modes of technological dynamics. This allows assessing not only the contribution of investments in various types of technological opportunities but also the impact of technological renewal on the growth rate. The applied value is narrowed down to an opportunity to conduct a comparative analysis of trajectories of technological development and growth for different countries and regions, taking into account the sensitivity of the technology level to investments in new and old technologies.
Summing up the results of the research, we come to the following most important conclusions that make up a certain perspective for further search work within this topic.
First, the achievement of macroeconomic development goals requires a structural analysis of the dynamics of target indicators, which is necessary to determine causes and extent of instruments’ impact on its change. Investments can accelerate growth even in the current mode, but, for example, it will not be able to quickly increase producibility, especially if investments in older technologies increase. The current proportion of investments in leading economic development countries is not in favor of investments in new technologies. However, in some countries, it makes the main contribution to the dynamics of the economy and to producibility growth, in others – the contribution to the change in dynamics and producibility is very modest. There are examples, Russia in particular, where technological growth is achieved through investments in old technologies – through its renewal.
Second, the rapid increase of investments in new technologies may have a positive impact on the contribution to the rate of economic growth, but it does not mean that producibility responds to such rapid growth and increases. It may even decline, which is clearly shown by development of the Russian economy. It creates a mismatched dynamics, when investments can have a positive impact on the growth rate but do not provide the increase of economic producibility.
Third, investments in new and old technologies can provide the technological development mode in the form of a breakthrough, i.e. significantly increase producibility and, at the same time, make a major contribution to the rate of economic growth. In this case, as it can be seen in the Chinese economy, investments in old technologies may dominate. However, investments in new technologies allow gradually taking leading competitive positions in the field of high technologies.
Fourth, investments in new technologies can make a more significant contribution to the growth rate and be an engine for increasing producibility, which is typical for Germany, despite the fact that the economic growth model is mixed. However, it clearly shows the contribution of investments in new technologies, unlike other studied countries.
Fifth, it is possible to change the impact of investments on producibility not only by increasing the volume of investments in, for example, new technologies but also by institu- tional adjustments that regulate the distribution of investments, flows, and technological renewal. Undoubtedly, the initial state of the technological basis will strongly influence the sensitivity of producibility to the increase of corresponding investments, and achieved technological level will also influence it. The higher it is, the lower the sensitivity will probably be. It could be clearly seen in the change of Germany and the United States’ producibility, which are leaders in terms of producibility.
Thus, while planning an economic growth policy, it is necessary to take into account not only the current model of economic dynamics with an assessment of the behavior of structural elements but also take into account the sensitivity of producibility to the formed investment structure in the era of rapid technological changes. In other words, it is necessary to make efforts to form such a structure in a reasonable way. The analysis presented in this paper helps solve such problems at the macromanagement level.
References Structural dynamics of the economy: impact of investment in old and new technologies
- Gabardo F.A., Pereima J.B., Einloft P. The incorporation of structural change into growth theory: A historical appraisal. Economia, 2017, vol. 18, issue 3, pp. 392–410. http://dx.doi.org/10.1016/j.econ.2017.05.003.
- Freire C. Economic diversification: A model of structural economic dynamics and endogenous technological change. Structural Change and Economic Dynamics, 2019, vol. 49, pp. 13–28. DOI: 10.1016/j.strueco. 2019.03.005.
- Alonso-Carrera J., Raurich X. Labor mobility, structural change and economic growth. Journal of Macroeconomics, 2018, vol. 56, pp. 292–310. DOI: 10.1016/j.jmacro.2018.03.002.
- Samaniego R.M., Sun J.Y. Productivity growth and structural transformation. Review of Economic Dynamics, 2016, vol. 21, pp. 266–285. DOI: 10.1016/j.red.2015.06.003.
- Pi J., Zhang P. Structural change and wage inequality. International Review of Economics & Finance, 2018, vol. 58, pp. 699–707. DOI: https://doi.org/10.1016/j.iref.2018.07.010.
- Brancaccio E., Garbellini N., Giammetti R. Structural labour market reforms, GDP growth and the functional distribution of income. Structural Change and Economic Dynamics, 2018, vol. 44, pp. 34–45.
- Cutrini E. Economic integration, structural change, and uneven development in the European Union. Structural Change and Economic Dynamics, 2019, vol. 50, pp. 102–113. DOI: 10.1016/j.strueco.2019.06.007.
- Vu K.M. Structural change and economic growth: Empirical evidence and policy insights from Asian economies. Structural Change and Economic Dynamics, vol. 41, 2017, pp. 64–77. DOI: https://doi.org/10.1016/j.strueco.2017.04.002.
- Aghion P., Akcigit U., Howitt P. Lessons from Schumpeterian Growth Theory. The American Economic Review, 2015, vol. 105, no. 5, pp. 94–99. DOI: 10.1257/aer.p20151067.
- Breschi S., Malerba F., Orsenigo L. Technological Regimes and Schumpeterian Patterns of Innovation. The Economic Journal, 2000, vol. 110, no. 463, pp. 388–410. https://doi.org/10.1111/1468-0297.00530.
- Castellacci F. A Neo-Schumpeterian Approach to Why Growth Rates Differ. Revue économique, 2004, vol. 55, no. 6, pp. 1145–1169. DOI: 10.3917/reco.556.1145.
- Landesmann M.A., Stöllinge R. Structural change, trade and global production networks: An ‘appropriate industrial policy’ for peripheral and catching-up economies. Structural Change and Economic Dynamics, 2019, vol. 48, pp. 7–23. https://doi.org/10.1016/j.strueco.2018.04.001.
- Sukharev O.S. The Theory of Economic Growth: Institutions, Structures, Technologies and Information. Moscow, 2019a.
- Sukharev O.S. The restructuring of the investment portfolio: the risk and effect of the emergence of new combinations. Quantitative Finance and Economics, 2019b, no. 3(2), pp. 390–411. doi: 10.3934/QFE.2019.2.390.
- Sukharev O.S. Structural analysis of income and risk dynamics in models of economic growth. Quantitative Finance and Economics, 2020, vol. 4(1), pp. 1–18. DOI: 10.3934/QFE.2020001.
- Iamsiraroj S. The foreign direct investment – economic growth nexus. International Review of Economics & Finance, 2016, vol. 42, pp. 116–133. DOI: 10.1016/j.iref.2015.10.044.
- Romano L., Traù F. The nature of industrial development and the speed of structural change. Structural Change and Economic Dynamics, 2017, vol. 42, pp. 26–37. http://dx.doi.org/10.2139/ssrn.2461290.
- Brondino G. Productivity growth and structural change in China (1995–2009): A subsystems analysis. Structural Change and Economic Dynamics, 2019, vol. 49, pp. 183–191. DOI: 10.1016/j.strueco.2018.09.001.
- Vo L.V., Le H.T.T. Strategic growth option, uncertainty, and R&D investment. International Review of Financial Analysis, 2017, vol. 51, pp. 16–24. DOI: 10.1016/j.irfa.2017.03.002.
- Felice G. Size and composition of public investment, sectoral composition and growth. European Journal of Political Economy, 2016, vol. 44, pp. 136–158. DOI: 10.1016/j.ejpoleco.2016.07.001.
- Andreoni A., Chang H-J, Scazzieri R. Frontiers of Industrial Policy: Structures, Institutions and Policies. Structural Change and Economic Dynamics, 2019, vol. 48, pp. 1–150.
