Students’ Research Skills Development by Using Visualization

Author: Rozumenko Anzhela, Rozumenko Anatolii, Yurchenko Artem, Khvorostina Yurii, Semenikhina Olena
Journal: International Journal of Information Technology and Computer Science @ijitcs
Article in issue: 6 Vol. 16, 2024.
Free access
The analysis of modern methodological systems of teaching mathematics shows that the use of interactive visual models can positively influence the result of mastering mathematical knowledge and the level of students' research skills. The development of IT has made the emergence of many specialized environments and services focused on solving mathematical problems possible. Among such software tools, a separate group of programs should be highlighted that allow interactive user interaction with geometric objects. These computer programs enable the student to independently "discover" geometric facts, which gives reason to consider such programs as a tool for developing their research skills. The study aims to substantiate the positive impact of visual models (models created in interactive mathematical environments) on developing students' research skills and general mastery of the school geometry course. We have presented a methodological scheme for developing students' research skills using GeoGebra (Technique), conducted its expert evaluation, and experimentally tested its effectiveness. The experts noted the potential efficacy of the Technique in terms of the quality of students' geometric knowledge (91.7%) and improving their performance in geometry in general (79.2%). The statistical analysis of the results of the pedagogical experiment confirmed that the student's research skills increased along with the semester grades in learning geometry. The results of the pedagogical experiment showed the effectiveness of the Technique we developed and provided grounds for recommending it for implementation.
Research Skills, Interactive Visual Models, Teaching Mathematics, Methodological Schemes, IT in Education
Short address: https://sciup.org/15019582
IDR: 15019582 | DOI: 10.5815/ijitcs.2024.06.01
Text of the scientific article Students’ Research Skills Development by Using Visualization
Developing students' research skills is a cornerstone of the academic success of any society increasingly dependent on information today. The ability to critically and effectively interact with various information sources is paramount. Research skills allow students to navigate the information environment and develop the ability to analyze, synthesize, and compare data. In addition, research skills enable students to analyze arguments, evaluate the credibility of sources, and draw informed conclusions, i.e., they are essential life skills. On the side, integrating IT into educational practice has transformed the learning landscape, making it more dynamic and interactive. As academic institutions adapt to the changing demands of the 21st century, focusing on developing students' research capacity through IT will play a key role. This is where the role of educators becomes crucial, as they are the ones who can shape the future of education. However, traditional educational practices still use rote memorization and passive assimilation, which doesn't contribute to appropriate student training. So, searching for practical approaches to forming students' research skills is required. Among the many educational approaches, using computer-aided visual models can significantly improve learning outcomes and support the development of research skills.
Theoretical analysis of modern methodological teaching systems (for example, [1]) allowed us to assume a positive impact of the use of interactive visual models on the result of mastering mathematical concepts, objects, and their properties. Based on the researchers' conclusions, the amount of information a person receives with the help of vision significantly exceeds the amount of information other organs receive [2]. Therefore, it seems reasonable to use visual models of educational information, the construction of which is based on interactivity [3] and cognition [4]. In contrast to the illustrative function of visualization (it allows you to embody in a relatively adequate visual design only what is already known, that is, what already exists), the cognitive function, with the help of an image, provides new information about an object or its properties, thereby contributing to the acquisition of new knowledge and "provoking" interest in further research.
Visual mathematical models promote a deeper understanding of complex concepts and involve active student involvement in research. By providing students with an interactive experience, computer visual models are essential for developing critical thinking (analyzing, comparing, contrasting, comparing, evaluating, etc.) and, consequently, research skills. The analysis of IT use in geometry teaching has shown that among the many specialized software. Among such software tools, a separate group of programs should be singled out to allow interactive user interaction with geometric objects (the user can interactively change the parameters of objects and observe the change in the shape of these objects and their characteristics). This group includes GeoGebra , The Geometer's Sketchpad , Cabri , and others. These programs allow the student to independently "discover" geometric facts, which gives reason to consider such programs as a tool for developing his research skills.
Thus, given that developed research skills are fundamental to students' critical thinking and academic achievement levels, educational institutions must pay more attention to forming such skills through IT-based technologies. Using computer visual models based on interactive mathematical environments is a promising way to develop students' research skills.
2. Analysis of Current Research
Reliance on passive approaches to learning in traditional settings often fails to engage students in the research process. Many students are accustomed to conventional classes where information is disseminated without the opportunity for interaction or application. This environment can stifle curiosity and reduce student motivation to delve deeper into educational content. Implementing inquiry-based learning models emphasizing active participation and inquiry has increased student engagement and developed essential research skills [5]. Such approaches foster a greater ownership of the learning process and allow students to take initiative in their research endeavors. Another pressing problem within traditional research education is the lack of integration of technological tools that could facilitate student learning. The potential of computer-based visual models and interactive learning technologies remains untapped, mainly in traditional settings. For example, tools such as the K-Visual GKT module, which uses origami techniques to enhance visualization skills, demonstrate how hands-on visual learning can significantly aid in developing core research abilities [6]. Such models not only simplify complex concepts but also foster a deeper understanding of the idea through engagement, thereby bridging a gap that traditional methods often leave unaddressed.
Visualization is perceived today as a tool for learning about the world [7] or as a means of learning [8].
One of the main advantages of using computer visual models is their ability to present information in a highly interactive and engaging way. Computer visual models allow students to actively interact with the material, thereby fostering a deeper understanding of research methodologies. For example, research shows that immersive environments created with virtual reality technology significantly increase student engagement and motivation, resulting in better learning outcomes [9]. This interaction is critical to building mindsets to analyze and synthesize information.
Visualization helps to understand complex theories and structures, allowing students to grasp the main ideas without being overwhelmed by the details. An example is the study [10] devoted to teaching visual programming based on the project method. The authors conclude that visualization of project ideas is crucial in mental representations of research processes, ultimately contributing to improved academic performance. Conducting interactive workshops using computer visual models [11] leads to a deeper understanding of research processes and promotes research education. In addition, visual models can improve communication between students, allowing them to articulate their ideas and conclusions more effectively. In many research contexts, the ability to communicate complex information is as important as the research itself. Students can present their research more understandably using visual tools such as diagrams, charts, and 3D models [12].
The importance of visualizing educational material in teaching mathematics has been substantiated for a long time. Researchers analyze the objects and patterns of the visualization process in learning [13], revealing the psychological aspects of using visualization tools in teaching and mathematics [14]. Scientists investigate the relationship between students' visual representations and their ability to solve word problems [15] and find multiple ways to solve a problem [16]; the effectiveness of using visualization techniques to increase the level of creativity of students [17]; the role of visual images in solving problems in probability theory [18]; the use of visualization to develop students' critical thinking [19]; the process of creating mind maps for adequate visualization of the connections between concepts and assimilation of educational material [20]; methods of using visualization technology to simplify the understanding of mathematical concepts [21]; the process of preparing teachers to visualize educational material in various computer environments [22]; the use of visualization in mathematics education in general [23]. The generalization of the above results provides a methodological basis for developing a strategy for teaching mathematics based on visual models, especially in the study of geometry, where research skills are among the leading ones.
Geometric concepts have a high degree of abstraction, which explains students' difficulties in perceiving geometric material. The development of students' thinking influences the success of mastering geometric material [24] and the use of special tools [25], which provide high-quality visualization of educational material [26]. A study [27] substantiated the effectiveness of using Cabri Geometry to study the properties of triangles in grade 5. The authors argue that using Cabri Geometry reduces students' cognitive load and increases the productivity of learning material compared to traditional learning environments. In the article [28], the authors describe the experience of using the GeoGebra environment to form the concept of a quadrilateral in primary school students and point out that working with interactive geometric models has a positive effect on understanding the features of different types of quadrilaterals and understanding the relationships between them. The authors [29] consider using interactive programs to develop students' skills to move from the specific to the general (specific examples of different types of quadrilaterals and general conclusions that need to be substantiated).
In these studies, the practicality and effectiveness of using computer visualization in assimilating geometric knowledge by students of different ages are substantiated. Researchers focus on the teacher's leading role, directing students' activities. We share the researchers' opinions about the positive impact of the use of visualization on students' mastery of geometric material, as well as the leading role of the teacher, who, through dynamic models of geometric objects, forms a system of students' knowledge about a particular concept or geometric object. At the same time, we did not find evidence in the methodological literature (for example, established teaching practices or effective learning technologies, etc.) in favor of visualizing geometric concepts to develop students' research skills.
Research activity is a unique human activity regulated by the consciousness and activity of the individual, aimed at satisfying cognitive and intellectual needs, resulting in new knowledge obtained by the set goal and objective laws of cognition [30]. Research skills are skills through which research activities are implemented in the learning process. Such skills are the ability to analyze, compare, highlight the main thing, and make generalizations. Their development (according to our hypothesis) is ensured by research activities in a specialized environment where it is possible to build and operate interactive visual models.
The study aims to substantiate the positive impact of visual models on developing students' research skills and mastering the school geometry course.
3. Materials and Methods
The study involved organizing a pedagogical experiment, for which we developed a methodological scheme for developing students' research skills in geometry lessons and appropriate diagnostic tools.
-
3.1. Participants of the Pedagogical Experiment
-
3.2. Organization of the Pedagogical Experiment
The experiment participants were 36 students aged 13-15 (three classes of one secondary school). The number of students in the class determined the number of participants in the experiment. The planimetry curriculum determined the choice of classes – these are the classes where basic geometric shapes and their properties are studied. The students involved in the experiment were those with whom the individual co-authors of the article worked directly. That made it possible to strictly follow the developed methodological scheme for developing students' research skills (from now on – the Technique) and limit other educational influences in geometry lessons.
We have summarized the practical experience of using interactive geometry software in teaching mathematics. Based on the analysis, we have chosen the freely distributed GeoGebra program for use in the educational process and have developed a methodological scheme for developing students' research skills using it (from now on referred to as the Technique). The computer program allows you to build geometric models accurately, quickly, and visually, and the interactivity of models will enable you to "discover" their properties and check assumptions. The program is freely distributed, can be used in an offline version (installation on a PC) and as a cloud service [30], and has a Ukrainian interface. These factors were decisive in choosing a computer program for organizing a pedagogical experiment. To ensure the potential effectiveness of the Technique, we first conducted an expert evaluation. The experts were 24 mathematics teachers from the Sumy region who were taking a professional development course at Sumy State Pedagogical University. The math teachers who were involved as experts had the appropriate education, at least five years of experience as a math teacher, and at least three years of experience using specialized software in their professional activities. After the training, which included mastering the author's Technique (expert teachers got acquainted with the Technique and developed similar didactic material for different planimetry topics themselves), we asked the experts three questions (Table 1).
Table 1. Expert questions
The results were processed using descriptive statistics.
(a) to task 1
|
(b) to task 2 ; ° \ АМ-МВ АМ МВ А ^ / в (d) to task 4 Fig.1. Tasks examples. Source: Own work |
^7^ ^^^^^ (c) to task 3 в ____________С |

|
№ |
Questions and Answer Options |
|
1. |
In your opinion, is the Technique effective for forming students' research skills? |
|
2. |
In your opinion, will Technique positively affect students' mastery of geometry educational material? |
|
3. |
Will you use the Technique in your own geometry lessons? |
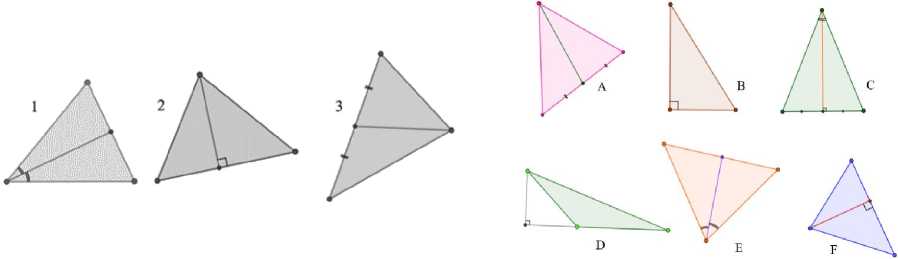
We held the pedagogical experiment in the 2022-2023 academic year. At the beginning of the experiment, we recorded the students' academic achievements in geometry (grades in geometry for the previous semester). In the pedagogical experiment, students studied the "Properties of a triangle." We used the author's Technique. Before exploring the subject topic and after learning it, we asked students to solve four tasks that tested their ability to analyze, compare, highlight the main thing, and make generalizations (tasks' examples are in Fig. 1, a-d). The task conditions are in Table (table 2).
Table 2. Task conditions
|
№ |
Task Type |
Condition |
|||||
|
1 |
Tasks to test the ability to analyze |
Analyze the images of the elements of the triangle (bisector, height, median) in the figures labeled 1, 2, and 3. From figures A, B, C, D, E, and F, select those where you can highlight these elements and fill in the table. |
|||||
|
Triangle Elements |
1 |
2 |
3 |
||||
|
Related figures |
|||||||
|
2 |
Tasks to test the ability to comparison |
Compare the relative placement of a circle and a triangle. Specify the numbers of the figures that depict
|
|||||
|
3 |
Task to test the ability to highlight the main thing |
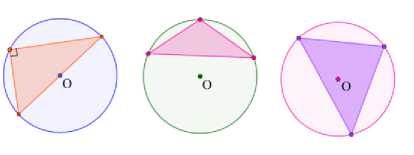
Conclude the location of the circle's center circumscribed around the triangle, depending on the type of triangle (acute-angled, rectangular, obtuse-angled). Fill in the blanks in the statements using the answer options: The circumcircle center around an acute-angled triangle is ___________; The circumcircle center around a right-angled triangle is ___________ ; The circumcircle center around an obtuse triangle is ___________. Possible Answers: inside the triangle, outside the triangle, on the side of the triangle. |
|||||
|
4 |
Tasks to test the ability to generalize |
Generalize "the property of the points of the median perpendicular to the segment" on "the intersection point of the median perpendiculars of an arbitrary triangle" and plot the segments equal to the segment OC in the figure (we indicated the answer by hatching; it is not needed on the task card). Generalize the property of the points of the angle bisector to the intersection point of the bisectors of an arbitrary triangle and plot on the figure equal to the segment OM (we indicated the answer by hatching; it is not needed on the task card) |
|||||
We evaluated each task with a maximum of 2 points: 0 points if the task was not solved or solved incorrectly, 1 point if the task was partially correctly solved, and 2 points if the task was entirely and correctly solved. The maximum number of points is 8.
To study the development of research skills for each student, we had two sets of answers (at the beginning and end of the pedagogical experiment), with the sets being dependent, but the elements in the sets were independent. This made it possible to use a single sample for experimental training and to use a nonparametric sign criterion as a statistical criterion for processing the results of a pedagogical experiment with a significance level of 0.05. We tested the null hypothesis “H0: the level of students' research skills did not change under the influence of Technique” against the alternative hypothesis “Ha: the level of students' research skills increased under the influence of Technique.” The criterion is based on recording changes in the indicator of the studied quality for each respondent:
If the change is positive (the indicator is higher at the end of the experiment than at the beginning), the pair is assigned a "+" sign.
If the change is negative (the indicator is lower at the end of the experiment than at the beginning), the pair is assigned a "-" sign.
If no change occurred (the indicator value is the same at the end of the experiment and the beginning), the pair is assigned a "0" sign.
The hypothesis (H0 or Ha) is accepted or rejected depending on the number of sign changes in pairs and the number of positive changes [20].
Using the most common way of organizing a pedagogical experiment with two groups (control and experimental) was impossible since the school had one class per parallel, and dividing one class into groups was not possible due to the general organization of the educational process (students in the class were not divided into groups).
We also compared the students' overall final grades in geometry before and after the experiment. We used visual analysis to confirm the normality of the distribution of results and compare the averages by Student's criterion
-
3.3. Description of the Author's Technique
The author's Technique involves the following "steps":
-
• Students are introduced to the topic and its basic concepts . With the teacher's help, students find definitions of concepts in the textbook, highlight the main features of the concepts, and make a corresponding symbolic entry in a notebook (a picture with notations and symbolic notations).
-
• Students’ complete tasks (research tasks, search tasks) in an interactive environment . The teacher completes the constructions, shows them on the screen, comments, and asks questions to the students. The system of questions should direct students' reasoning to certain conclusions.
-
• Students formulate a hypothesis. They make assumptions, and the teacher points out the discrepancies in the assumptions and the need to prove or disprove the assumption (hypothesis).
-
• Students logically substantiate (or refute) a hypothesis . Under the teacher's guidance, students build a logical chain of reasoning and write down the theorem and proof in a notebook. Students can use the ready-made evidence from the textbook and write down the proof concisely in symbolic form in the notebook.
-
• Students formulate a general conclusion . The teacher duplicates the constructions in an interactive environment and comments on the proof of the theorem. Then the teacher changes the image (changes the lengths, notations, and placement, performs additional constructions that make it difficult to "recognize" the content of the theorem) and emphasizes that the statement (theorem) that has been proved will be valid for all other images (that is, it is a general statement for these geometric concepts).
We have successfully implemented this Technique in teaching students the topic "Properties of triangles" (leading concepts: circle; circle; tangent to a circle and its property; circumcircle around a triangle; incircle in a triangle). We proved that this Technique is an effective learning process.
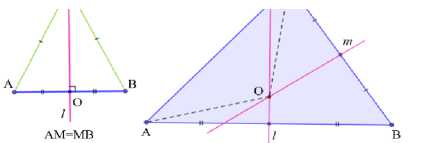
Fragment of the lesson "Circle" with the teacher's comments (Fig. 2).
The main concepts of the topic: are circle; Radius; chord; and Diameter.
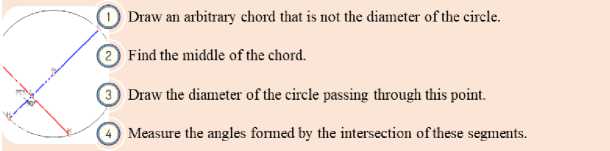
Fig.2. Teacher's comment ("Circle" topic). Source: Own work
The teacher: What answer did you get? What can you say about the circle's diameter passing through the middle of the chord?
Students formulate a hypothesis: The diameter of a circle that passes through the middle of the chord is perpendicular to it .
The teacher asks the students to justify the validity of the hypothesis .
Students substantiate the truth of a hypothesis by drawing and writing down the formulation and proof of the corresponding theorem in a notebook .
The teacher suggests the inverse statement.
Students: The diameter of a circle perpendicular to the chord divides it in half.
Teacher: Is this statement true?
Students make assumptions.
The teacher performs the appropriate constructions (but now first builds a perpendicular diameter and then checks the division of the chord in half).
Students are convinced of the truth of the inverse statement .
The teacher stresses the need for theoretical justification for the conclusion .
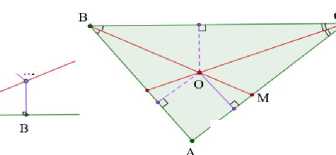
Fragment of the lesson "A circumcircle around a triangle" with the teacher's comments (Fig. 3-4).
The main concepts of the topic: are a median perpendicular to the segment; and a circumcircle around a triangle.
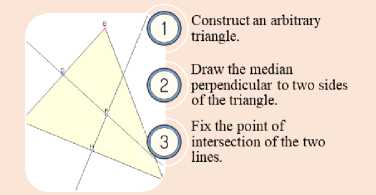
Fig.3. Teacher's comment ("A circumcircle Around a Triangle" topic). Source: Own work
After completing the third step, the teacher asks students to prove that the median perpendiculars to the two sides of a triangle always intersect.
The teacher : Will the median perpendicular of the triangle's third side pass through the median perpendicular's intersection point of the other triangle's sides?
Students hypothesize: Yes (no).
The teacher draws the median perpendicular to the third side of the triangle (Fig. 4). Which hypothesis came true? The conclusion must be substantiated.
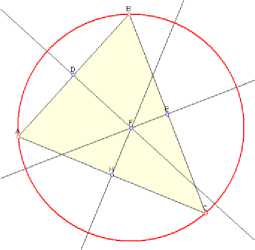
Fig.4. Additional constructions to Figure 2. Source: Own work
The teacher proposes to consider the theorem about the point of intersection of the median perpendiculars to the sides of the triangle as the center of the circle circumscribed around the triangle. After formulating and proving the theorem traditionally, the teacher draws a circle centered at a given point, and the students make sure that it passes through all the vertices of the triangle; that is, it is circumscribed around the triangle (Fig. 4).
Students draw in a notebook and write down the theorem's formulation and the proof's steps.
The GeoGebra interactive environment allows the teacher to dynamically change the appearance of the triangle and focus students' attention on the placement of the circumcircle center around the triangle, depending on the type of triangle (acute-angled, rectangular, obtuse-angled). The teacher pays particular attention to the center of the circle circumscribed around a right-angled triangle is the hypotenuse middle. This property is often used in problem-solving, so the teacher substantiates it with additional logical reasoning.
Fragment of the lesson "Tangent to the circle" with the teacher's comments (Fig. 5).
The basic concept of the topic: tangent to a circle.
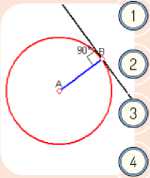
Draw an arbitrary circle.
Select a point on the cir cle.
Find the radius of the cir cle passing thr ough the selected point.
Draw a line passing through the selected point and perpendicular1 to the r adius.
Fig.5. Teacher's comment ("Tangent to the circle"). Source: Own work
The teacher : Today, we're going to explore the concept of tangent. How many points do a circle and a tangent line have in common?
Students formulate a hypothesis: A circle and a line have one point in common.
The teacher changes the position of the point of contact on the circle and the circle radius.
Students observe and conclude that these changes do not affect the overall conclusion.
The teacher asks the students to conclude that the tangent to the circle has no other points in common than the point of contact.
Under the teacher's guidance, students formulate the fundamental property of the tangent and comment on the construction of the tangent to a given circle at the point that belongs to the circle. In the notebook, they build a circle using a compass, draw an arbitrary radius, and build a tangent to the circle using a square.
Fragment of the lesson on the topic "A circle inscribed in a triangle" with the teacher's comments (Fig.6-7).
Basic concepts of the topic are triangle bisectors; the center of a circle inscribed in a triangle.
The teacher: If you draw the third bisector of a triangle, will it pass through the point of intersection of the first two?
Students hypothesize: Yes (no).
The teacher : Let's make the third bisector (Fig. 7). Which hypothesis came true?
The teacher : Prove that the center of a circle inscribed in a triangle is the point of intersection of its bisectors.
Students draw in their notebooks and write down the wording and steps for proving the theorem. You can consider the formulation and proof of the theorem in a textbook.
After proving the theorem, the teacher builds an inscribed circle and shows how to determine its radius (Fig.7).
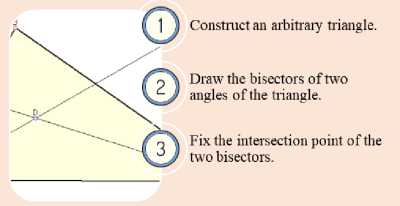
Fig.6. Teacher's comment ("Circle inscribed in a triangle"). Source: Own work
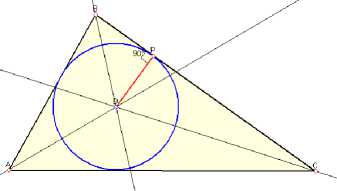
Fig.7. Additional constructions to Figure 5. Source: Own work
4. Results 4.1. Peer Review
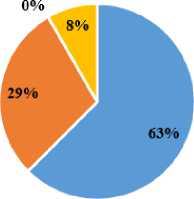
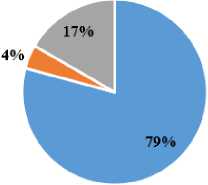
We conducted an expert assessment of the Technique, introduced experts to it in refresher courses, and, after, asked the experts some questions, to which we received the following answers (Fig. 8).
1.1. Yes. the Technique is effective for any geometry material
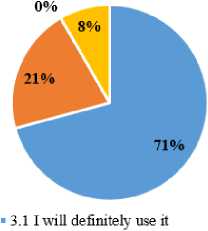
■ 3.2.1 will use it if there are readymade developments for organizing students' research activities
-
1.2. Yes, the Technique is effective, but for selec ted topic s in the school mathematics course
-
1.3. No, this Technique is not effective for the development of students' research skills
-
1.4.1 cannot decide
-
■ 2.1. Implementation of this Technique will improve student achievement in geometry7
-
■ 2.2. The implementation of this Technique will not affect students' performance in geometry
-
■ 2.3. It isn't easy to decide
-
■ 3.3. No, because I am not sure of the effectiveness of such a scheme
-
■ 3.4. No, because I do not have the appropriate skills
-
4.2. The Pedagogical Experiment Results
Fig.8. Distribution of experts' opinions. Source: Own work
Experts noted the potential effectiveness of the Technique in terms of the quality of assimilation of students' geometric knowledge (91.7%) and the improvement of academic performance in geometry in general (79.2%). Face-to-face communication revealed that individual teachers do not believe the Technique can be implemented due to different circumstances (it requires additional time, and all students need computer access). Some experts emphasized the need to conduct appropriate training and provide teachers with ready-made methodological developments for implementing Techniques in geometry lessons.
Students studied the "Properties of a triangle" topic during the experiment. They considered four fundamental theorems. Before and after the experiment, students solved problems to determine the level of their research skills. The results are presented in Table 3.
Table 3. Students results
|
No |
Points (before) |
Points (after) |
Difference sign |
No |
Points (before) |
Points (after) |
Difference sign |
|
1 |
2 |
3 |
+ |
19 |
2 |
4 |
+ |
|
2 |
1 |
4 |
+ |
20 |
3 |
4 |
+ |
|
3 |
2 |
3 |
+ |
21 |
2 |
2 |
0 |
|
4 |
0 |
2 |
+ |
22 |
3 |
6 |
+ |
|
5 |
0 |
1 |
+ |
23 |
0 |
2 |
+ |
|
6 |
0 |
3 |
+ |
24 |
0 |
0 |
0 |
|
7 |
0 |
2 |
+ |
25 |
0 |
0 |
0 |
|
8 |
0 |
4 |
+ |
26 |
0 |
0 |
0 |
|
9 |
6 |
7 |
+ |
27 |
0 |
3 |
+ |
|
10 |
4 |
5 |
+ |
28 |
4 |
4 |
0 |
|
11 |
4 |
6 |
+ |
29 |
3 |
6 |
+ |
|
12 |
4 |
4 |
0 |
30 |
4 |
6 |
+ |
|
13 |
2 |
1 |
- |
31 |
7 |
8 |
+ |
|
14 |
2 |
4 |
+ |
32 |
6 |
6 |
0 |
|
15 |
1 |
0 |
- |
33 |
6 |
6 |
0 |
|
16 |
2 |
0 |
- |
34 |
5 |
8 |
+ |
|
17 |
6 |
6 |
0 |
35 |
4 |
4 |
0 |
|
18 |
7 |
6 |
- |
36 |
2 |
1 |
- |
The sign criterion was applied to the obtained results. Statistical hypotheses made it possible to use a one-sided criterion of sign: positive changes (+) – 21; the number of zeros is 10; the number of changes in total is 26. The critical value of the criterion is 19 for a significance level of 0.05. As 21>19, we had reason to reject the null hypothesis and accept the alternative hypothesis. That means that students' research skills have increased under the influence of Technique.
Before and after the experiment, we recorded students' semester grades in geometry (Table 4).
Table 4. Students distribution by academic achievement levels*
|
Before the experiment |
After the experiment |
||||
|
Initial |
1 |
1% |
|||
|
Medium |
20 |
57% |
9 |
25 % |
|
|
Sufficient |
11 |
31% |
22 |
61% |
|
|
High |
4 |
11% |
5 |
14 % |
|
* In Ukraine, there is a 12-point assessment system, which defines four levels of educational achievements: elementary (1-3 points), medium (46 points), sufficient (7-9 points), high (10-12 points)
Visual analysis shows a normal distribution of levels of educational achievement (Fig. 9).
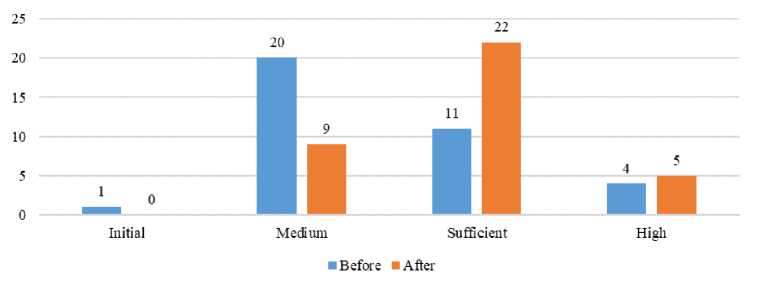
Fig.9. Diagram of the student's educational achievement levels before and after the experiment. Source: Own work
We used an Analysis package (MS Excel) to compare the results statistically (Table 5).
Table 5. t-Test: Paired two sample for means
|
Variable 1 (before experiment) |
Variable 2 (after experiment) |
|
|
Mean |
7.277778 |
7.888889 |
|
Variance |
3.234921 |
2.215873 |
|
Observations |
36 |
36 |
|
Hypothesized Mean Difference |
0 |
|
|
df |
35 |
|
|
t Stat |
-3.80183 |
|
|
P(T<=t) one-tail |
0.000276 |
|
|
t Critical one-tail |
1.689572 |
|
|
P(T<=t) two-tail |
0.000552 |
|
|
t Critical two-tail |
2.030108 |
These tables with statistical calculations show increasing students' overall semester grades (from 7.28 to 7.89, and the range of grades has become less than 3.23>2.22). Therefore, the Technique has significantly impacted the assimilation of educational material into geometry.
5. Discussion
The latest PISA study [31] confirmed the general trend of decreasing the quality of school graduates' mathematical training. Teachers analyze the reasons for this trend and try to find ways to eliminate them. One of the main reasons for the low level of mathematical training is that students have difficulty perceiving abstract mathematical concepts and lack the desire to master them. Thanks to the experiment, we substantiate the positive impact of using visual models on learning the school geometry course through the development of students' research skills. Our research is about teaching geometry, which is often difficult for students to comprehend. Educational material in geometry is built on a deductive basis: first, basic concepts (without definitions) are introduced; then formulate their properties (axioms) without justification; all concepts that are not basic are defined through basic concepts and their properties. All the properties of concepts are formulated in the form of theorems and logically substantiate them. The main educational activities in geometry lessons are forming geometric concepts, proving theorems, and solving problems.
In developing the Technique, we are following provisions as a basis:
-
• geometric concepts and their properties have a high degree of abstraction; therefore, in the learning process, the technology of visualization of educational material is an effective learning strategy;
-
• computer visualization of educational material is the most effective, and the use of specialized programs allows you to change the parameters of objects and demonstrate the corresponding changes;
-
• understanding the deductive construction of geometry is a condition for students' qualitative assimilation of educational material in geometry.
-
• the students' research activities organization in teaching geometry contributes to developing skills to analyze, compare, highlight the main thing, and draw general conclusions. We call them research skills. In the process of developing research skills, students understand the essence of the axiomatic method;
-
• the teacher organizes students' research activities using the Technique.
This basis made it possible to determine an effective strategy for teaching geometry, which uses specialized software to visualize the properties of mathematical objects and the interactive interaction of students with such objects. We share the opinion of scientists who argue that students deepen their own knowledge through the performance of specific actions, which contribute to the development of their own research skills: to see a problem and put forward a hypothesis for its solution; plan and conduct experiments; reflect and evaluate their activities; transfer previously acquired knowledge and skills to a new situation [32].
Today, scientists distinguish three types of visualization: scientific visualization, information visualization, and visual analytics [33]. Scientific visualization is a research and applied field focusing on visualizing three-dimensional phenomena to graphically illustrate scientific data, allowing scientists to understand and explain specific patterns. Information visualization is the study of interactive visual representations of abstract data to improve human cognition of various phenomena. Abstract data includes digital and non-digital data, such as geographic information or text. Graphic elements such as bar charts, graphs, flowcharts, and diagrams visualize information used in scientific research and the educational process. Visual analytics is a new field evolving with scientific and information visualization development, emphasizing analytical reasoning. The third type of visualization is promising for use in the educational process since it focuses on research.
Researchers in teaching methods stress the importance of information saturation in the educational environment. It's not about the quantity but the quality [34]. These findings form the basis for integrating cognitive visualization technologies into education [35]. Our approach to cognitive visualization is centered on the properties of geometric objects with which students can interact. This interactive approach allows for the creation of numerous cases that demonstrate the preservation of a particular property of an object, enhancing the learning experience.
Current research [36; 37] indicates that the GeoGebra environment is the most widely used today, thanks to its multilingual interface and free distribution. However, studies on the challenges of using specialized software in geometry teaching have also highlighted the use of Cabri [38], and The Geometer's Sketchpad [39]. In a review article [40], researchers underscore the prevalent use of such programs in geometry teaching and the need for more emphasis on training teachers to use this software effectively. This gap in teacher training is the problem we aim to address with our Technique.
The analysis of scientific results and the generalization of our pedagogical experience prompted us to develop a technique that considers the specifics of geometric knowledge and is general enough for the teacher to use in studying various topics of the school geometry course. We focused on analyzing two research areas: developing students' research skills in teaching geometry and using computer visualization in specialized mathematical environments. This idea correlates with [41], which combines these two areas: the authors distinguish special tools available in computer programs (tools for measuring and changing the parameters of constructions). The researchers describe methodical schemes of their use for forming the concept of a triangle in primary school students and for developing research skills of high school students (checking the properties of an object in a computer environment). Our experiment, like [42], showed that the use of technology allows us to intensify the process of assimilation of knowledge, increasing the information saturation of the educational process due to its compact and concentrated presentation, reducing the time for its perception and understanding; maintaining a high pace of learning; rational organization of academic activities through the use of specially designed visual aids.
While the role of computer visual models in developing research skills is increasingly recognized, it is essential to consider the challenges and limitations associated with their implementation. Traditional educational systems cannot quickly adapt to integrating advanced technologies, potentially hindering their effectiveness. However, as academic institutions adjust to the changing demands of the digital age, it is crucial to explore and embrace innovative strategies for incorporating these tools into the curriculum, ensuring that students are prepared for the future.
Successful integration of visual models depends on the professional development of teachers. Training programs to equip teachers with the necessary skills to integrate visual tools into their instructional strategies are essential. By providing access to teachers with training, workshops, and resources to develop computer visualization skills, educational institutions can empower teachers to implement innovative teaching methods effectively. Research shows that educators who receive training in integrating technology into instruction are more likely to implement these tools in their classrooms, resulting in improved student outcomes [11].
The advancement of IT has led to the creation of specialized digital tools that can assist students in constructing logical reasoning chains [11] when proving geometric statements. However, using such tools in the educational process necessitates using specific methodological techniques. The authors [43] have developed and implemented a digital learning environment that enables students to formulate and prove assumptions individually and in a group. Yet, we argue that for students to develop research skills truly, they must first comprehend the construction algorithm and then independently construct the logic of their research. Our technology is designed with this in mind, offering a practical solution to this pedagogical challenge.
6. Conclusions
With the development of digital technologies, students' research skills based on using such technologies become relevant. Therefore, it is natural to involve software environments in the educational process to facilitate students' learning and develop qualities that are in demand today, including research skills. The complexity of the perception of geometric material and the spread of specialized mathematical environments, where interactive interaction with objects is provided, led to the creation of a methodological scheme for developing students' research skills. We have substantiated the positive impact of the use of visual models on the mastering of the school geometry course. The results of the pedagogical experiment showed the effectiveness of the Technique we developed for developing students' research skills. The Technique effectively teaches the properties of geometric concepts in specialized interactive environments. The Technique will be effective in online learning because it relies on educational activities in a digital environment. Therefore, our future methodical searches will Focus on expanding the experimental base (different topics, different levels of learning, etc.) and using various computer environments to teach geometry.
7. Limitations
Our study results have some limitations.
-
• An experimental study was conducted on a sample of 36 students. Since such a sample is insufficient for the application of standard parametric methods of statistical analysis, we limited ourselves to non-parametric sign criterion. The pedagogical experiment did not include a study of the control and experimental groups due to
objective limitations in the organization of the educational process at school. That led to constraints in choosing statistical criteria (for example, we could not use Student's t-test for mean and other parametric criteria). At the same time, based on the opinion of M. Grabar and K. Krasnyanska [20], using the sign criterion as a statistical criterion is acceptable in our case, and the technique can be considered effective.
-
• The effectiveness of the Technique was tested by studying one topic of the school geometry course, "Properties of a triangle," which also limits the practical significance of the conclusions.
-
• The described Technique was based on the use of the GeoGebra program. This program allows step-by-step construction and interactive interaction with mathematical objects. Similar to GeoGebra in the context of geometric structures and manipulations with objects are "interactive geometry software" (The Geometer's Sketchpad, Cabri Geometry, Cinderella, DrGeo, DG (Dynamic Geometry), and others). They differ in the tools and interface embedded in them. However, we believe if the participants in the educational process use the tools of geometric constructions on the plane, our technique can be implemented in any of these programs.
-
• The pedagogical experiment is based on a relatively small sample, so it has several potential limitations, including insufficient representativeness (the sample may not fully reflect the general population's diversity and characteristics), making the conclusions less generalizable. Also, a small sample size does not guarantee that random factors are not influencing the results, but we did not observe any respondents with extreme results. The experiment's results may be specific to the participants and may not apply to the general population of students. The homogeneity of a small sample with a similar level of training may also reduce the validity of the results for other groups. For small samples, it is more difficult to control for the influence of different parameters (e.g., the impact of the digital environment, home support, etc.), which can also affect the experiment results. Also, a small sample may increase the risk of false conclusions about the effect of the developed Technique. To minimize the limitations, we used a non-parametric statistical sign test and involved students from different grades with different personality characteristics.
-
• We did not conduct a statistical analysis of the expert evaluation, which leads to the possibility of potential error in the expert evaluation due to several factors: subjectivity of experts (e.g., personal biases based on experience or preferences), observation errors (e.g., fatigue or inaccurate answers), group influence (e.g., conformism or the effect of the trainer's authority), and the impact of previous impressions. To minimize bias, we pre-instructed the experts on the same understanding of the criteria evaluation. We engaged 24 independent experts to avoid estimation errors and enhance the objectivity of the responses.
References Students’ Research Skills Development by Using Visualization
- O. Semenikhina, and M. Drushlyak, “On the results of a study of the willingness and the readiness to use dynamic mathematics software by future math teachers,” CEUR Workshop Proceedings, 1356, pp. 21-34. 2015.
- M. Ostroha, “The need for computer visualization of educational content as a response to the request of the visual generation,” IT and Educational Analytics, vol. 1, no 2, pp. 52-62. https://doi.org/10.31110/ITandEA-v.2024.v2.06.
- O. Silkova, “Pedahohichna tekhnolohiia vizualizatsii navchalnoi informatsii [Pedagogical technology of visualization of educational information],” The scientific journal of the M.P. Dragomanov NPU. Series 5. Pedagogical sciences: realities and prospects, vol. 62, pp. 180-183, 2018.
- I. Shostak, “Pidvyshchennia efektyvnosti dystantsiinoho navchannia u tekhnichnykh vyshakh na osnovi vykorystannia interaktyvnoi kohnityvnoi hrafiky [Increasing the effectiveness of distance learning in technical universities based on the use of interactive cognitive graphics],” Information processing systems, vol. 9, pp. 190-194, 2015.
- N.A. Prima, and U. Usmeldi, “Validity and Practicality of E-Module Model Inquiry Based Online Learning to Improve Student Competence,” Jurnal Penelitian Pendidikan IPA, vol. 9, no. 4, pp. 2010–2017, 2023. https://doi.org/10.29303/jppipa.v9i4.3563.
- M. S. Marji, A. H. Musta’amal, L. M. Tahir, and N. Shaharudin, “Development of K-Visual GKT Module for Improving Visualization Skill Based on The Art of Origami for Technical Drawing Subjects”, JRHotsPM, vol. 3, no. 2, pp. 129-136, 2023. https://doi.org/10.51574/kognitif.v3i2.1134.
- M. Evagorou, S. Erduran, T. Mäntylä, “The role of visual representations in scientific practices: from conceptual understanding and knowledge generation to ‘seeing’ how science works,” IJ STEM Ed, vol. 2, no. 11, 2015. https://doi.org/10.1186/s40594-015-0024-x.
- J.S. Macnab, L.M. Phillips, and S.P. Norris, “Visualizations and Visualization in Mathematics Education,” In: Norris SP (eds). Reading for Evidence and Interpreting Visualizations in Mathematics and Science Education. Sense Publishers, Rotterdam, 2012. https://doi.org/10.1007/978-94-6091-924-4_6.
- V. Volynets, M. Tolmach, and B. Novytskyi, “Visual Effects in the Creation of Game-based Learning Content: Impact on Perception and Motivation in Learning,” Digital Platform Information Technologies in Sociocultural Sphere, vol. 6, no. 2, pp. 261–273, 2023. https://doi.org/10.31866/2617-796X.6.2.2023.293591.
- M. Rizkayeni, R.R. Afif, D.S. Agariadne, P.D. Ika, and H.A. Novi. “Innovative Learning Strategies: Project-Based Learning Model for Excelling in Visual Programming,” TEM Journal, vol. 13, no. 1, pp. 581-589, 2024. https://doi.org/10.18421/tem131-61.
- E. Thompson, “Preparing sixth-form students for the transition into higher education: developing key research skills through the EPQ,” JLDHE, no. 29, 2023. https://doi.org/10.47408/jldhe.vi29.1086.
- N.A. Prima, and U. Usmeldi, “Validity and Practicality of E-Module Model Inquiry Based Online Learning to Improve Student Competence,” Jurnal Penelitian Pendidikan IPA, vol. 9, no. 4, pp. 2010–2017, 2023. https://doi.org/10.29303/jppipa.v9i4.3563.
- A.J. Bishop, “Review of research on visualization in mathematics education,” Focus on Learning Problems in Mathematics, vol. 11(1), pp. 7-16, 1989.
- N. Presmeg, “Research on visualization in learning and teaching mathematics,” Handbook of Research on the Psychology of Mathematics Education: Past, Present and Future, 2006. https://www.researchgate.net/publication/241301299_Research_on_visualization_in_learning_and_teaching_mathematics.
- D. van Garderen, “Spatial Visualization, Visual Imagery, and Mathematical Problem Solving of Students With Varying Abilities,” Journal of Learning Disabilities, vol. 39(6), pp. 496-506, 2006. https://doi.org/10.1177/00222194060390060201.
- I. Vale, and A. Barbosa, “Visualization: A Pathway to Mathematical Challenging Tasks,” Mathematical Challenges For All. Springer International Publishing, pp. 283-306, 2023. https://doi.org/10.1007/978-3-031-18868-8.
- L. Cioca, and R. Nerișanu, “Enhancing creativity: Using visual mnemonic devices in the teaching process in order to develop creativity in students,” Sustainability, vol. 12(5), no. 1985, 2020. https://doi.org/10.3390/su12051985.
- M. Zorzos, and E. Avgerinos, “Research on visualization in probability problem solving,” Eurasia Journal of Mathematics, Science and Technology Education, vol. 19(4), no. em2247, 2023. https://doi.org/10.29333/ejmste/13066.
- T. Buzan, and B. Buzan, “The Mind Map Book: How to Use the Radiant Thinking to Maximize Your Brain’s Untapped Potential” Penguin Book Ltd, London, 1993.
- M. I. Grabar, and K. A. Krasnyanskaya, “Application of Mathematical Statistics in Pedagogical Research. Nonparametric Methods.” Moscow: Pedagogika, 1977.
- V.T. Souto, “Interactive Visualizations in Learning Mathematics: Implications for Information Design and User Experience. Design, User Experience, and Usability. User Experience Design for Diverse Interaction Platforms and Environments. DUXU,” Lecture Notes in Computer Science, no. 8518. Springer, Cham, 2014. https://doi.org/10.1007/978-3-319-07626-3_44.
- V. Dubovyk, and S. Rudnytskyi, “Using Geogebra environment to visualize educational material in the process of training pre-service mathematics teachers,” Physical and Mathematical Education, vol. 34, no 2. pp. 33-37, 2022. https://doi.org/10.31110/2413-1571-2022-034-2-005.
- J. Schoenherr, and S. Schukajlow, “Characterizing external visualization in mathematics education research: a scoping review,” ZDM Mathematics Education, vol. 56, pp. 73–85, 2023. https://doi.org/10.1007/s11858-023-01494-3.
- F.F. Firmansyah, C. Sa’dijah, S. Subanji, and A. Qohar, “Metacognition strategic use in improving students’ geometric thinking on solving Pisa test,” AIP Conf., vol. 3049 (1), no. 030008, 2024. https://doi.org/10.1063/5.0195409.
- Trimurtini, S.B. Waluya, Y.L. Sukestiyarno, and I. Kharisudin, “A Systematic Review on Geometric Thinking: A Review Research between 2017-2021,” European Journal of Educational Research, vol. 11(3), pp. 1535-1552, 2022. https://doi.org/10.12973/eu-jer.11.3.1535.
- A. Tushev, and V. Chupordia, “Application of the Geogebra to the formation of research skills in the creation of dynamic applets in geometry,” Physical and Mathematical Education, vol. 34, no 2, pp. 43-49, 2022. https://doi.org/10.31110/2413-1571-2022-034-2-007.
- S. Bokosmaty, M.F. Mavilidi, and F. Paas, “Making versus observing manipulations of geometric properties of triangles to learn geometry using dynamic geometry software,” Computers and Education, vol. 113, pp. 313-326, 2017. https://doi.org/10.1016/j.compedu.2017.06.008.
- L. Vízek, L. Samková, and J.R. Star, “Investigating How Lower Secondary School Students Reason about Quadrilaterals Emerging in Dynamic Constructions,” International Journal of Mathematical Education in Science and Technology, pp. 1-20, 2023. https://doi.org/10.1080/0020739X.2023.2255184.
- K. Jones, “Providing a foundation for deductive reasoning: Students’ interpretations when using dynamic geometry software and their evolving mathematical explanations,” Educational Studies in Mathematics, vol. 44(1/2), pp. 55-85, 2020. https://doi.org/10.1023/A:1012789201736.
- P. Mulesa, “Analysis of normative requirements for the results of professional training of mathematics and computer science teachers in the context of their training for the use of virtual visualization tools,” Physical and Mathematical Education, vol. 37, no. 5. pp. 50-55, 2022. https://doi.org/10.31110/2413-1571-2022-037-5-007.
- OECD, “PISA 2022 Results (Volume I),” The State of Learning and Equity in Education, PISA, OECD Publishing, Paris, 2023. https://doi.org/10.1787/53f23881-en.
- O. Marchenko, “Orghanizacija naukovo-doslidnycjkoji dijalnosti uchniv u aghaljnoosvitnjomu navchaljnomu zakladi [Organization of research activities of students in a secondary school],” Nyva znanj: Naukovo-metodychnyj aljmanakh, vol. 4, pp. 48-52, 2004.
- C. Lewis, “9 Data Visualization Tools That You Cannot Miss in 2019”, 2019. https://towardsdatascience.com/9-data-visualization-tools-that-you-cannot-miss-in-2019-3ff23222a927.
- N. Rashevska, “Model formuvannia doslidnytskykh kompetentnostei uchniv na urokakh matematyky [Formation of researching competence model of students in mathematics],” Scientific Herald of Uzhhorod University. Series: Pedagogy. Social work, vol. 1(40), pp. 238-241, 2017.
- O. Silkova, “Pedahohichna tekhnolohiia vizualizatsii navchalnoi informatsii [Pedagogical technology of visualization of educational information],” The scientific journal of the M.P. Dragomanov NPU. Series 5. Pedagogical sciences: realities and prospects, vol. 62, pp. 180-183, 2018.
- M. Vira, and P. Samusenko, “The application of geogebra software for solving algebraic problems with a parameter,” Physical and Mathematical Education, vol. 38, no 1, pp. 7-13, 2023. https://doi.org/10.31110/2413-1571-2023-038-1-001.
- O. Kondratiuk, and R. Shulga, “Pedahohichni umovy formuvannia doslidnytskykh umin molodshykh shkoliariv na urokakh matematyky zasobamy intehrovanoho navchannia [Pedagogical conditions of formation of research skills of primary school pupils in mathematics lessons by means of integrated learning],” Human Studies. Series of Pedagogy, vol. 12(44), pp. 99–104, 2021. https://doi.org/10.24919/2413-2039.12/44.15.
- J.L. Prieto-González, and R.E. Gutiérrez-Araujo, “Geometry learning with dynamic software in pre-service mathematics teacher education: A systematic review,” Educ Inf Technol, 2024. https://doi.org/10.1007/s10639-024-12756-2.
- G. Lei, L. Xingjuan, and J. Shaoli, “Cultivation strategy of junior middle school students' intuitive imagination literacy based on computer software - the Geometer's Sketchpad,” In: 11th International Conference on Information Technology in Medicine and Education (ITME), Wuyishan, Fujian, China, pp. 595-599, 2021. https://doi.org/10.1109/ITME53901.2021.00126.
- J.L. Prieto-González, and R.E. Gutiérrez-Araujo, “Geometry learning with dynamic software in pre-service mathematics teacher education: A systematic review,” Educ Inf Technol, 2024. https://doi.org/10.1007/s10639-024-12756-2.
- N. Sinclair, and O. Robutti, “Technology and the Role of Proof: The Case of Dynamic Geometry,” Third International Handbook of Mathematics Education, vol. 27, pp. 571-596, 2013. https://doi.org/10.1007/978-1-4614-4684-2_19.
- L. Bilousova, and N. Zhytenyova, “Funktsionalnyi pidkhid do vykorystannia tekhnolohii vizualizatsii dlia intensyfikatsii navchalnoho protsesu [Functional approach to the use of visualization technologies for the intensification of the educational process],” Information technologies and teaching aids, vol. 57 (1), pp. 38-49, 2017. http://nbuv.gov.ua/UJRN/ITZN_2017_57_1_6.
- U. Dello Iacono, “From Argumentation to Proof in Geometry Within a Collaborative Computer-Based Environment,” Digital Experiences in Mathematics Education, vol. 7, pp. 395–426, 2021. https://doi.org/10.1007/s40751-021-00090-y.
