Students’ Results Prediction Using Machine Learning Algorithms and Online Learning during the COVID-19 Pandemic

Author: Najat Messaoudi, Jaafar K. Naciri, Bahloul Bensassi
Journal: International Journal of Modern Education and Computer Science @ijmecs
Article in issue: 4 vol.16, 2024.
Free access
Machine learning-based prediction models are valuable prediction tools for assessing university performance as well as decision support tools for university governance and higher education system design. The prediction of student outcomes to enhance learning and teaching quality is one subject that has attracted considerable attention for different purposes. The first objective of this study is to develop and validate a prediction model using Machine Learning algorithms that predict students' outcomes in the case of Moroccan universities based only on the outcomes of courses taken in the previous semesters of university studies. This prediction model can be used as a basis for many subsequent studies on different aspects of higher education such as governance, pedagogy, etc. As a first application, we explore the responses of this prediction tool to analyze the outputs of the online learning experience that took place during the Covid-19 pandemic period. To achieve this, four machine learning algorithms are tested such as J48 decision tree, Random Forest, Multilayer Perceptron, and Naïve Bayes. The experimentations are developed by using Weka and the two metrics “accuracy” and “ROC Area” enable to assess the predictive performance of the models. The obtained results show that the Random Forest-based model provides superior results, as evidenced by its accuracy-ROC area, which reached an accuracy of 90% with a ROC Area of 95%. The use of this model to explore the outcomes of the distance learning experience taken during the Covid-19 pandemic, reveals a failure in the prediction performance of the model during the Covid-19 pandemic period, which indicates a change in the system's behavior during this period when teaching moved to the full online version in the year 2019/2020 and returned fully face-to-face in the 2021/2022 year. The failure in the machine learning algorithms' performance when the system changes its behavior can be a limitation of using prediction models based on machine learning in this context. On the other hand, these models can be used if they are properly designed to identify changes in the behavior of a system as shown in this study. Therefore, the proposed Random Forest-based model has the capability to forecast student outcomes accurately and can be applied for diverse analyses within the Moroccan education system. These analyses include but are not limited to identifying students at risks, guiding student orientation, assessing the influence of teaching approaches on student achievement, and evaluating training effectiveness, among others.
Machine Learning, Prediction, Classifiers, Random Forest, J48, MLP, NB, Online learning, Academic performance
Short address: https://sciup.org/15019176
IDR: 15019176 | DOI: 10.5815/ijmecs.2024.04.02
Text of the scientific article Students’ Results Prediction Using Machine Learning Algorithms and Online Learning during the COVID-19 Pandemic
Higher education systems face many challenges as quality control, information management, needs of local societies, and costs. Universities are an important tool for the training of human capital and have a significant impact on development and economic growth, therefore their effectiveness needs to be enhanced and their performance must be evaluated [1, 2]. Due to their role in the development processes, these organizations are expected to continuously adapt to the demands of their environment in an increasingly competitive market [3, 4, 5, 6, 7]. This adaptation process naturally benefits from the rise of digital technology. Information and communication technologies (ICT), in addition to their role in society, forces new teaching and research practices into universities [8]. Therefore, the gradual use of ICT has had a significant impact on higher education, which is evident in the development of smart learning environments on a global level [9, 10, 11, 12]. New forms of learning, based on ICT, are developing worldwide providing knowledge and skills on a large scale [9].
Moreover, the evaluation of the performance of higher education becomes an important factor to ensure quality [7, 13]. For this purpose, various models for assessing the performance of universities, programs, and courses are proposed. Some of them are analytical models [14, 15] whose exploitation remains limited since they generally require the availability of fairly extensive data. Other are statistical models based on sociological correlations to identify performance factors, which also refer to complex data with reduced availability [16, 17, 18]. Other works propose student flow models for system management purposes [19] or prediction models based on machine learning [20, 21, 22, 23, 24, 25]. The latter, machine learning-based models, prove to be effective as prediction tools but their use is still in progress, particularly in the case of Moroccan universities. Indeed, predictive tools can serve multiple purposes, they can be used to assess university performance or to improve teaching methods. They can also be applied to the governance of universities and the design of higher education systems as a decision-support tool.
The objective of this study is to develop a prediction model using Machine Learning algorithms that predicts students' outcomes in the case of Moroccan universities and to use this tool to evaluate the performance of online learning as it took place during the Covid-19 pandemic period.
Several works concerned the use of machine learning algorithms to predict academic performance, they mainly focused on three aspects. The first is the definition of the forms in which academic performance results should be predicted; the second is the identification of the critical factors that influence academic performance; and the third is the elaboration of effective models for academic performance prediction. A systematic literature review on predicting student academic performance using data mining and machine learning techniques was conducted by [26]. This study examined 62 papers published in 7 databases of which 56.45% were in peer-reviewed journals and 43.55% in proceeding conferences between 2010 and November 2020 and was interested in synthesizing the results of these works by focusing on the three aspects mentioned above.
For the first aspect concerning the different forms of predicting academic performance outcomes, the study [26] was mainly interested in predicting the achievement of learning outcomes which represents a proxy for academic performance. The authors conclude that the prediction models developed in the papers studied can predict learning outcomes in different forms. Thus, more than 54% of the works predicted learning outcomes in the form of performance classes generally of two classes such as “pass” – “fail”, “certification” – “no certification”, and "on-time graduation" -"no on-time graduation" or four classes such as “high risk”, “medium risk”, “low risk”, and “no risk”. 32% of the works predicted learning outcomes in the form of achievement scores. The remaining work predicted them either as perceived competence or as failure and graduation rates or other.
The study's second finding, which is related to the identification of critical factors that affect student outcomes, is that there aren't any explanatory models that can pinpoint the factors that affect student outcomes at the course and program levels. Only three key factors - student online learning characteristics, assessment outcomes, and student emotions - were identified as having a substantial influence on the accuracy of student outcome predictions, according to nearly 30% of the work. The results of over 30% of the research were ambiguous on the effects of the characteristics they explored. The authors conclude that generalization of these results cannot be done because the efficacy of these predictive models is only known for the datasets on which they were trained and because of the difference in the number of courses used to understand the influence of certain characteristics on student learning in the different works discussed.
In the third part of this study, the authors concluded that almost 86% of the models synthesized were based on statistical modeling and supervised machine learning algorithms to forecast the learning results. Unsupervised machine learning algorithms were applied by only a few models. The most used classification algorithms for learning models include regression, neural networks, and tree-based models. This synthesis shows that Hybrid Random Forest, 3-L feedforward neural network, and Naive Bayes are the highest-performing predictive models.
In contrast to works done after this synthesis, [27] used various machine learning models for predicting academic achievement to identify low-achieving students. A database with 480 records and 16 attributes was used for the investigation. According to their findings, Support Vector Machine (SVM) had the highest prediction accuracy (70.8%), followed by Random Forest (RF) (69.7%), Logistic Regression (LR) (67.7%), Multilayer Perceptron (MLP) (64.5%), and finally Decision Tree (DT) (46.8%). While [28] investigated various prediction models utilizing the DAPODIKA
Indonesian Standardized Database and score history data from three schools in Indonesia with a total of 759 students and 33 factors to predict students' final grades. The findings of this work demonstrated that each algorithm performs predictions with a varied level of accuracy even while using the same attributes from different schools’ datasets. K-Nearest Neighbors (KNN) has the best forecast performance for the first school (77.36%), Decision Tree (DT) has the best performance for the second school (85.71%), and Naïve Bayes (NB) has the best performance for the third school (79.41%). In other research and in order to predict students' academic performance, the application of six classifiers on three different databases was compared: C5.0, J48, CART, NB, SVM, KNN, and RF. Three databases are gathered: one from Kaggle, which has 480 records and 16 attributes, and two from UCI Machine Learning Repository, one with 395 records and 33 attributes and the other with 133 records and 32 attributes. The results of the model performance comparison revealed that RF and C5.0 provide the best prediction performance for the three databases after using the attribute selection and optimization procedures for the various databases and classifiers. Thus, the prediction performance obtained by the classifier C5.0 is for database 2 which is between 99 and 100% when the confidence factor (CF) is set to 0.6 and the number of trials is 9. When there are 20 trees, RF achieves 100% of its maximum performance for database 2.
To forecast student academic performance, many research studies develop prediction models based on machine learning algorithms. It is demonstrated that some of them perform better than others. It appears from these works that choosing the best algorithm depends heavily on data. To improve the prediction performance of these models, some works investigate various methods of selection of the attributes that influence the student's performance and the prediction performance of the models. Others use techniques for optimizing the hyper parameters of the algorithms to increase their prediction performance. In other papers, it is suggested to combine a group of classifiers to create an ensemble learning technique to achieve better predictive performance [29]. The most popular ensemble techniques are boosting and bagging. The bagging approach involves replacing a random sample of data from a training set. The classifier models are then trained individually after producing numerous samples of data, and depending on the task, the prediction will either be the average of the individual predictions in the case of regression or the majority of the predictions in the case of classification. As a result, the prediction is more accurate.
Other studies have explored the use of unsupervised learning (UL) and deep learning to predict student academic performance. Indeed, the use of unsupervised learning for predicting student performance is less common than supervised learning [26]. UL is mainly used for data mining, dimensionality reduction and clustering. It can be used to segment students into homogeneous groups based on their learning behaviors or performance, which can help personalize teaching and student support. Although unsupervised learning can offer interesting prospects for predicting student performance by identifying hidden patterns in the data, its use in this field is less widespread than supervised learning.
Conversely, deep learning methodologies such as convolutional neural networks (CNNs) and recurrent neural networks with long-term memory (RNN-LSTMs) have demonstrated their potential in predicting student performance at different phases of courses, including at the mid-point of online course delivery [30].
Previous research demonstrated that it is possible to forecast students' outcomes, but the transferability and generalizability of the prediction model across different courses are still limited. One of the main causes of this situation is that the performance of prediction models is affected by the variety of attributes and the categorizations used by the different prediction models. In this study, we aimed at developing a prediction model for Moroccan universities' courses.
The first objective of this study is to develop and validate a prediction model using Machine Learning algorithms that predict students' outcomes in the case of Moroccan universities based only on the outcomes of courses taken in the previous semesters of university studies. Note that this tool can be applied to any other type of educational system if it is based on the validation of previous teaching sessions. This prediction model, if sufficiently reliable, can be used as a basis for many subsequent studies on different aspects of higher education such as governance, pedagogy, etc. As a first application, we use the responses of this prediction tool to explore the outputs of the distance learning experience that took place during the Covid-19 pandemic period.
This is the second objective of this work which consists in applying the proposed model to compare the predicted results of student success with the actual results obtained by these students during the Covid-19 pandemic. The purpose is to characterize the changes in system behavior resulting from the change introduced by Covid-19 pandemic.
In fact, the Covid-19 pandemic has caused unprecedented disruption in all sectors, including the educational world. This forced many universities to immediately switch to online learning to ensure continuity of learning. Additionally, many academic institutions that were previously unwilling to change their traditional pedagogical approach were left with no choice but to transition to fully online learning.
Therefore, the first interest of this research is to obtain a validated prediction tool for Moroccan universities, which could be used as a decisive tool in the management of educational systems, in the choice of student orientation, and as a tool for improving the performance of university training by providing additional information on the effectiveness of pedagogical and organizational choices. The second interest of this research is to obtain some highlights about the period of the Covid-19 pandemic, when distance and hybrid learning began to be massively adopted and whose impact continues, and also show some limitations on the use of machine learning algorithms in case of sudden changes in system behavior.
To accomplish the first goal, we examine various machine learning algorithms, J48 Decision Tree, Random Forest (RF), Multilayer Perceptron (MLP), and Naïve Bayes (NB), that predict students' performance solely using their prior results as training data. After a review of these algorithms' accuracies, we select the most suitable model for the purpose of this study. To achieve the second objective, we use the established model to predict the students' results for the Covid-19 period. We then compare these predictions to the actual student outcomes to examine the system behavior during this period.
The originality of this work lies in the fact that it proposes a prediction model for student results in Moroccan universities, based solely on the students' previous results, due to the availability and reliability of this data. In general, models are also based on students' personal data such as gender, parents' occupation, students' income, residence, family size, parents' education / occupation, distance traveled, but these data are not commonly available in Moroccan universities databases and are therefore unusable.
However, despite the limited information fields available in the databases, the proposed model is suitable for use in various studies and analyses of the Moroccan higher education system, either for aspects in relation to system governance to improve system performance, or for pedagogical purposes to improve student learning.
The rest of this paper is organized as follows: Section 2 describes the methodology used to carry out this work and in section 3 the results obtained are presented and discussed. Finally, section 4 concludes this work.
2. The Proposed Methodology
The first purpose addressed by this study concerns the development of a prediction model based on machine learning algorithms to forecast student performance, and the second involves using the developed model to examine how the educational system's behavior was impacted during the Covid-19 pandemic.
The prediction model is developed by using “Waikato Environment for Knowledge Analysis (WEKA)” which is an open-source software developed at the University of Waikato, New Zealand [31]. WEKA offers tools for processing data, implementing machine learning algorithms, and providing visualization tools to create prediction models. WEKA is often used to build prediction models for academic performance [32, 33, 34, 35].
The proposed student’s outcome prediction model is developed in four main steps as shown in Figure 1 below. These successive steps are the data collection and pre-processing, the training machine learning algorithm, the performance evaluation, and the prediction phase based on new data.
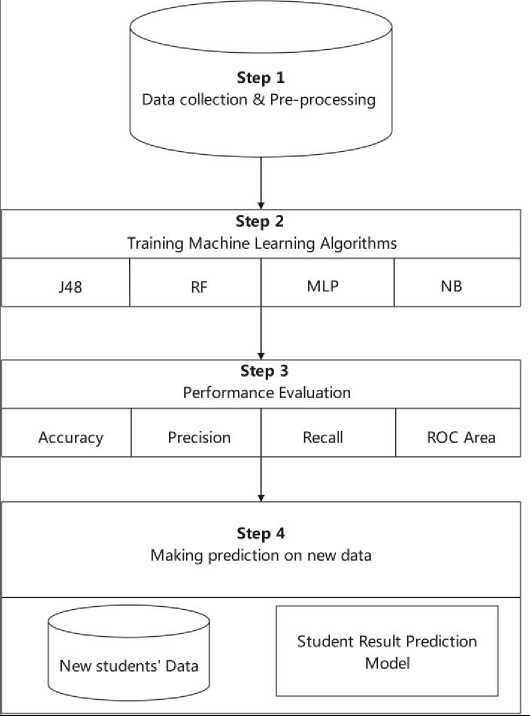
Fig. 1. Steps for developing the prediction model
-
2.1 Data Collection and Pre-Processing
-
2.2 Training Machine Learning algorithms
This step is about the collection and pre-processing of data that will be used to train and test machine learning models. As the objective of this study is to develop a model for predicting students' academic performance based solely on their academic history, the necessary data are retrieved from the student database of the university that delivers the courses under study. Once the data are collected, the next task is the pre-processing of the data which is an important task in the machine learning process because it can help to improve the performance of the model [36]. The data collected may contain several null values and irrelevant fields and this task refers to a set of actions that are performed on data to prepare their use in training and testing machine learning models. Thus, the collected data are cleaned by removing the outliers’ data and by correcting missed data. Categorical attributes are also defined according to the objectives of the study and then the values of attributes are converted to these categorical attributes.
Several machine learning algorithms, mostly Logistic Regression, Artificial Neural Network, K-Nearest Neighbor, Naïve Bayes, Decision Tree, Support Vector Machines, and various ensemble methods have been used in the literature to predict student performance [24]. This study is carried out with the most used algorithms that achieve high predictive performance, namely J48 [24, 28, 37, 38], Random Forest [27, 37, 39], Multilayer Perceptron [27, 37, 38], and Naïve Bayes [28, 32, 39, 40], we briefly recall in what follows the operating mode of these algorithms.
J48 algorithm is used to generate a decision tree based on C4.5 algorithms [35]. The decision tree prediction methods are popular among academics due to their simplicity, ease of use when examining both small and big data sets, and ability to estimate missing attributes and handle unique and variable properties [24]. A set of IF-THEN statements is used to represent the logic that goes into creating a decision tree algorithm which is composed of a root node, several internal nodes, and many leaves. Every internal node corresponds to an attribute, the leaves to the assignment classes, and the arcs between the nodes to the tests conducted on each node. The decision tree has been used in numerous research to forecast student achievement. This method's prediction accuracy is about 70% in [24, 37] , 85.71% in [28], and reaches 90% in some cases [38].
Random forest (RF) is a supervised machine learning algorithm that is frequently employed in classification and regression issues. It is a decision tree-based ensemble learning approach. It involves building several decision trees from split data sets created from the original data while randomly choosing a subset of variables for each decision tree step. Random Forest uses voting to obtain the results of prediction for the classification tasks and the average for the regression tasks. In terms of classification issues, it delivers better results. Random Forest is used in various studies to predict students’ performance [37, 39]. The accuracy of prediction varies between 69.7% [27] and 100% with specific settings.
Multilayer perceptron (MLP) is a supplement of a feed-forward neural network. The input layer, output layer, and hidden layer are the three different kinds of layers that make it up. The input layer is where the input signal for processing is received. The output layer handles the prediction and categorization. The real computational engine of the MLP consists of an arbitrary number of hidden layers sandwiched between the input and output layers. It uses supervised learning, also known as back-propagation, for training [35, 33]. The accuracy reached by this algorithm for predicting students’ performance is around 65% [27].
Naive Bayes (NB) methods are a set of supervised learning algorithms based on the application of Bayes' theorem with the "naive" assumption of conditional independence between each pair of features given the value of the class variable. Naive Bayes classifiers have performed well in a variety of real-world circumstances despite their overly simplistic assumptions. They need a minimal amount of training data to estimate the necessary parameters [32, 40]. The best performance obtained by NB to predict the performance of students is around 79% in [28].
The training of each algorithm is done by splitting the dataset into a train data and a test data and also by using the k-fold cross-validation method. A k-fold cross-validation procedure divides a limited data set into k-folds. Each k-fold can be used as a test set, while all other folds are used as a train set. A total of k models is fitted and evaluated on the k folds and report the average performance [35]. All the models developed are saved for making a prediction on new data.
-
2.3 Performance Evaluation
After training the models, the next step is dedicated to the evaluation of their performance to identify their ability to make predictions on new data and to select the appropriate machine learning algorithm. For this, various evaluation metrics are used for classification problems such as accuracy, precision, recall, F1-Score, and AUC-ROC curve based on the confusion matrix [41].
Actual values and predicted values are represented by the four items TP (True Positive), FN (False Negative), FP (False Positive), TN (True Negative), and FP (False Positive), respectively, in a confusion matrix. TP (True Positive) indicates that both the predicted class and the actual class are True, FN (False Negative) indicates that the class is predicted to be False but that the actual value is True, FP (False Positive) when the predicted class is True and has actual value as False, and TN (True Negative) when both predicted and actual values are False.
Based on the components of this matrix, synthetic indicators are usually introduced. The most common evaluation metric is accuracy, which is calculated as the proportion of the right predictions to all forecasts. However, it is suggested against the use of accuracy when dealing with an imbalanced class distribution [41]. This limitation is overcome by introducing the “precision” and “recall” metrics. The precision metrics are measured as the ratio of the True Positive to the total positive predictions (True Positive and False Positive). The recall, also known as sensitivity, seeks to determine the percentage of true positives that were wrongly classified. The ratio between the number of True Positives and all Positives can be used to compute it. Therefore, recall assesses a classifier's performance regarding a false negative, whereas precision provides information on a classifier's performance concerning a false positive.
The F1-Score, which may be calculated as the harmonic mean of both precision and recall while giving each metric equal weight, can reflect both the Precision and Recall metrics. The F1-score is given by:
2* Precision * Recall
F 1 =----------------
Precision + Recall
In addition to these metrics, the AUC-ROC curve is one of the popular metrics for evaluating the performance of the classification models [41] [42]. The Receiver Operator Characteristic (ROC) curve is a probability curve and is plotted at TPR (True Positive Rate) vs. FPR (False Positive Rate) where the TPR is on the Y axis and the FPR is on the X axis. The Area Under the Curve (AUC) represents the degree of separability: If is closer to 1, it means the model has a high-class separation capacity and if is closer to 0, it means the model has no class separation capacity.
In this study, we will focus on two performance metrics, namely the “Accuracy” which allows knowing the proportion of correct predictions compared to all predictions, and the ROC Area curve which is one of the most significant evaluation measures for assessing the performance of any classification model. It reveals whether the model can differentiate between the various classes. Note that the prediction performance of these models is checked by using a random database to ensure, by the opposition, that the retained training database used to design these models contains relevant information and thus leads to valid predictions.
2.4 Making a prediction on new data
3. Results and Discussion3.1. Data Collection and Pre-Processing
The data are obtained from the student database of Hassan II University of Casablanca as Excel files. Thus, five Excel files related to the academic years 2017/2018, 2018/2019, 2019/2020, 2020/2021, and 2021/2022 were collected.
After the algorithm evaluation step, we proceed to predict the results of new students by using different models. An analysis of the prediction results is then performed to select the appropriate prediction model.
These steps validate the predictive model that predicts the result’s students in a course or a program based solely on their grades prior to that course or program.
This paragraph presents the main results obtained through the implementation of the methodology detailed in the previous section for the case of courses given in a Moroccan university. A forecasting model predicting the 4th-semester results of the “Mathematical Sciences and Application” program of the cycle “license” in a Faculty of Sciences is proposed. This forecast is based on the results of a total of 20 courses during the semesters 1, 2, and 3 studied previously by the students in the university.
Let us note that the “license”, which corresponds to the first three years of study, is the first degree of the higher education cycle in Moroccan universities. There are two semesters in each academic year. The first year is divided into semesters 1 and 2, each with seven modules. The second year is made up of semesters 3 and 4, each of which has 6 modules. The third year is made up of semesters 5 and 6, each of which has 6 modules.
The next step was the data pre-processing which is a crucial task that is used before applying machine learning algorithms. Data preprocessing involves data cleaning, data transformation, and feature selection.
Data cleaning: Data cleaning entails the elimination of irrelevant or null records from the dataset, ensuring its integrity. This step involves identifying and removing any null or redundant values. Table 1 below illustrates the number of students per year before and after data cleaning, indicating the removal of records containing missing values.
Table 1. Number of students before and after Data Cleaning
|
Number of students before Data cleaning |
Number of students After Data cleaning |
|
|
2017/2018 |
138 |
135 |
|
2018/2019 |
104 |
99 |
|
2019/2020 |
84 |
82 |
|
2020/2021 |
63 |
59 |
|
2021/2022 |
53 |
52 |
Data Transformation: Data transformation is also considered one of the main steps in preprocessing process. So, the dataset used in this research is educational dataset, where course results from all previous semesters are taken into account. Student results are converted into categorical values to represent class labels for classification. These categorical values are "V" for validated result and "NV" for non-validated result. The Excel files are then converted into CSV files which is a WEKA-compatible format.
So, the 2017/2018 file, used for training machine learning models, contains results obtained by 135 students with 21 attributes, which are the results of the Semester 1, Semester 2, and Semester 3 courses and the 4th-semester’s results received by the students. Files related to the other years are used as new data for the prediction model to predict the 4th-semester result of each year. Figure 2 below shows the number of students for each year.
Number of students
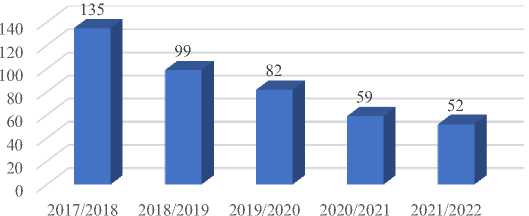
Fig. 2. Number of students by academic year
-
3.2. Training Machine LearningAlgorithms
For training the four algorithms chosen, J48, RF, MLP, and NB, we insert in Weka the 2017/2018 year’s file as training data as shown in Figure 3. The blue bar represents the number of students that have validated the 4th-semester and the red bar represents the number of students that do not validate this semester.
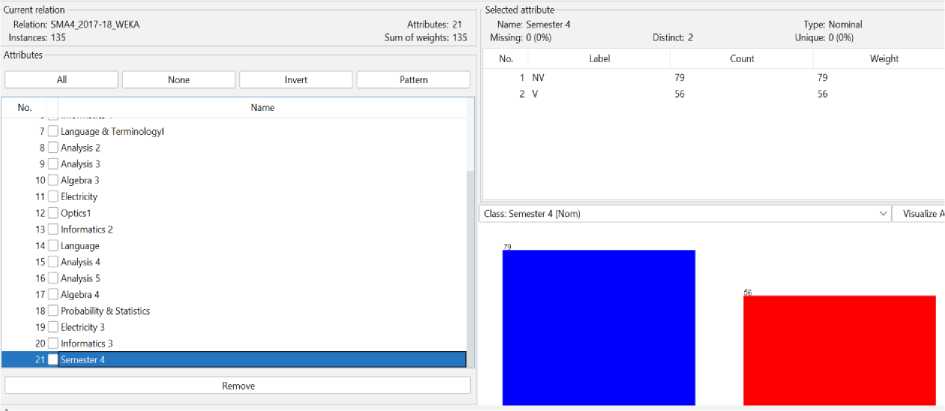
Fig. 3. Visualization of the training dataset in Weka
Figure 4 presents the characteristics of the 21 database attributes in form of graphs. Each graph corresponds to a characteristic that denotes a certain course. There are two bars on each graph for a course. The first bar represents the proportion of students who have validated the course in question, and the second bar represents the proportion of students who have not. The proportion of students who have validated 4th-semester is shown by the blue color in both bars, whereas the proportion of students who have not validated 4th-semester is represented by the red color.
Considering the first graph in this Figure as an example, that graph corresponds to the characteristics of the "Analysis1" course. The first bar indicates that 122 students have validated the course “Analysis1”, whereas the second bar indicates that 13 students have not validated the course "Analysis1". Each bar's red color indicates the proportion of students who have validated 4th-semester, while the blue color indicates the proportion of students who have not.
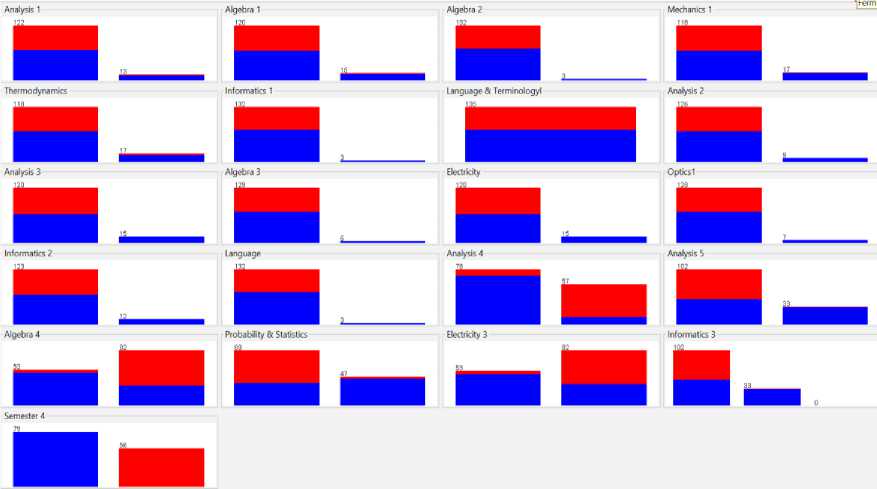
Fig. 4. Visualization of the attributes in Weka
Figure 5 below shows in detail the correlation between the results of the "analysis1" course example and the results of the 4th-semester.
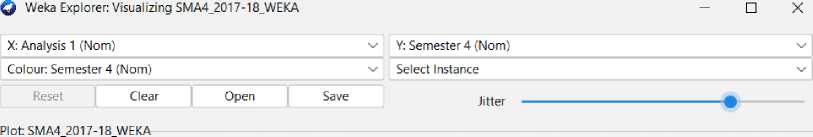
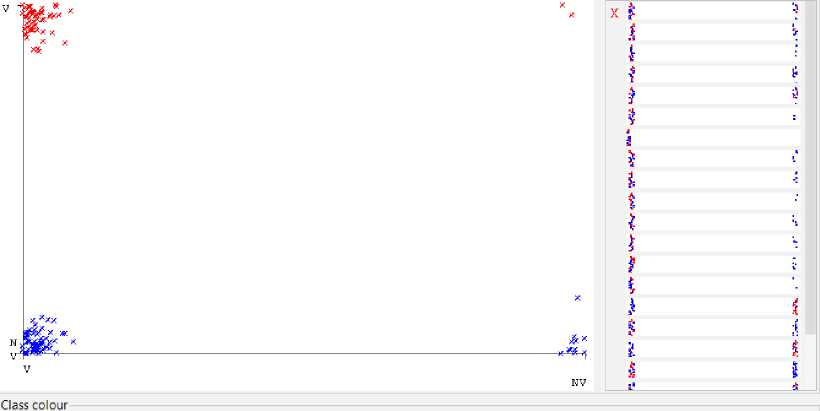
Fig. 5. Correlation between the “Analysis1” course results and the semester 4 results
The training of each algorithm is done by splitting the dataset into 70% as train data and 30% as test data which is widely used [43, 33, 44] and also by using the 15-fold cross-validation method. Several tests with different values of these parameters were performed and the comparison of the prediction performance metrics showed that the best results are obtained with the retained values.
Figure 6 below outlines the operating principle of the J48 algorithm’s training model in Weka, for which the output is the prediction performance of the algorithm illustrated in Figure 7.
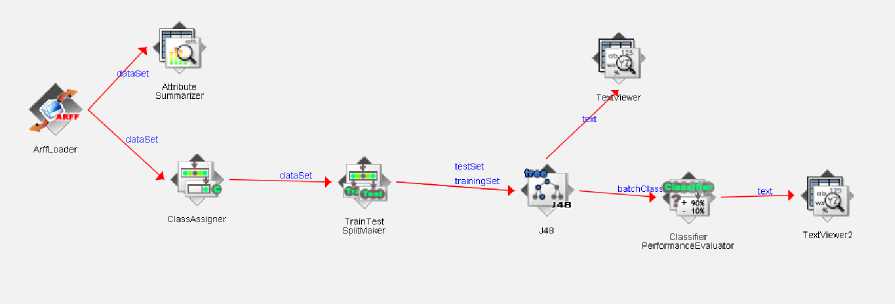
Fig. 6. J48 algorithm’s training model in Weka
The input of the model is the ‘ArffLoader’ module which allows the loading of the training database. This module is then connected to the ‘ClassAssigner’ module using the ‘dataset’ connection, in which the 4th-semester attribute is specified as the class attribute. The values from the training database are merged in the next module, ‘TrainTest SplitMaker’. This example splits the database into 30% for the test set and 70% for the train set. The ‘J48 classifier’ module is then linked to this one via the train-set and test-set connections. The first connection enables the model's training, and the second connection enables the model's application as a predictor of test data and the comparison of the predictions with the actual value in the data. The trained model is then connected to the ‘ClassifierPerformanceEvaluator’ module on one side to assess the trained model's prediction performance, and to the ‘TextViewer’ module on the other side to display the trained model. The ‘ClassifierPerformanceEvaluator’ module is linked to a ‘textviewer2’ module to visualize the performance metrics. For more details concerning the operation principle in WEKA, see [31].
The models resulting from this training for the four selected algorithms are saved in Weka as well as the performances of each model. Figure 7 to 10 show the performance metrics for these algorithms by using 15-fold cross validation. These results and the results by splitting the data set into 70% training-set and 30% for test-set are analyzed in the next step.
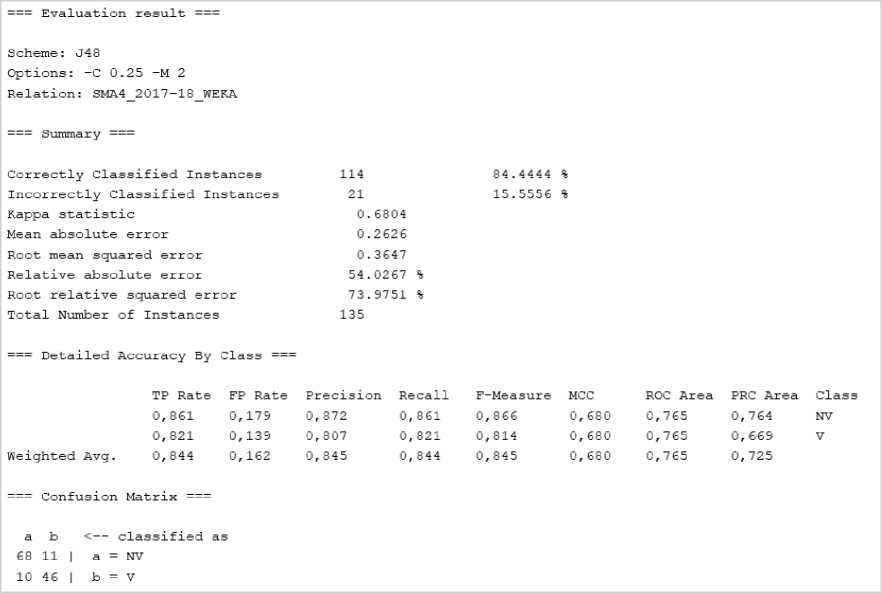
Fig. 7. J48 algorithm performance metrics with 15-fold cross validation
|
--- Evaluation result --- |
||||||
|
Scheme: RandomForest Options: -P 100 -I 100 -num-slots 1 Relation: SMA4_2017-18_WEKA === Summary === Correctly Classified Instances Incorrectly Classified Instances Kappa statistic Mean absolute error Root mean squared error Relative absolute error Root relative squared error Total Number of Instances = Detailed Accuracy By Class = |
-K 0 -M 1.0 -V 0. 108 27 0.5954 0.2641 0.396 54.3319 % 80.309 % 135 |
,001 -S 1 80 20 |
% |
|||
|
TP Rate FP Rate |
Precision Recall |
F-Measure |
MCC |
ROC Area |
PRC Area |
Class |
|
0,785 0,179 |
0,861 0,785 |
0,821 |
0,599 |
0, 810 |
0, 815 |
NV |
|
0,821 0,215 |
0,730 0,821 |
0,773 |
0, 599 |
0, 810 |
0, 683 |
V |
|
Weighted Avg. 0,800 0,194 === Confusion Matrix === a b <— classified as 62 17 | a = NV 10 46 | b = V |
0,807 0,800 |
0, 801 |
0,599 |
0, 810 |
0,761 |
|
Fig. 8. RF algorithm performance metrics with 15-fold cross validation
--- Evaluation result ---
Scheme: MultilayerPerceptron
Options: -L 0.3 -M 0.2 -N 500 -V 0 -S 0 -E 20 -H a
Relation: SMA4_2017-18_WEKA
=== Summary ===
Correctly Classified Instances 108 80 %
Incorrectly Classified Instances 27 20 %
Kappa statistic 0.5954
Mean absolute error 0.2604
Root mean squared error 0.4067
Relative absolute error 53.5792 %
Root relative squared error 82.4962 %
Total Number of Instances 135
=== Detailed Accuracy By Class ===
|
TP Rate |
FP Rate |
Precision |
Recall |
F—Measure |
MCC |
ROC Area |
PRC Area |
Class |
|
|
0,785 |
0,179 |
0, 861 |
0, 785 |
0, 821 |
0,599 |
0, 833 |
0, 866 |
NV |
|
|
0,821 |
0,215 |
0,730 |
0, 821 |
0,773 |
0,599 |
0,833 |
0,737 |
V |
|
|
Weighted Avg. |
0, 800 |
0,194 |
0, 807 |
0, 800 |
0, 801 |
0,599 |
0, 833 |
0,812 |
— Confusion Matrix --- a b <— classified as
62 17 | a = NV
10 46 | b = V
Fig. 9. MLP algorithm performance metrics with 15-fold cross validation
--- Evaluation result ---
|
Scheme: NaiveBayes Relation: SMA4_2017-18_WEKA |
||||
|
--- Summary --- |
||||
|
Correctly Classified Instances Incorrectly Classified Instances Kappa statistic Mean absolute error Root mean squared error Relative absolute error Root relative squared error Total Number of Instances |
108 27 0.6015 0.1947 0.4005 40.0593 % 81.221 % 135 |
80 20 |
- |
|
|
=== Detailed Accuracy By Class === |
||||
|
TP Rate FP Rate 0,747 0,125 0,875 0,253 Weighted Avg. 0,800 0,178 |
Precision Recall 0,894 0,747 0,710 0,875 0,818 0,800 |
F-Measure 0,814 0,784 0,801 |
MCC 0, 613 0, 613 0, 613 |
ROC Area PRC Area Class 0,874 0,917 NV 0,874 0,754 V 0,874 0,849 |
|
=== Confusion Matrix === |
||||
|
a b <— classified as |
||||
|
59 20 | a = NV 7 49 | b = V |
||||
Fig. 10. NB algorithm performance metrics with 15-fold cross validation
-
3.3. Performance evaluation
Table 2 shows the different metrics for evaluating the performance of trained models by using 15-fold crossvalidation and Table 3 summarizes the different metrics by splitting the dataset into 70% for train set and 30% for test set.
Table 2. Metrics for evaluating the performance of algorithms by using Cross Validation
|
15-fold Cross-validation |
||||
|
Accuracy |
Precision |
Recall |
ROC Area |
|
|
J48 |
84.4% |
84.5% |
84.4% |
76.5% |
|
RF |
80% |
80.7% |
80% |
81% |
|
MLP |
80% |
80.7%% |
80% |
83.3% |
|
NB |
80% |
81.8% |
80% |
87.4% |
Table 3. Metrics for evaluating the performance of algorithms by splitting the trainset
|
Train_set=70% et test_set=30% |
||||
|
Accuracy |
Precision |
Recall |
ROC Area |
|
|
J48 |
92.5% |
92.6% |
92.5% |
92.6% |
|
RF |
90% |
90.5% |
90% |
95% |
|
MLP |
85% |
86.6% |
85% |
77.2% |
|
NB |
87.5% |
90.1% |
87.5% |
96.5% |
The comparison of the accuracy of the different algorithms is represented in Figure 11 below:
Accuracy by algorithm
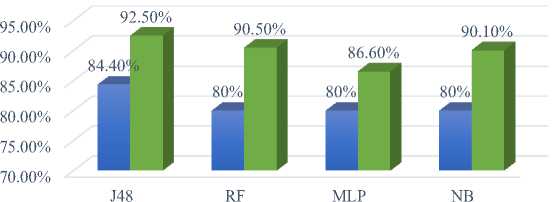
Fig. 11. Comparison of the accuracy of the algorithms
Before using the developed predictive models to make predictions on new data, and to ensure that the dataset of the 2017/2018 year used to train the different models allows giving valid prediction results, a random database is used to train the algorithms and the performance metrics of these algorithms are recorded. Figure 12 summarizes the characteristics of this dataset.
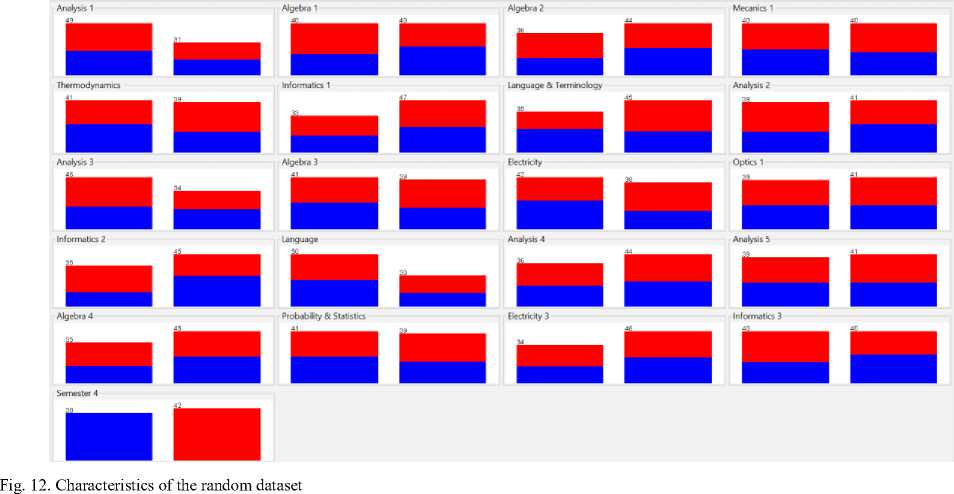
The results of this step are summarized in table 4 below:
Table 4. Performance evaluation by using a random dataset
|
Cross validation = 15 |
||||
|
Accuracy |
Precision |
Recall |
ROC Area |
|
|
J48 |
52.5% |
52.6% |
52.5% |
53.5% |
|
RF |
53.75% |
53.8% |
53.8% |
44.9% |
|
MLP |
48.75% |
48.7% |
48.8% |
49.9% |
|
NB |
45% |
44.7% |
45% |
44.4% |
We notice that by using a random database, the order of magnitude of the performance metrics is 50% for the four algorithms studied. This average of 50% agrees with the random draw on a large number of students of the two possible results which are V and NV. On the other hand, the orders of magnitude obtained for the real data are 80% to 90% depending on the algorithms, which means that relevant information is indeed contained in these data.
To finalize the selection of the most appropriate model, prediction of 4th-semester outcomes for the 2018/2019 year is made by using the four models. The analysis of the prediction results is presented below.
-
3.4. Making a prediction on new data
After the evaluation of the algorithms based on data from the academic year 2017/2018, the prediction of student results with different algorithms for the following year 2018/2019 is made to compare the prediction results with the actual results and identify the best-performing algorithm. Table 5 summarizes the obtained results for the 4th-semester forecasts for the year 2018/2019.
Table 5. Prediction results for the 4th semester of the 2018/2019 year
|
Real results |
Prediction with 70% train set and 30% test set |
Prediction with 15-fold Cross Validation |
|||||||
|
J48 |
MLP |
NB |
RF |
J48 |
MLP |
NB |
RF |
||
|
Students who validate the 4th semester |
28 |
32 |
37 |
42 |
33 |
32 |
37 |
42 |
33 |
|
Students who don’t validate the 4th semester |
71 |
67 |
62 |
57 |
66 |
67 |
62 |
57 |
66 |
|
Total |
99 |
99 |
99 |
99 |
99 |
99 |
99 |
99 |
99 |
|
Validation Rate |
28.28% |
32.3% |
37.37% |
42.42% |
33.33% |
32.3% |
37.37% |
42.42% |
33.33% |
Note that the results differ from one algorithm to another but that for the same algorithm, the predictions are identical for type “database split” or type “cross validation” learning methods. The confusion matrix and the accuracy of each algorithm for the prediction results are shown in Table 6 below.
Table 6. Confusion matrix and the prediction accuracy by algorithm for the 2018/2019 year
|
J48 |
RF |
MLP |
NB |
|
|
TP |
26 |
26 |
26 |
26 |
|
FP |
63 |
62 |
58 |
54 |
|
TN |
6 |
7 |
11 |
16 |
|
FN |
4 |
4 |
4 |
3 |
|
Accuracy |
89,90% |
88,89% |
84,85% |
80,81% |
These findings, with accuracies reaching nearly 90% for RF and J48 algorithms, suggest that machine learning algorithms can be used with some confidence to forecast student outcomes merely based on their prior performance. Knowing that other characteristics, such as demographic, socioeconomic, academic, and environmental factors, play a role in a student's success [22, 27, 32, 26, 28], it can be singular to note that even if these aspects were not considered, the results obtained present an accuracy of the order of 90%. One explanation is to consider that these aspects are already implicitly incorporated to some degree into the outcomes that the students have already obtained and which are the basis of the predictions made.
-
3.5. Students’ outcomes prediction during the Covid-19 pandemic period
To highlight the changes in system behavior resulting from the change introduced by Covid-19 pandemic, we proceeded first to predict the results of 4th-semester by the Random Forest of 2017/2018 year whose data constituted the training data. Then the prediction of the results of the 4th-semester of the year 2018/2019, which is the year before Covid-19, are made as well as those of the following years. Note that during the Covid-19 year, 2019/2020, teaching that was entirely face-to-face has shifted towards a fully online configuration. For the academic year 2020/2021, the 4th semester was taught in a hybrid version, mixing a face-to-face part and another remotely. Finally, for the year 2021/2022 the teaching is all-face-to-face.
The prediction results, compared to the real results, are gathered in Table 7 below and illustrated in Figure 13.
Table 7. predicting semester 4 results from 2017/2018 through 2021/2022
|
2017/218 |
2018/2019 |
2019/2020 Covid-19 year |
2020/2021 |
2021/2022 |
||||||
|
Face-to-face Learning |
Face-to-face Learning |
Online Learning |
Hybrid Learning |
Face-to-face Learning |
||||||
|
Real |
Predicted |
Real |
Predicted |
Real |
Predicted |
Real |
Predicted |
Real |
Predicted |
|
|
V |
56 |
60 |
28 |
33 |
38 |
30 |
26 |
27 |
15 |
25 |
|
NV |
79 |
75 |
71 |
66 |
44 |
52 |
33 |
32 |
37 |
27 |
|
Validation Rate |
41.48% |
44.4% |
28.28% |
33.33% |
46.34% |
36.9% |
44.07% |
45.76% |
28.9% |
48% |
Real results vs Predicted results for the Validation rate
50% 40% 30% 20% 10% 0%
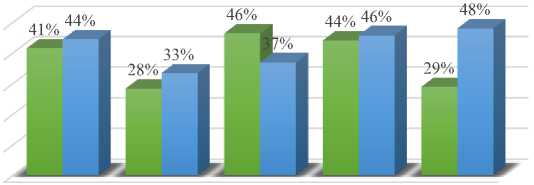
2017/2018 2018/2019 2019/2020 2020/2021 2021/2022
-
■ Real Results ■ Predicted Results
Fig. 13. Comparison between actual and predicted results for semester 4 by year
According to these results, the prediction model predicts a validation rate of 44% of the 4th-semester for the 2017/2018 training year, which was effectively 41%. This result is typically attributable to the 90% prediction accuracy of the random forest algorithm. But during the Covid-19 year, which corresponds to the 2019/2020 year, this semester's behavior changed. In fact, all years other than the Covid-19 year have a predicted validation rate that is greater than the actual rate; contrary to the predicted rate for the Covid-19 year which is lower than the actual rate. This suggests that the abrupt switch to fully online teaching during the Covid-19 year had an impact on the gap between the predicted and the real results of the students. We also note that there is a significant gap for the academic year 2021/2022 when teaching has regained its regular course, i.e., complete face–to–face instruction.
This comparison shows that online teaching during covid-19 did induce a change in the behavior of the training system and this change has an impact on the reliability of predictions made by machine learning algorithms. Indeed, during the covid-19 year, the teachings were shifted from usual presential learning to fully online learning. Several works have focused on the impact of online teaching during the Covid-19 pandemic on the students’ outcomes.
These studies show that this change has had a mixed effect on student results, with some showing a beneficial effect and others a negative one. The results of the study [45], for example, which analyzed the changes implemented in the bachelor’s degree in telecommunication Engineering at the Universidad Politécnica de Madrid, showed an increase in students’ academic performance in emergency remote teaching. Additionally, in [44], which compared the effects of online learning versus face-to-face learning on students' academic achievement in a few mechanical engineering courses at a university in the South Pacific Islands before and during the Covid-19 era, it was demonstrated that using a descriptive statistical method, the online mode of instruction may have better academic performance than face-to-face learning, while the results of non-parametric statistical tests implied insignificant difference. In other cases, in June 2020, a nationwide survey study in the US among STEM students and teachers concluded that the pandemic would cause 35.5% of Ph.D. students, 18.0% of master's students, and 7.6% of undergraduate students to delay graduation [46]. The findings of the study [47], which examined the learning outcomes of six courses in civil engineering degrees indicate that students who did well in face-to-face teaching also fared well in distance learning, but that low-performing students were more negatively impacted. Additionally, the dropout rate for the technology modules was less than 10% while the dropout rate for the core subjects was substantially higher at 22%.
Thus, the findings of our study indicate that the performance for the Covid-19 year is superior to what was expected. However, when learning returns again normal in the 2021–2022 year, the results are less than they ought to be. The explanation for these results may be due to several factors, especially the evaluation method that was adopted during the Covid-19 pandemic year.
In fact, the evaluation of the Covid-19 year teaching in Moroccan universities has mostly focused on the content delivered entirely face-to-face until March 16, 2020, the date of the shutdown of Moroccan universities and the shift to full online teaching. This decision affected student learning in two ways. The first is that students only focused on face-to-face reduced content for exam preparation, which partly explains the higher validation rate during the Covid-19 year, and the second is the loss in learning and knowledge volume, which could be considered partially responsible for a low validation rate in 2021/2022 year when the teaching returned to full presential, as shown by the study's findings.
Furthermore, concerning the gaps between predicted results and actual results, we note that the average gap is around +4% for the years 2017/2018 and 2018/2019, pre-Covid-19 years, while during the Covid-19 year (2019/2020), this gap is -9% and it is +19% for the post-Covid-19 year (2021/2022). This difference in gaps during and after Covid-19 reveals that the model’s outcomes prediction is no longer accurate for these years, which may limit the usage of prediction models based on machine learning prediction algorithms in case of changes in the behavior of a system.
Indeed, the results of this study show that when the behavior of the studied system changes, the prediction performance of machine learning algorithms becomes less reliable because the historical data used to train these algorithms are no longer valid for the new system marked by the change in its behavior. In the case of this study, the training data used for the algorithms are those of students' results during in-person teaching. These data indicate patterns and relationships between different pieces of information that enable the algorithms to learn and predict the results of new data in the same context. When teaching switches to online mode, the context is no longer the same, and the training data do not correspond to this context. Consequently, the algorithms cannot effectively predict with accuracy the results in the modified context. On the contrary side, they can be applied to identify a change in a system's behavior.
On the basis of these findings, recommendations can be proposed for educational policies, mainly concerning student learning assessment methods and distance learning methods.
With regard to the first point, it is recommended that effective and diversified student assessment methods be established, in line with learning objectives, to ensure proper evaluation of the skills and knowledge acquired by students, in order to improve teaching and learning outcomes. Concerning distance learning methods, it is recommended to improve distance learning platforms and online courses to offer an enriching, interactive learning experience, adapted to students' needs, taking into account lessons learned from the COVID-19 pandemic.
4. Conclusion
In this study, a machine learning model for student results prediction in Moroccan universities is developed, this model is based solely on the outcomes of courses taken in the previous semesters of university studies. Tests are carried out with the most used algorithms that achieve high predictive performance namely the J48 decision tree, Random Forest, Multilayer Perceptron, and Naïve Bayes. We experimented on the chosen models using a specific methodology that can be simply adjusted to build more models that can be used to make predictions. The experimentations were developed by using Weka and to evaluate the predictive performance of the models, this research was based on the accuracy and ROC Area.
The outcomes demonstrated that the Random Forest-based model provides superior results, as evidenced by its accuracy-ROC area, which accuracy reached 90% with a ROC Area of 95%. This prediction model can be used for any form of educational institution as long as it is founded on the validation of previous teaching sessions and can serve as a basis for several additional studies on various aspects of higher education. As a first application, the outcomes of the distance learning experience that took place during the Covid-19 pandemic are examined by using the developed prediction model.
The results show that the system's behavior did change during and after the Covid-19 period. In fact, when teaching moved to a fully online version in the Covid-19 pandemic year 2019/2020, the student outcomes actually attained are greater than what should have been predicted by the model. Whereas actual student outcomes in the 2021/2022 year, when instruction is fully face–to–face again, are lower than those predicted by the model. This change is also estimated and measured by the variation in the difference between actual and predicted outcomes for different years. Indeed, while this difference was on average 4% before covid, it is estimated to be -9% for the Covid-19 year and +29% for the post Covid-19 year of return to normal teaching.
This variation in prediction shows a failure in the prediction performance of the model when the system undergoes a change in its behavior which may be a limitation of using prediction models based on machine learning algorithms in this context. On the other hand, these models can be used if they are properly designed to identify changes in the behavior of a system as shown in this study.
Prediction models based on machine learning algorithms are strongly influenced by the quality of the data used. Incomplete, inaccurate or biased data can lead to inaccurate predictions.
In this study, we used databases that were not extensive but sufficiently representative for the studied case, enabling us to analyze the obtained results. The relatively small size of the database allowed fairly easy pre-processing, note that this may no longer be the case for much larger database sizes, in which case the size may constitute a limitation. Furthermore, let us note that the availability of reliable, up-to-date and evolving data over time is a prerequisite to ensure accurate predictions.
Acknowledgements
We would like to thank the Faculty of Sciences Aïn Chock of the Hassan II University of Casablanca for sharing the data, which were anonymized to conduct this study.
References Students’ Results Prediction Using Machine Learning Algorithms and Online Learning during the COVID-19 Pandemic
- X. Zhang et W. Shi, «Research about the university teaching performance evaluation under the data envelopment method,» Cognitive Systems Research, vol. 56, pp. 108-115, 2019.
- S. You, K. Zheng Zhou et L. Jia, «How does human capital foster product innovation? The contingent roles of industry cluster features,» Journal of Business Research, vol. 130, pp. 335-347, 2021.
- K. Janzen, R. Panitz et J. Glückler, «Education premium and the compound impact of universities on their regional economy,» Research Policy, vol. 51, 2022.
- A. Carrascal Incera, A. Kitsos et D. G. Posada, «Universities, students and regional economies: a symbioticrelationship?,» Regional studies, vol. 56, n° %16, pp. 892-908, 2022.
- R. Yang, «Globalisation and Higher Education Development: A Critical Analysis,» International Review of Education , vol. 49, pp. 269-291, 2003.
- J. Youtiea et P. Shapira, «Building an innovation hub: A case study of the transformation of university roles in regional technological and economic development,» Research Policy, vol. 37, pp. 1188-1204, 2008.
- H.-Y. Wu, J.-K. Chen, I.-S. Chen et H.-H. Zhuo, «Ranking universities based on performance evaluation by a hybrid MCDM,» Measurement, vol. 45, pp. 856-880, 2012.
- T. Kattoua, M. Al-Lozi et A. Alrowwad, «A Review of Literature on E-Learning Systems in Higher Education,» International Journal of Business Management and Economic Research, vol. 7, n° %15, pp. 754-762, 2016.
- V. Milicevic, N. Denic, Z. Milicevic , L. Arsic, M. Spasic-Stojkovic, D. Petkovic, J. Stojanovic, M. Krkic, N. S. Milovancevic et A. Jovanovic, «E-learning perspectives in higher education institutions,» Technological Forecasting & Social Change, vol. 166, 2021.
- E. Djeki, J. Dégila, C. Bondiombouy et M. H. Alhassan, «E learning bibliometric analysis from 2015 to 2020,» Journal of Computers in Education, vol. 9, n° %14, pp. 727-754, 2022.
- X. Chen, D. Zou, H. Xie et F. Lee Wang, «Past, present, and future of smart learning: a topic based bibliometric analysis,» International Journal of Educational Technology in Higher Education, vol. 18, n° %12, 2021.
- S. K. S. Cheung, L. F. Kwok et H. H. Yang , «Shaping the future learning environments with smart elements: challenges and opportunities,» International Journal of Educational Technology in Higher Education, vol. 18, n° %116, 2021.
- S. H. Hashemi Petrudi, H. Ghomi et M. Mazaheriasad, «An Integrated Fuzzy Delphi and Best Worst Method (BWM) for performance measurement in higher education,» Decision Analytics Journal, vol. 4, 2022.
- J. Wang, «SOA-based Information Integration Platform for Educational Management Decision Support System,» Mathematical Problems in Engineering, 2022.
- N. Messaoudi, J. Khalid Naciri et B. Bensassi, «Mathematical modelling of output responses and performance variations of an education system due to changes in input parameters,» Advances in Science, Technology and Engineering Systems, vol. 6, n° %11, pp. 327-335, 2021.
- M. Tin, A. Panwar et M. Pant, «DEA for Measuring the Performance of Higher Education Sector: A Case Study of Myanmar,» chez Proceedings of the Seventh International Conference on Mathematics and Computing, 2022.
- O. I. Ramzi, A. V. Subbarayalu, N. K. Al-Kahtani, A. Al Kuwaiti, T. M. Alanzi, A. Alaskar, S. Prabaharan, V. Raman, M. S. M. Gibreel et N. S. Alameri, «Factors influencing service quality performance of a Saudi higher education institution: Public health program students' perspectives,» Informatics in Medicine Unlocked, vol. 28, 2022.
- L. L. Klein, K. M. Vieira, D. R. Marçal et J. R. Lima Pereira, «Lean management practices perception and their influence on organizational performance in a public Higher Education Institution,» TQM Mag., Vols. %1 sur %2ahead-of-print No. ahead-of-print, 2022.
- UNESCO, «Education, Policy & Strategy : Simulation Model EPSSim Version 2.1,» 2005.
- G. Akçapınar, A. Altun et P. Aşkar, «Using learning analytics to develop early-warning system for at-risk students,» International Journal of Educational Technology in Higher Education, vol. 16, 2019.
- Y. Nieto, V. Gacía-Díaz, C. Montenegro, C. Camilo González et R. González Crespo, «Usage of Machine Learning for Strategic Decision Making at Higher Educational Institutions,» IEEE Access, 2019.
- E. Alyahyan et D. Düştegör, «Predicting academic success in higher education: literature review and best practices,» International Journal of Educational Technology in Higher Education, pp. 1-21, 2020.
- A. Gonzalez-Nucamendi, J. Noguez, L. Neri, V. Robledo-Rella, R. M. G. Garcia-Castelan et D. Escobar-Castillejos, «The prediction of academic performance using engineering student's profiles,» Computers and Electrical Engineering, vol. 93, 2021.
- H. Zeineddine, U. Braendle et A. Farah, «Enhancing prediction of student success: Automated machine learning approach,» Computers and Electrical Engineering, vol. 89, 2021.
- N. O. Abdulwahid, S. Fakhfakh et I. Amous, «Simulating and Predicting Students’ Academic Performance Using a New Approach based on STEAM Education,» Journal of Universal Computer Science, vol. 28, n° %112, pp. 1252-1281, 2022.
- A. Namoun et A. Alshanqiti, «Predicting Student Performance Using Data Mining and Learning Analytics Techniques: A Systematic Literature Review,» Applied Sciences, vol. 11, n° %1237, 2021.
- L. Mansangu, A. Jadhav et R. Ajoodha, «Predicting Student Academic Performance Using Data Mining Techniques,» Advances in Science, Technology and Engineering Systems Journal, vol. 6, n° %11, pp. 153-163, 2021.
- N. Priyasadie et S. Mohammad Isa, «Educational Data Mining in Predicting Student Final Grades on Standardised Indonisia Data Pokok Pendidikan Data Set,» International Journal of Advanced Computer Science and Applications, vol. 12, n° %112, 2021.
- S. Fida, N. Masood, N. Tariq et F. Qayyum, «A Novel Hybrid Ensemble Clustering Technique for Student Performance Prediction,» Journal of Universal Computer Science,, vol. 28, n° %18, pp. 777-798, 2022.
- A. Roy, M. R. Rahman, M. Nazrul Islam, M. Nafiz Imtiaz Saimon, M. A. Alfaz et A.-A.-S. Jaber, «A Deep Learning Approach to Predict Academic Result and Recommend Study Plan for Improving Student's Academic Performance,» chez International Conference on Ubiquitous Computing and Intelligent Information Systems (ICUIS 2021), Erode, India, 2021.
- R. R. Bouckaert, E. Frank, M. Hall, R. Kirkby, P. Reutemann, A. Seewald et D. Scuse, WEKA Manual for Version 3-7-8, Hamilton: University of Waikato, 2013.
- G. Matafeni et R. Ajoodha, «Using Big Data Analytics to Predict Learner Attrition based on First Year Marks at a South African University,» Advances in Science, Technology and Engineering Systems Journal, vol. 5, pp. 920-926, 2020.
- Sana, I. F. Siddiqui et Q. A. Arain, «Analyzing students' academic performance through educational data mining,» 3C Tecnologia. Glosas de innovacion aplicadas a la pyme, pp. 402-421, 2019.
- A. Fazal, I. Fakhund, A. Rahmani, R. Azhar et A. Masood Khattak, «A Predictive Model for Predicting Students Academic Performance,» chez 10th International Conference on Information, Intelligence, Systems and Applications (IISA), 2019.
- A. Siddique, A. Jan, F. Majeed, A. I. Qahmash, N. N. Quadri et M. O. Abdul Wahab, «Predicting Academic Performance Using an Efficient Model Based on Fusion of Classifiers,» Applied Sciences, vol. 11, pp. 1-19, 2021.
- W. S. Bhaya, «Review of Data Preprocessing Techniques in Data Mining,» Journal of Engineering and Applied Sciences, vol. 12, n° %116, pp. 4102-4107, 2017.
- A.-S. Hoffait et M. Schyns, «Early detection of university students with potential difficulties,» Decision Support Systems, vol. 101, pp. 1-11, 2017.
- A. M. Shahiri, W. Husain et N. Abdul Rashid, «A Review on Predicting Student's Performance Using Data Mining Techniques,» Procedia Computer Science, vol. 72, pp. 414-422, 2015.
- V. L. Miguéis, A. Freitas, P. J. Garcia et A. Silva, «Early segmentation of students according to their academic performance: A predictive modelling approach,» Decision Support Systems, vol. 115, pp. 36-51, 2018.
- M. A. Jassim, «Analysis of the Performance of the Main Algorithms for Educational Data Mining: A Review,» chez IOP Conference Series: Materials Science and Engineering, 2021.
- M. b. Hossin et M. N. Sulaiman, «A review on Evaluation Metrics for Data Classification Evaluations,» International Journal of Data Mining & Knowledge Management Process, vol. 5, n° %12, 2015.
- T. Fawcett, «An introduction to ROC analysis,» Pattern Recognition Letters, vol. 27, n° %18, pp. 861-874, 2006.
- A. S. Hashim, W. A. Awadh et A. K. Hamoud, «Student Performance Prediction Model based on Supervised Machine Learning Algorithms,» chez IOP Conference Series: Materials Science and Engineering, 2020.
- M. N. Yakubu et A. M. Abubakar, «Applying machine learning approach to predict students’ performance in higher educational institutions,» Kybernetes, vol. 51, n° %12, pp. 916-934, 2022.
- S. Iglesias-Pradas, Á. Hernández-García, J. C.-P. Chaparro-Peláez et J. L. Prieto, «Emergency remote teaching and students’ academic performance in higher education during the COVID-19 pandemic: A case study,» Computers in Human Behavior, vol. 119, 2021.
- G. K. Saw, C.-N. Chang, U. Lomelí et M. Zhi, «Fall Enrollment and Delayed Graduation Among STEM Students during the COVID-19 Pandemic,» Network for Research and Evaluation in Education (NREED) Data brief, pp. 1-5, 2020.
- M. García-Alberti, F. Suárez, I. Chiyón et J. C. Mosquera Feijoo, «Challenges and Experiences of Online Evaluation in Courses of Civil Engineering during the Lockdown Learning Due to the Covid-19 Pandemic,» Education Science, vol. 11, n° %159, 2021.
