Study of Parametric Performance Evaluation of Machine Learning and Statistical Classifiers

Author: Yugal kumar, G. Sahoo
Journal: International Journal of Information Technology and Computer Science(IJITCS) @ijitcs
Article in issue: 6 Vol. 5, 2013.
Free access
Most of the researchers/ scientists are facing data explosion problem presently. Large amount of data is available in the world i.e. data from science, industry, business, survey and many other areas. The main task is how to prune the data and extract valuable information from these data which can be used for decision making. The answer of this question is data mining. Data Mining is popular topic among researchers. There is lot of work that cannot be explored in the field of data mining till now. A large number of data mining tools/software’s are available which are used for mining the valuable information from the datasets and draw new conclusion based on the mined information. These tools used different type of classifiers to classify the data. Many researchers have used different type of tools with different classifiers to obtained desired results. In this paper three classifiers i.e. Bayes, Neural Network and Tree are used with two datasets to obtain desired results. The performance of these classifiers is analyzed with the help of Mean Absolute Error, Root Mean-Squared Error, Time Taken, Correctly Classified Instance, Incorrectly Classified instance and Kappa Statistic parameter.
Bayes Net, J48, Mean Absolute Error, Naive Bayes, Root Mean-Squared Error
Short address: https://sciup.org/15011914
IDR: 15011914
Text of the scientific article Study of Parametric Performance Evaluation of Machine Learning and Statistical Classifiers
Published Online May 2013 in MECS
In recent years, there is the incremental growth in the electronic data management methods. Each companies whether it is large, medium or small having its own database system that are used for collecting and managing the information. This information is used in the decision making process. Database of any firm consist the thousands of the instance and hundreds of attributes. Hence it is quite difficult to process these data and retrieving meaning full information from the dataset in short span of time. The same problem is faced by researchers and scientists how to process the large data set for further research. To overcome this
-
II. Classification
-
2.1 Bayes Net
-
2.2 Naive Bayes
Classification of data is typical task in data mining domain. There are large number of classifiers that are used to classify the data such as bayes, function, rule based and Tree etc. The goal of classification is to correctly predict the value of a designated discrete class variable, given a vector of predictors or attributes [5].
Bayes Net is based on the bayes theorem. In Bayes net, conditional probability on each node is calculated and formed a Bayesian Network. Bayesian Network is a directed acyclic graph. Hence inn Bayes net, it is assume that all attributes are nominal and there are no missing values if any such value is replaced globally. Different types of algorithms are used to estimate conditional probability such as Hill Climbing, Tabu Search, Simulated Annealing, Genetic Algorithm and
K2. The output of the Bayes net can be visualized in terms of graph. Fig.1 shows the visualized graph of the Bayes net for a bank data set [6]. Visualize graph is formed by using the children attribute of the bank data set. In this graph, each node represents the probability distribution table within it.
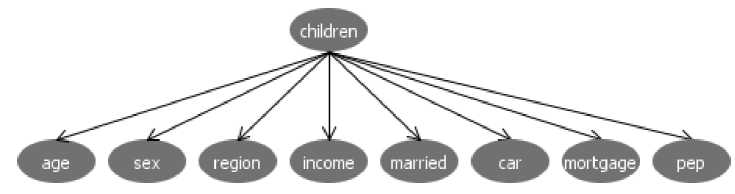
Fig. 1: Visualize Graph of the Bayes Net for a bank data set
Naive Bayes [7] is widely used for the classification due to its simplicity, elegance, and robustness. Navie Bayes can be characterized as Naive and Bayes. Naive stands for independence i.e. true to multiply probabilities when the events are independent and Bayes is used for the bayes rule. This technique assumes that attributes of a class are independent in real life. The performance of the Naive Bayes is better when the data set has actual values. Kernel density estimators can be used to measure the probability in Naive Bayes that improve the performance of the model. A large number of modifications have been introduced, by the statistical, data mining, machine learning and pattern recognition communities an attempt to make it more flexible but such modifications are necessarily complications, which detract from its basic simplicity.
-
2.3 Naive Bayes Updatable
-
2.4 Multi Layer Perceptron
-
2.5 Voted Perceptron
This is the updateable version of Naive Bayes. This classifier will use a default precision of 0.1 for numeric attributes when build Classifier is called with zero training instances and also known as incremental update.
Multi Layer Perceptron can be defined as Neural Network and Artificial intelligence without qualification. A Multi Layer perceptron (MLP) is a feed forward neural network with one or more layers between input and output layer. Figure2 shows the functionality of multilayer neural network and illustrates a perceptron network with three layers:
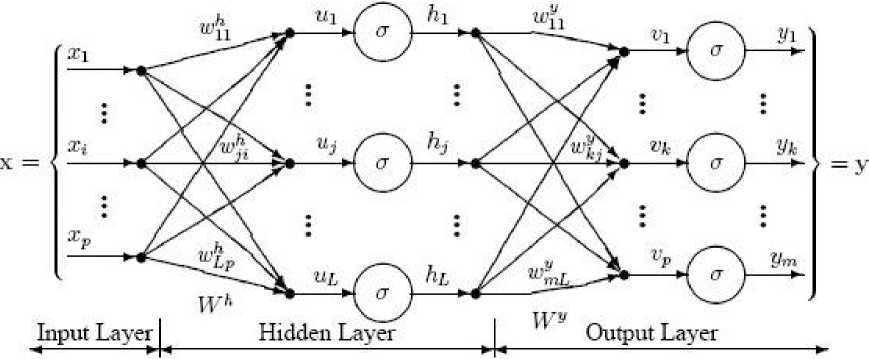
Fig. 2: Multilayer neural network
Each neuron in each layer is connected to every neuron in the adjacent layers. The training or testing vectors are presented to the input layer, and processed by the hidden and output layers. A Detailed analysis of multi-layer perceptron has been presented by Zak [9] and Hassoun [10].
Voted Perceptron (VP) is proposed by Collins and can be viewed as a simplified version of CRF [11]. It suggests that the voted perceptron is preferable in cases of noisy or unseparable data [12]. Voted perceptron approaches to small sample analysis and taking advantage of the boundary data of largest margin. Voted perceptron method is based on the perceptron algorithm of Rosenblatt and Frank [13].
-
2.6 J48
J48 are the improved versions of C4.5 algorithms or can be called as optimized implementation of the C4.5.
The output of J48 is the Decision tree. A Decision tree is similar to the tree structure having root node, intermediate nodes and leaf node. Each node in the tree consist a decision and that decision leads to our result. Decision tree divide the input space of a data set into mutually exclusive areas, each area having a label, a value or an action to describe its data points. Splitting criterion is used to calculate which attribute is the best to split that portion tree of the training data that reaches a particular node. Fig. 3 shows the decision tree using J48 for a bank data set whether a bank provide loan to a person or not. Decision tree is formed by using the children attribute of the bank data set.
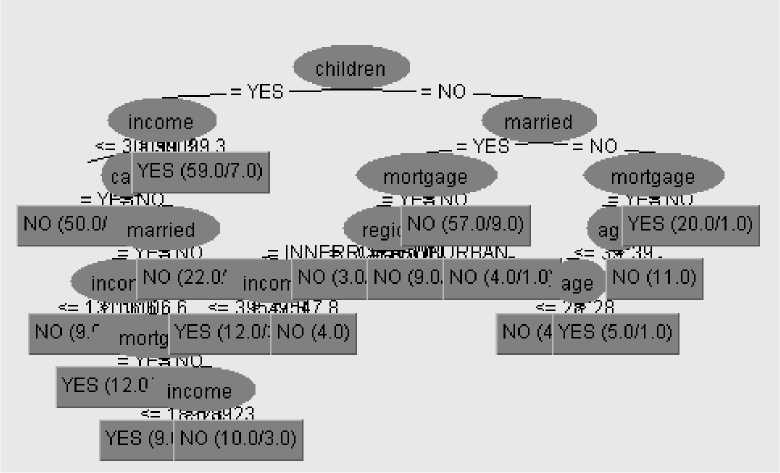
Fig. 3: Decision Tree using J48 for Bank Data Set
-
III. Tool
The WEKA toolkit is used to analyze the dataset [6] with the data mining algorithms. WEKA is an assembly of tools of data classification, regression, clustering, association rules and visualization. The toolkit is developed in Java and is open source software issued under the GNU General public License [8]. The WEKA tool incorporates the four applications within it.
-
• Weka Explorer
-
• Weka Experiment
-
• Weka Knowledge Flow
-
• Simple CLI
For the Classification of Data set, weka explorer is used to generate the result or statistics. Weka Explorer incorporates the following features within it:-
-
• Preprocess: It is used to process the input data. For this purpose the filters are used that can transform the data from one form to another form. Basically two types of filters are used i.e. supervised and unsupervised. Figure 4 described the preprocessed data snapshot.
-
• Classify. Classify tab are used for the classification purpose. A large number of classifiers are used in weka such as bayes, function, rule, tree, meta and so on. Four type of test option are mentioned within it.
-
• Cluster: It is used for the clustering of the data.
-
• Associate: Establish the association rules for the data.
-
• Select attributes: It is used to select the most relevant attributes in the data.
-
• Visualize: View an interactive 2D plot of the data.
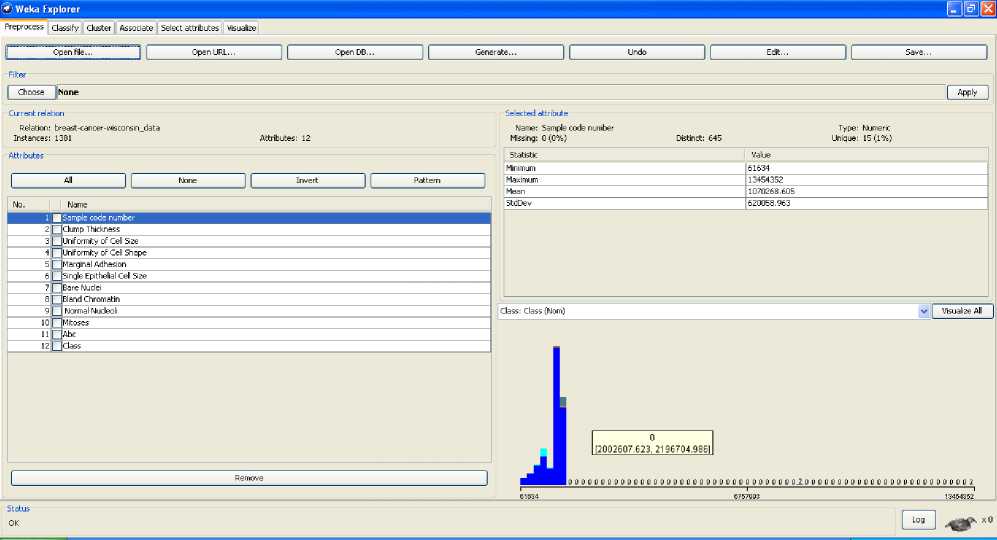
Fig. 4: Pre process of data using weka
Data set used in Weka is in Attribute-Relation File Format (ARFF) file format that consist of special tags to indicate different things in the dataset such as attribute names, attribute types, attribute values and the data. This paper includes the two data sets such as sick.arff and breast-cancer-wisconsin. Sick.arff data set has been taken from the weka tool website while the brest cancer data set has been taken from the UCI repository i.e. real time multivariate data set [7, 14]. Brest cancer data set is in the form of text file. Firstly it converts into the .xls format; .xls format to .csv format and then .csv format convert into the .arff format. The .arff format of both data sets given as:-
Sick.arff Data Set:
@attribute sex {M,F}
@attribute on_thyroxine {f,t} @attribute query_on_thyroxine {f,t}
@attribute on_antithyroid_medication {f,t}
@attribute sick {f,t}
@attribute pregnant {f,t}
@attribute thyroid_surgery {f,t}
@attribute I131_treatment {f,t}
@attribute query_hypothyroid {f,t}
@attribute query_hyperthyroid {f,t}
@attribute lithium {f,t}
@attribute goitre {f,t} @attribute tumor {f,t} @attribute hypopituitary {f,t}
@attribute psych {f,t}
@attribute TSHmeasured {f,t} @attribute TSH real
@attribute T3measured {f,t}
@attribute T3 real
@attribute TT4measured {f,t}
@attribute TT4 real
@attribute T4Umeasured {f,t}
@attribute T4U real
@attribute FTImeasured {f,t}
@attribute FTI real
@attribute TBGmeasured {f,t}
@attribute TBG real
@attribute referral_source
{WEST,STMW,SVHC,SVI,SVHD,other}
@attribute class {sick, negative}
@data
Breast-cancer-wisconsin_data,arff Data Set:
@relation breast-cancer
@attribute age {'10-19','20-29','30-39','40-49','50
59','60-69','70-79','80-89','90-99'}
@attribute menopause {'lt40','ge40','premeno'}
@attribute tumor-size {'0-4','5-9','10-14','15-19','20-
24','25-29','30-34','35-39','40-44','45-49','50-54','55-59'}
@attribute inv-nodes {'0-2','3-5','6-8','9-11','12-14','15-17','18-20','21-23','24-26','27-29','30-32','33-35','36-39'}
@attribute node-caps {'yes','no'}
@attribute deg-malig {'1','2','3'}
@attribute breast {'left','right'}
@attribute breast-quad
{'left_up','left_low','right_up','right_low','central'}
@attribute 'irradiat' {'yes','no'}
@attribute 'Class' {'no-recurrence-events','recurrence-events'}
@data
In this paper, the following parameters are used to evaluate the performance of above mentioned classification techniques:
-
• Mean Absolute Error (MAE): It can define as statistical measure of how far an estimate from actual values i.e. the average of the absolute magnitude of the individual errors. It is usually similar in magnitude but slightly smaller than the root mean squared error.
-
• Root Mean-Squared Error (RMSE): The root mean square error (RMSE)) calculates the differences between values predicted by a model / an estimator and the values actually observed from the thing being modeled/ estimated. RMSE is used to measure the accuracy. It is ideal if it is small.
-
• Time: The amount of time required to build the model.
-
• Correctly Classified Instances: Total Number of instance correctly classified by the model .
-
• Incorrectly Classified Instances: Total Number of instance incorrectly classified by the model.
-
• Kappa Statistic: Kappa statistic defined as measure agreement of predication with true class. It can be defined as
K = (P (A) - P (E))/ (1 - P (E))
Table 1: Tabular comparison of the different classifiers
|
Algorithm (Total Instance: 2800/286) |
Correctly Classified Instances % (value) |
Incorrectly Classified Instances % (Value) |
Time Taken (seconds) |
Kappa Statistic |
Mean Absolute Error |
Root Mean Squared Error |
|
BayesNet |
97.1429% |
2.8571 % |
0.2 |
0.7662 |
0.0476 |
0.1651 |
|
72.028 % |
27.972 % |
0.02 |
0.2919 |
0.3297 |
0.4566 |
|
|
NaiveBayes |
97.2857% |
2.7143 % |
0.13 |
0.7756 |
0.0456 |
0.1594 |
|
71.6783% |
28.3217 % |
0.02 |
0.2857 |
0.3272 |
0.4534 |
|
|
Naïve Bayes Updateable |
92.5714% |
7.4286 % |
0.03 |
0.5182 |
0.0886 |
0.2296 |
|
71.6783% |
28.3217 % |
0 |
0.2857 |
0.3272 |
0.4534 |
|
|
Multilayer Perceptron |
97.8214% |
2.1786 % |
110.94 |
0.7937 |
0.0265 |
0.1355 |
|
64.6853% |
35.3147 % |
8.91 |
0.1575 |
0.3552 |
0.5423 |
|
|
Voted Perceptron |
93.6429% |
6.3571 % |
0.77 |
0.0335 |
0.0636 |
0.2521 |
|
71.3287% |
28.6713 % |
0.03 |
0.212 |
0.2848 |
0.5322 |
|
|
J48 |
99.6786% |
0.3214 % |
0.3 |
0.972 |
0.0066 |
0.0533 |
|
75.5245% |
24.4755 % |
0.02 |
0.2826 |
0.3676 |
0.4324 |
Table 1 shows the comparison of the BayesNet, NavieBayes NavieBayes Uptable, Multilayer perceptron, Voted perceptron and J48 in tabular form. For the analysis of discussed classifiers the two data sets has been used in which breast cancer data set has 286 instance and 10 attributes while the sick data set has 2800 instance and 30 attributes. The aim to take two dataset is to analyze the performance of discussed classifiers with large as well as small data set.
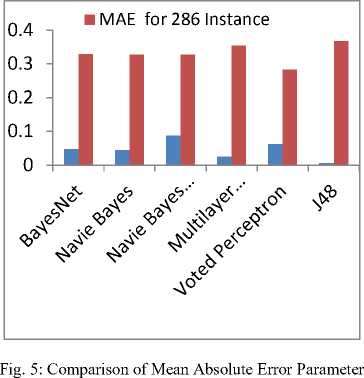
Fig.5 shows the comparison of mean absolute error parameter for large dataset i.e. 2800 having 30 attributes as well as small dataset i.e. 286 instance having 10 attributes. The analysis of MAE parameter according to Fig. 5 shows that J48 provide better result in case of small dataset (286 instance having 10 attributes) i.e. 0.006 while the navie bayes updateable provide poor result i.e. 0.088. But, when data set is large i.e. 2800 instance having 30 attributes, J48 has poor performance i.e. 0.367 while Voted perceptron provide better performance i.e. 0.284 and bayes classifiers have similar performance. This parameter states that minimum of MAE tends to better performance of the classifiers because this parameter measure the difference between the predicted value and actual value.
Correctly Classfied Instance 2800
Correctly Classfied Instance 286
■ RMSE 6>r2800 Instance
06 I ■ RMSE for 286 Instance
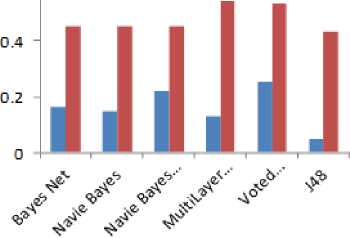
Fig. 6: Comparison of Root Mean Squared Error Parameter
nun


Fig. 8: Comparison of Correctly Classified Parameter
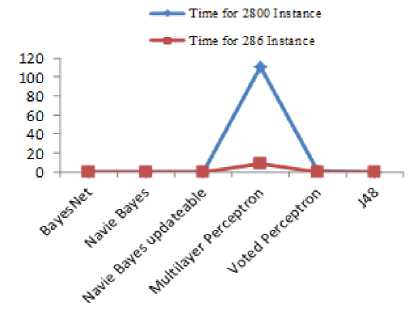
Fig. 7: Comparison of Time Taken Parameter
■ Incorrectlly Classified Instance for 2800 instance
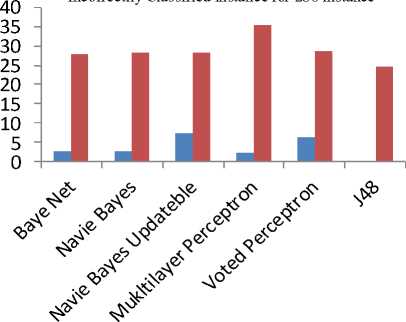
Fig. 9: Comparison of Incorrectly Classified parameter
Performance of Bayes Net and Navie Bayes is similar for both of data sets. While multilayer perceptron provide poor performance when dataset is small i.e. 35.31 and Navie Bayes Updateble provide poor performance when data set is large i.e. 7.42. The performance of other classifier except voted perceptron is same in case of small dataset.
■ Kappa Statistic for 286 instance
■ Kappa Statistic for 2800 instance
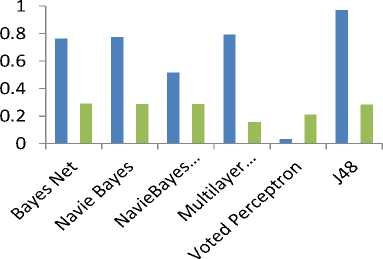
Fig. 10: comparison of kappa statistic parameter
-
V. Conclusion
In this paper, six different classifiers has used for the classification of data. These techniques are applied on two dataset in which one of data set has one tenth of instance and one third attribute as compare to another data set. The fundamental concept to take two datasets is to analyze the performance of the discussed classifiers for small as well as large dataset. To analyze the performance of discussed classifiers, six different parameters are used i.e. Mean Absolute Error (MAE), Root Mean Square Error (RMSE), Time Taken, Correctly Classified, Incorrectly Classified instance and Kappa Statistic. After analyze the result of discussed classifiers on the behalf of parameter it concludes that J48 classifier provides better performance (RMSE,
References Study of Parametric Performance Evaluation of Machine Learning and Statistical Classifiers
- Desouza, K.C. (2001) ,Artificial intelligence for healthcare management In Proceedings of the First International Conference on Management of Healthcare and Medical Technology Enschede, Netherlands Institute for Healthcare Technology Management
- J. Han and M. Kamber, (2000) “Data Mining: Concepts and Techniques,” Morgan Kaufmann.
- Ritu Chauhan, Harleen Kaur, M.Afshar Alam, (2010) “Data Clustering Method for Discovering Clusters in Spatial Cancer Databases”, International Journal of Computer Applications (0975 – 8887) Volume 10– No.6.
- Rakesh Agrawal,Tomasz Imielinski and Arun Swami, (1993)” Data mining : A Performance perspective“. IEEE Transactions on Knowledge and Data Engineering, 5(6):914-925.
- Daniel Grossman and Pedro Domingos (2004). Learning Bayesian Network Classifiers by Maximizing Conditional Likelihood. In Press of Proceedings of the 21st International Conference on Machine Learning, Banff, Canada.
- www.ics.uci.edu/~mle
- Ridgeway G, Madigan D, Richardson T (1998) Interpretable boosted naive Bayes classification. In: Agrawal R, StolorzP, Piatetsky-Shapiro G (eds) Proceedings of the fourth international conference on knowledge discovery and data mining.. AAAI Press, Menlo Park pp 101–104.
- Weka: Data Mining Software in Java http://www.cs.waikato.ac.nz/ml/weka/
- Zak S.H., (2003), “Systems and Control”, NY: Oxford Uniniversity Press.
- Hassoun M.H, (1999), “Fundamentals of Artificial Neural Networks”, Cambridge, MA: MIT press.
- Yoav Freund, Robert E. Schapire, (1999) "Large Margin Classification Using the Perceptron Algorithm." In: Machine Learning, 37(3).
- Yunhua Hu, Hang Li, Yunbo Cao, Li Teng, Dmitriy Meyerzon, Qinghua Zheng, (2006), “ Automatic extraction of titles from general documents using machine learning”, in Information Processing and Management( publish by Elsevier) 42, 1276–1293.
- Michael Collins and Nigel Duffy, (2002), “New Ranking Algorithms for Parsing and Tagging: Kernels over Discrete Structures, and the Voted Perceptron” in Proceedings of the 40th Annual Meeting of the Association for Computational Linguistics (ACL), Philadelphia, pp. 263-270.
- Ian H.Witten and Elbe Frank, (2005) "Data mining Practical Machine Learning Tools and Techniques," Second Edition, Morgan Kaufmann, San Fransisco
