Study of quality indicators and genetic affinity of hard wheat (Triticum durum Desf.) wheat samples by gliadin electrophoretic spectra
 wheat samples by gliadin electrophoretic spectra")
Author: Sadigova S., Sadigov H., Mammadova G., Poladova G., Eyyubova N.
Journal: Бюллетень науки и практики @bulletennauki
Section: Сельскохозяйственные науки
Article in issue: 9 т.10, 2024.
Free access
According to statistical indicators, wheat takes major part of food ration of people. It is raw material for preparing food products such as macarons, tandir bread etc. Under different environmental conditions it is important to develop wheat biotypes with high genetic diversity and variety is a biological factor that has strong influence on obtaining a high-quality product. The research aim is to define technological and biochemical indicators of hard wheat ( Triticum durum Desf.) genotypes and prolamin markers, to identify and passport reserve proteins of gliadin and gluten. It is appropriate to ensure the selection of existing genotypes by determining gliadin-encoding loci, which are considered markers of certain economically important traits. Overall were used 41 samples. Most of the samples had high vitreousness ranging between 84% and 100% which was determined in OLIS D3-3 diaphanascope. The amount of wet gluten was determined in KDI-1 apparatus. Grain moisture content was determined using a GAC 2100 Grain Analysis Computer. 9 samples were selected due to high-quality indicators. Polymorphism of gliadin resource proteins was electrophoretically analyzed on a polyacrylamide gel (Acid-PAGE) and based on the diversity of 4 zones (ω, γ, β, α) distinguished as a result of the analysis of the obtained electropherograms, 0-1 operation was performed, and the genetic diversity index was calculated. Based on results, it is more applicable to consider the allelic blocks of the gliadin-encoding loci related to quality, adaptability and productivity traits.
Durum wheat, loci, gliadin, glutenin, vitreousness, genetic diversity, electrophoregrams
Short address: https://sciup.org/14130825
IDR: 14130825 | UDC: 633.1: | DOI: 10.33619/2414-2948/106/14
Изучение показателей качества и генетического родства образцов твердой пшеницы (Triticum durum Desf.) по электрофоретическим спектрам глиадина
Согласно статистическим показателям, пшеница занимает большую часть пищевого рациона людей. Она является сырьем для приготовления таких продуктов питания, как макароны, знаменитый в нашем регионе тандырный хлеб и т. д. В различных экологических условиях важно выводить биотипы пшеницы с высоким генетическим разнообразием, а разнообразие является биологическим фактором, который оказывает сильное влияние на получение высококачественного продукта. Основной целью работы было, определение технологических данных, выявление относительной пластичности и высокого качества образцов твердой пшеницы ( Triticum durum Desf.), выявление и паспортизация запасных белков глиадина и глютенина, для использования в дальнейшей селекции. Целесообразно обеспечить отбор существующих генотипов путем глиадин кодирующих локусов, которые считаются маркерами определенных хозяйственно важных признаков. В исследовании было использовано 41 образцов твердой пшеницы. Большинство образцов имели высокую стекловидность в диапазоне от 84% до 100%, которую определяли на диафаноскопе OLIS D3-3. Количество сырой клейковины определяли на аппарате KDI-1. Влажность зерна определяли с помощью компьютера для анализа зерна GAC 2100. По показателям качества отобрано 9 образцов. Электрофоретический анализ полиморфизм белков глиадина проводили на полиакриламидном геле (Acid-PAGE). На основании полученных электрофореграмм, результаты анализа 4 зон (ω, γ, β, α) был рассчитан индекс генетического разнообразия. На основании полученных результатов более применимо рассмотрение аллельных блоков глиадин кодирующих локусов, связанных с признаками качества, адаптивности и продуктивности для применения в селекции.
Text of the scientific article Study of quality indicators and genetic affinity of hard wheat (Triticum durum Desf.) wheat samples by gliadin electrophoretic spectra
Бюллетень науки и практики / Bulletin of Science and Practice
Wheat is one of the most important plants on Earth, being an important source of energy for living things. The primary domesticated wheat plant is the basis of the population's diet in economically underdeveloped countries. Wheat cultivation in our country has a history of more than 6-8 thousand years. Our republic is considered the homeland of durum wheat. In 1964, Mustafayev I.D. scientifically proved this in his book "Azerbaijan is the homeland of many types of wheat" [3].
Since durum wheat has a vitreous endosperm and a high content of carotenoid pigment, it is traditionally used as the main raw material for the preparation of the highest quality pasta products and for baking the best national Azerbaijani tandir bread. The most accessible and low-cost (effective) tool for increasing grain and productivity is variety. Variety is a biological factor capable of developing the genetic potential of a plant under different environmental conditions. The characteristics of the variety have a strong influence on obtaining a high-quality product [4].
In plant research, assessment of genetic diversity is mostly based on single-nucleotide polymorphism (SNP) analysis, with an enormous number of publications completed to date. There are many methods available for plant genotyping based on SNP analysis, including next-generation sequencing. These include more traditional and manual techniques that are slow and have low throughput to more expensive methods [9].
To achieve the efficiency of the work carried out in the direction of increasing the quality of the wheat grain, electrophoretic analyses are performed during the selection of the initial material. It is appropriate to ensure the selection of existing genotypes by determining gliadin-encoding loci, which are considered markers of certain economically important traits [10].
Considering this, the work was expanded in the direction of studying biodiversity and genetic markers.
Materials and Methods
The research included the analysis of 39 samples of durum wheat (Tr. durum Desf.) from the Institute's Genbank, cultivated in the Absheron Scientific Research Base, in 2022.
The following methods were used: the amount of wet gluten obtained after kneading the dough by hand was determined in the KDI-1 apparatus. Grain moisture content was determined using a GAC 2100 Grain Analysis Computer, and vitreousness was determined using an OLIS D3-3 diaphanascope.
Polymorphism of gliadin resource proteins was electrophoretically analyzed on a polyacrylamide gel (Acid-PAGE) according to the method of W. Bushuk and R. R. Zillman (1978), modified by Poperelya et al. (1989) [5, 7].
The research aimed at the determination of the technological and biochemical indicators of durum wheat genotypes and prolamin markers, the identification and passportization of the reserve proteins of gliadin and gluten, as well as the evaluation of the reliability of quality indicators.
Literature review
Changes in climate and environment, lack of increase in productivity pose a threat to the production of grain crops. Increasing productivity and quality as a result of complex selection measures is the perfect way to increase the price of existing agricultural products, improve the economy, and increase the income of farms. According to some researchers, the ripening period of wheat after harvesting can last for 20-45 days, depending on the characteristics of the variety. After harvesting, drying the grain during the ripening period is considered an essential procedure. During this period, the grain dries and its technological properties improve [6, 8].
After harvesting, grain ripening is completed by the process of protein formation during the long storage period. It should be noted that the quality of grain is closely related to environmental factors, along with genes controlling proteins, lipids, starch, lipoprotein enzymes, and other components [8].
As the ripening period shortens, the proportion of structural/metabolic and storage proteins, endosperm and bran, as well as gliadin and glutenins, is strongly altered. The change in wheat productivity is due to the seasonal and zonal nature of the environment. The main factor in the productivity of the plant is the provision of the environment with precipitation during the autumn and spring-summer ripening periods. Temperature is one of the main factors in the formation of quality indicators [8].
The productivity and quality of wheat depend not only on the variety but also on cultivation conditions, harvesting time and storage conditions. The most important factor affecting quality is grain moisture, which depends on harvesting time and weather conditions [4].
Gliadins, which are polymorphic storage proteins of grain, are considered to be the most favorable genetic markers for the identification of durum wheat cultivars and the evaluation of cultivar purity. The genetic heterogeneity of durum wheat populations and varieties is the main component of the biodiversity of this species and it is possible to preserve it only by using genetic marker systems and conducting regular monitoring [9].
Two main issues arise when the purity of the variety is checked and identified. First, it is necessary to determine the variety based on the electrophoretic spectrum of gliadin, and secondly, if there is a mixture, to detect it (identification of the mixture is also important), it is necessary to select the mixture from the biotype of the variety [9, 10].
There should be a database of reference cultivars to provide feedback on cultivar purity or to perform cultivar identification. Such information bases should contain the results of the analyses conducted on the grains of the original varieties (obtained from the author), the genetic formulas of the variety (the structure of the biotype of the initial variety), and the allelic variants of the gliadin block components of each biotype. Thus, the study of the genetic control of gliadins, the reserve proteins of the grain is one of the most effective tools in studying the genetic characteristics of durum wheat, which allows accelerating the selection process, while creating a genetically based registration system for the variety [4].
Results
The study objects were durum wheat genotypes. The quality indicators of durum wheat samples were found to be relatively high. Thus, most of the samples had high vitreousness ranging between 84% and 100%. The values of the 1000-grain mass were also satisfactory. In 18 samples, this indicator was above 50 g, while in 3 samples it was higher than 60 g (in v. Murciense, 64.8 g, in v. Aegepteacum, 69.6 g, and in v. Erythromelan, 63.2 g). The total results are given in Table 1.
Table 1
THE QUALITY INDICATORS OF DURUM WHEAT SAMPLES
|
Catalog No |
Samples |
Genealogy |
Physical properties |
Quantity and quality of gluten |
si ^ |
||||
|
Со Со Si Со g 2 |
к р йс <Х) СО |
о sf •2 со si й |
\о о\ si |
к г§ « Й S 2 |
S^ |
||||
|
BBFS- 016k-11 |
v. hordeiforme |
tur.dresh x milturum |
98 |
54.8 |
11 |
34.8 |
85 |
12.2 |
15.8 |
|
BBFS- 016k-49 |
v.niloticum |
qraecum x nilutcum |
83 |
54.4 |
8 |
38.9 |
95 |
12.4 |
16.2 |
|
BBFS- 018k-8 |
v.murciense |
98 |
48.8 |
8 |
40.8 |
90 |
14.6 |
18.9 |
|
|
BBFS- 018k-14 |
v.obscurum |
85 |
42.8 |
8 |
42.0 |
70 |
14.4 |
18.7 |
|
|
BBFS- 019k-42 |
v.affine |
leucomelan x affine |
99 |
54.0 |
7 |
32.2 |
95 |
11.0 |
14.3 |
|
BBFS- 019k-90 |
v.murciense |
Yellow wheat x Gurgena |
100 |
42.0 |
9 |
40.0 |
95 |
14.0 |
18.2 |
|
BBFS- 014k-12 |
v. hordeiforme |
tr.turg.dres x meredionale |
98 |
56.0 |
10 |
36.2 |
100 |
13.0 |
16.9 |
|
BBFS-014k-183 |
v.albo provinsale |
boeffi x qreacum |
99 |
42.4 |
12 |
39.5 |
100 |
14.0 |
18.2 |
|
St.Barakatli 95 |
94 |
52.0 |
11 |
26.4 |
120 |
9.3 |
12.0 |
||
Based on the results of the conducted research, the amount of gluten in the samples varied between 25.9 and 40.0%, and the gluten deformation coefficient varied between 85 and 110 units. A dendrogram was constructed based on the cluster analysis (Figure 1).
Among the 41 studied samples, 9 samples with high technological and biochemical indicators were selected and studied compared to the indicators of the standard Barakatli 95 variety.
In the study, electrophoresis of gliadin and gluten reserve proteins in grains of 39 samples and 2 durum wheat varieties (Barakatli 95 and Anza varieties were selected as standards) was carried out in polyacrylamide gels and based on the diversity of 4 zones (w, у, P, a) distinguished as a result of the analysis of the obtained electropherograms, 0-1 genetic diversity index was calculated. In durum wheat genotypes, 23 spectra and 82 patterns were observed in the electropherograms of gliadinencoding loci of reserve proteins. Genetic diversity was determined using gliadin electropherograms for four zones. High genetic diversity was observed in the и-zone (H=0.908), relatively high in the P-zone (H=0.835), medium in the a-zone (H=0.832), and low in the у-zone (H=0.798) (Figure 1, 2). The samples were divided into 5 clusters according to the 41 species and species diversity analyzed. Only 1 sample is located in the 1st cluster (No. 14 v.obscurum). 11 samples are grouped in the 2nd cluster. 16 genotypes are grouped in the 3rd largest cluster, of which three samples belong to v. murciense species diversity. Samples 23 and 25 are more closely located but in spaced clusters, while sample 24 is located relatively more distantly. Five samples are located in the 4th cluster and 8 samples are in the 5th cluster (Figure 1).
It is known that there is a negative correlation between the amount of gluten and the deformation coefficient of gluten. A large amount of literature data demonstrates a negative correlation between the mass of 1000 grains and the amount of crude gluten and dry gluten. A positive correlation was detected between crude gluten and dry gluten content (Figure 1). The results of the statistical analyses confirm the general patterns.
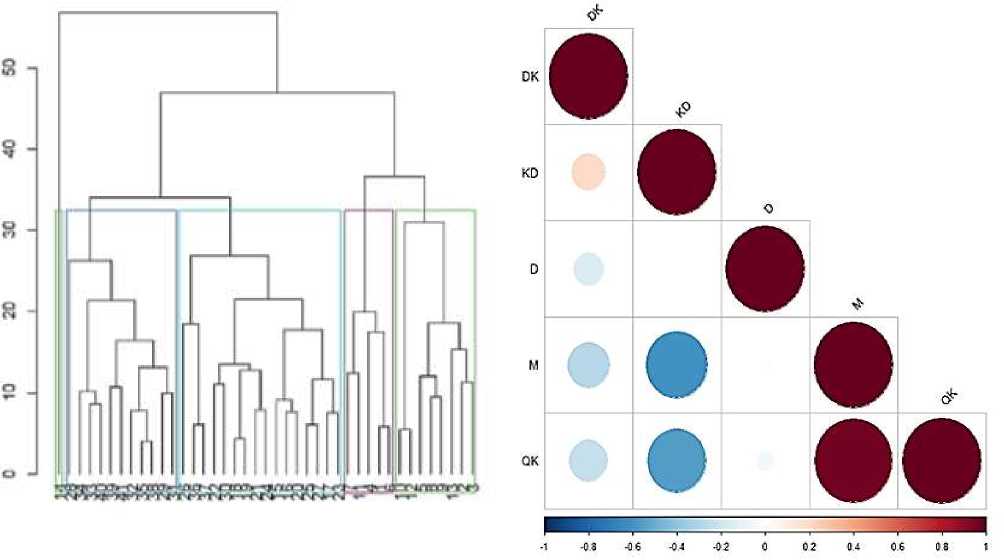
Figure 1. Dendrograms constructed according to quality indicators and linear dependencies between them
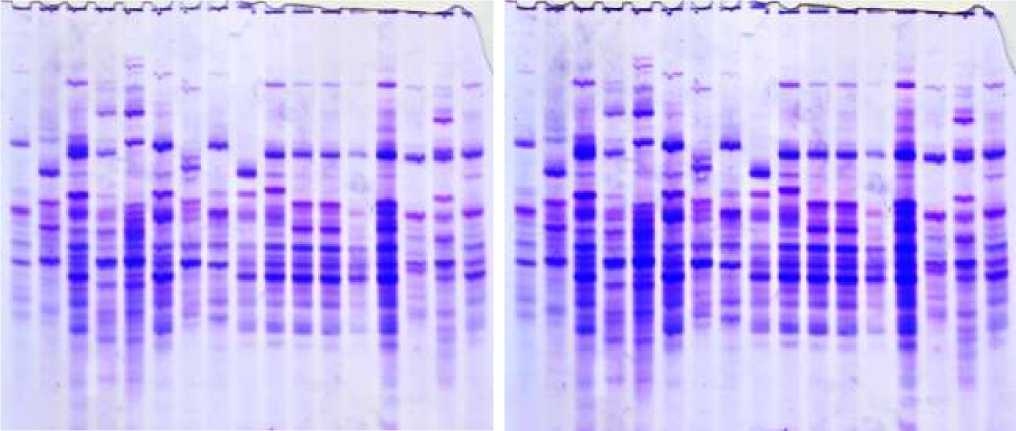
As a result of electrophoretic analysis, prolamin storage proteins are conventionally divided into four zones, which are и-, у-, p- and a- gliadins. In the study, blocks of allelic components on 4 loci of 41 durum wheat samples were studied. Genetic identification of the studied samples was carried out based on the standard catalog for Gli 1A, Gli 1B, Gli 6A, and Gli 6B loci (Figures 2).
Based on the results obtained from the electrophoretic analysis of durum wheat samples, known allelic component blocks of gliadin-encoding loci were identified, and the catalog compiled according to the classification of proteins was further improved.
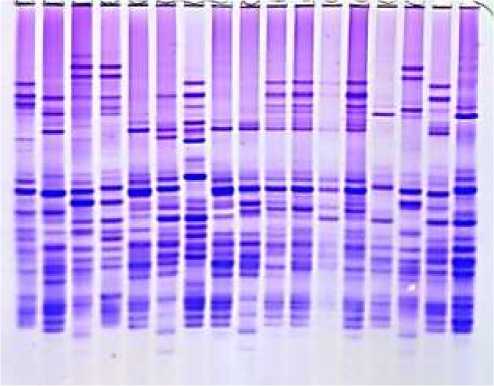
1 2 3 4 5 6 7 8 9 10 11 12 13 14 15 16 17 18 19 20 21 22 23 24 25 26 2728 29 30 31 32 33 34
Figure 2. Electropherograms of gliadin-encoding loci in durum wheat genotypes: 1-v.leucomelan, 2-v.hordeiforme, 3-v.niloticum, 4-v.obscurum, 5-v.alboprovincale, 6-st. Garabagh, 7-Lanqdon, 8-st.Barakatli-95, 9-v. hordeiforme, 10-v.affine, 11-v.murciense, 12-v.melanopus, 13-v.aegepteacum,14- v.murciense,15-v.obscurum,16- v.niloticum,17- v.melanopus, 18-v.muticoapulicum, 19-v.lyubicum, 20-v. alboprovincale, 21- v.aegepteacum, 22-v.melonoleucurum, 23- v.affine, 24-Lanqdon, 25- v.murciense, 26- v.murciense, 27-v.murciense, 28- v.melanopus, 29-v.etythromelan, 30-v.muticohordeiforme, 31-v.leucomelan, 32-v.hordeiforme, 33- v.etythromelan, 34-v.courulescens
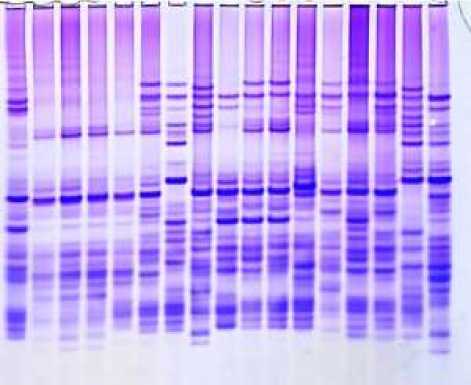
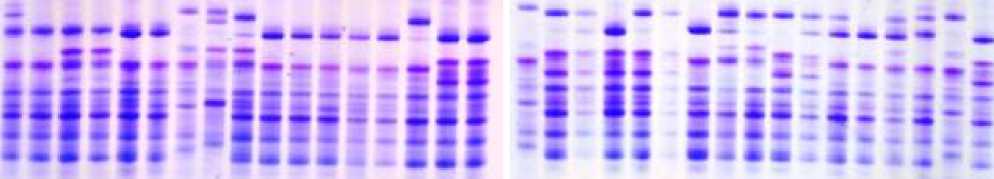
35 36 37 38 39 40 41 42 43 44 45 46 47 48 49 50 51 52 53 54 55 55 57 58 59 60 61 62 6364 65 66 67 68
Figure 3. Electropherograms of gliadin-encoding loci in durum wheat genotypes and F1 hybrid grains. 35-36-v.melanopus, 37-38-v.mutşmelanopus, 39-40-v.leucomelan, 41-Lanqdon, 42-v.alboprovinsale, 43-v.courulescens, 44-45-290/22, 46-47-267/22, 48-49-Auradur, 50-51-262/22, 52-Lanqdon, 53-54-55-Affine x Korifey, 56-57-58-Murciense x Auradur, 59-60-61-Melanopus x Barakatli 95, 62-63-64-Aegepteacum x 267/22, 65-66-67 Leucomelan x melanopus, 68-Lanqdon
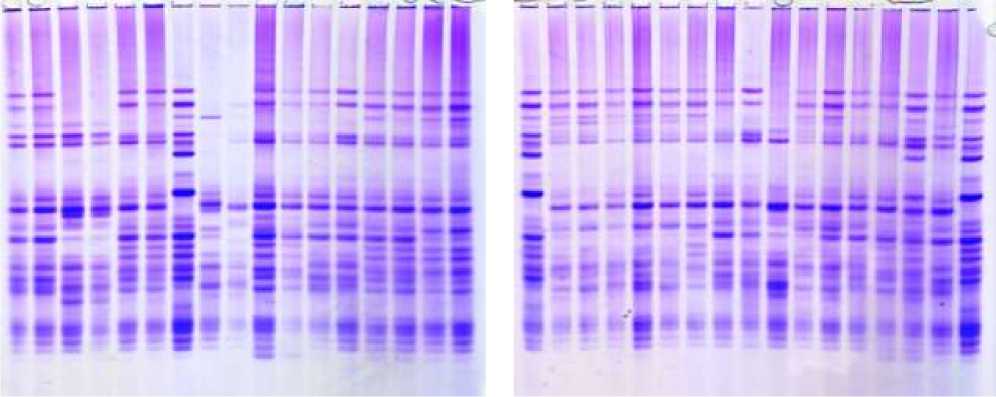
(ос) CD
1 2 3 4 5 6 7 8 9 10 11 12 13 14 15 16 17 18 19 20 21 22 23 24 25 26 2728 29 30 31 32 33 34
Figure 4. Electropherograms of glutenin-encoding loci in durum wheat genotypes. 1-v.leucomelan, 2-v.hordeiforme, 3-v.niloticum, 4-v.obscurum, 5-v.alboprovincale, 6-st. Garabagh, 7-Lanqdon, 8-st.Barakatli 95, 9-v. hordeiforme, 10-v.affine, 11-v.murciense, 12-v.melanopus, 13-v.aegepteacum,14- v.murciense,15-v.obscurum,16- v.niloticum,17- v.melanopus, 18-v.muticoapulicum, 19-v.lyubicum, 20-v. alboprovincale, 21- v.aegepteacum, 22-v.melonoleucurum, 23- v.affine, 24-Lanqdon, 25- v.murciense, 26- v.murciense, 27-v.murciense, 28- v.melanopus, 29-v.etythromelan, 30-v.muticohordeiforme, 31-v.leucomelan, 32-v.hordeiforme, 33- v.etythromelan, 34-v.courulescens
35 36 37 38 39 40 41 42 43 44 45 46 47 48 49 50 51 52 53 54 5 56 57 58 59 60 61 62 6364 65 66 67 68
Figure 5. Electropherograms of glutenin-encoding loci in durum wheat genotypes and F1 hybrid grains. 35-36-v.melanopus, 37-38-v.mutşmelanopus, 39-40-v.leucomelan, 41-Lanqdon, 42-v.alboprovinsale, 43-v.courulescens, 44-45-290/22, 46-47-267/22, 48-49-Auradur, 50-51-262/22, 52-Lanqdon, 53-54-55-Affine x Korifey, 56-57-58-Murciense x Auradur, 59-60-61-Melanopus x Barakatli 95, 62-63-64-Aegepteacum x 267/22, 65-66-67 Leucomelan x melanopus, 68-Lanqdon
Electrophoretic analysis of resource proteins according to gliadin and gluten-encoding loci was performed on F1 grains obtained from hybridization between species diversities and varieties of durum wheat. The specificity of hybrids was determined using electrophoretic analysis.
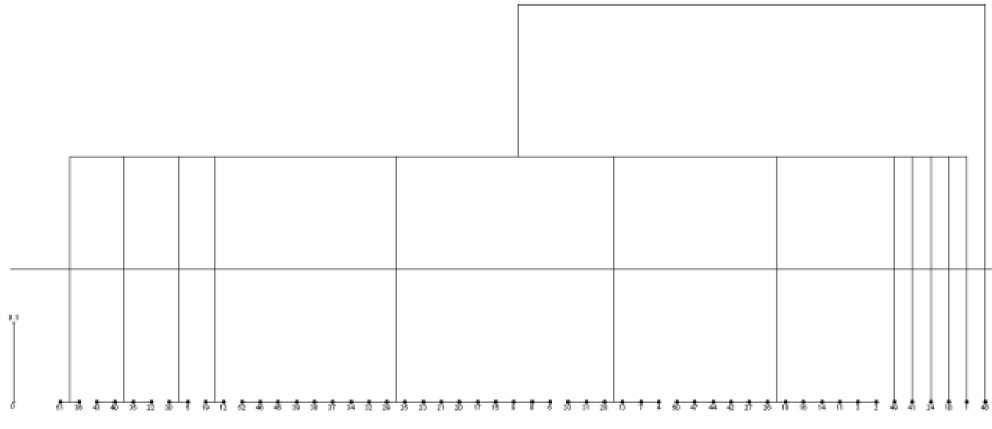
Figure 6. Dendrogram based on gliadin electropherograms
As seen in the figure, thirteen clusters were obtained. In the first cluster, sample number 262/22 and the sample belonging to v. melanopus species diversity were located in the same cluster. According to the electropherograms of gliadin and gluten, certain similarities were found only in the γ zone. v. courulescens and v. leucomelan are in the same cluster, where certain similarities are noticeable in the γ and β zones. Samples of v. alboprovinsale and v. muticohordeiforme also appeared in the same cluster. Regarding the electropherograms of gliadin and gluten, it is possible to observe their similarity only in the α zone. The largest cluster, the fifth cluster, consists of 18 samples, and the seventh cluster contains 12 samples. Six samples were placed individually in clusters 8, 9, 10, 11, 12, and 13 (40, 41, 24, 10, 1, and 48, respectively). In the second cluster, four samples are v.courulescens, v.leucomelan, v.melonoleucurum and v.melanopus (43, 40, 22, and 35, respectively).
Thus, the 41 analyzed samples were divided into five clusters according to their species diversity. Cluster 1 contains only 1 sample (No. 14 v.obscurum). 9 samples were selected due to high-quality indicators. Gliadin reserve proteins were electrophoresed in polyacrylamide gels and based on the diversity of 4 zones (ω, γ, β, α) distinguished as a result of the analysis of the obtained electropherograms, 0-1 operation was performed and the genetic diversity index was calculated.
Based on the results of the analysis of quality indicators, many of the studied samples have high-quality indicators and meet the requirements of the world market. Besides, observations confirm that gliadins are codominantly inherited, regardless of plant cultivation conditions. Thus, gliadins are inherited by blocks controlled by gene clusters located in loci of chromosomes 1А, 1В, 6А and 6В and characterized by multiple allelism. Therefore, it is more relevant to consider the allelic composition of gliadin-coding loci as well as those associated with the traits revealed in the selection process targeted at improving quality, productivity, and adaptability.
Thus, based on the results obtained in the selection works aimed at increasing productivity, adaptability, and quality indicators, it is more appropriate to consider the allelic content of the gliadin-encoding loci related to these traits.
References Study of quality indicators and genetic affinity of hard wheat (Triticum durum Desf.) wheat samples by gliadin electrophoretic spectra
- Barak S., Mudgil D., Khatkar B. S. Biochemical and functional properties of wheat gliadins: a review // Critical reviews in food science and nutrition. 2015. V. 55. №3. P. 357-368. DOI: 10.1080/10408398.2012.654863 EDN: UUFSMJ
- Bushuk W. Wheat breeding for end-product use // Wheat: Prospects for Global Improvement: Proceedings of the 5th International Wheat Conference, 10-14 June, 1996, Ankara, Turkey. Springer Netherlands, 1997. P. 203-211. DOI: 10.1007/978-94-011-4896-2_27
- Мустафаев И. Д. Пшеницы Азербайджана и их значение в селекции и формообразовательном процессе. Л., 1964. 70 с.
- Мустафаев И. Д. Селекция пшеницы в Азербайджане. Баку: Изд-во Акад. наук АзССР, 1956. 108 с.
- Khassanova G., Oshergina I., Ten E., Jatayev S., Zhanbyrshina N., Gabdola A., Shavrukov Y. Zinc finger knuckle genes are associated with tolerance to drought and dehydration in chickpea (Cicer arietinum L.) // Frontiers in Plant Science. 2024. V. 15. P. 1354413. DOI: 10.3389/fpls.2024.1354413 EDN: DUXTDL
- Mughal I. A., Hussain G., Mukhtar I., Irfan S., Haseeb A. H. Oxidative stress modulates endocrine profiling in polycystic ovarian syndrome patients // Asian Journal of Agriculture and Biology. 2024. №2. P. 2023212. DOI: 10.35495/ajab.2023.212 EDN: KDFLGJ
- Novoselskaya-Dragovich A. Y., Bespalova L. A., Shishkina A. A., Melnik V. A., Upelniek V. P., Fisenko A. V., Kudryavtsev A. M. Genetic diversity of common wheat varieties at the gliadin-coding loci // Russian Journal of Genetics. 2015. V. 51. P. 262-271. EDN: UFPWCZ
- Попереля Ф.А. Полиморфизм глиадина и его связь с качеством зерна, продуктивностью и адаптивными свойствами сортов мягкой озимой пшеницы. М., "Агропромиздат". 1989, с. 138-149.
- Poladova G. H., Gasanova kyzy G. M., Mammedova S. M., Ibrahimova S. G. Molecular and genetic basis for improving the quality of soft wheat grain // Scientific Horizons. 2024. V. 3. №27. P. 53-63. EDN: WWSWDE
- Razumova O. V., Divashuk M. G., Alexandrov O. S., Karlov G. I. GISH painting of the Y chromosomes suggests advanced phases of sex chromosome evolution in three dioecious Cannabaceae species (Humulus lupulus, H. japonicus, and Cannabis sativa) // Protoplasma. 2023. V. 260. №1. P. 249-256. DOI: 10.1007/s00709-022-01774-x EDN: PQFUJY
