Study of Techniques used for Medical Image Segmentation and Computation of Statistical Test for Region Classification of Brain MRI

Author: Anamika Ahirwar
Journal: International Journal of Information Technology and Computer Science(IJITCS) @ijitcs
Article in issue: 5 Vol. 5, 2013.
Free access
This paper explores the possibility of applying techniques for segmenting the regions of medical image. For this we need to investigate the use of different techniques which helps for detection and classification of image regions. We also discuss some segmentation methods classified by researchers. Region classification is an essential process in the visualization of brain tissues of MRI. Brain image is basically classified into three regions; WM, GM and CSF. The forth region can be called as the tumor region, if the image is not normal. In the paper; Segmentation and characterization of Brain MR image regions using SOM and neuro fuzzy techniques, we integrate Self Organizing Map(SOM) and Neuro Fuzzy scheme to automatically extract WM, GM, CSF and tumor region of brain MRI image tested on three normal and three abnormal brain MRI images. Now in this paper this scheme is further tested on axial view images to classify the regions of brain MRI and compare the results from the Keith‘s database. Using some statistical tests like accuracy, precision, sensitivity, specificity, positive predictive value, negative predictive value, false positive rate, false negative rate, likelihood ratio positive, likelihood ratio negative and prevalence of disease we calculate the effectiveness of the scheme.
White Matter(WM), Gray Matter(GM), Ceribrospinal Fluid(CSF), Confusion Matrix
Short address: https://sciup.org/15011900
IDR: 15011900
Text of the scientific article Study of Techniques used for Medical Image Segmentation and Computation of Statistical Test for Region Classification of Brain MRI
Published Online April 2013 in MECS
In medical imaging there is a massive amount of information, but it is not possible to access or make use of this information if it is efficiently organized to extract the semantics. To retrieve semantic image, is a hard problem. In image retrieval and pattern recognition community, each image is mapped into a set of numerical or symbolic attributes called features, and then to find a mapping from feature space to image classes. Image classification and image retrieval share fundamentally the same goal if there is given a semantically well-defined image set. Dividing the images which is based on their semantic classes and finding semantically similar images also share the same similarity measurement and performance evaluation standards.
An image retrieval framework consisting of three stages; feature extraction, feature selection and image retrieval using k-nearest neighbors in the selected feature space. Neurology is the current focus of the knowledge bank. These images are scanned from the CT or MRI.
Medical image segmentation[1] is the method of labeling each voxel in a medical image dataset to state its anatomical structure. The labels that result from this method have a wide variety of applications in medical research. Segmentation is a very common method so it is difficult to list most of the segmented areas, but a general list would consists of at least the following; the brain, heart, knee, jaw, spine, pelvis, liver, prostate, and the blood vessels. The input to a segmentation process is grayscale digital medical image, (like CT or MRI scan). The desired output restrains the labels that classify the input grayscale voxels. The use of segmentation is to give preeminent information than that which exists in the original medical images only. The set of labels that is produced through segmentation is also called a labelmap, which briefly tell its function as a voxel by voxel guide to the original imagery. Frequently used to improve visualization of medical image and allow quantitative measurements of image structures, segmentation are also important in building anatomical atlases, researching shapes of anatomical structures, and tracking anatomical changes over time.
A few data mining techniques are also used for segmenting medical image. Data mining is the method of discovering meaningful global patterns and relationships that lie hidden within very huge databases containing vast amount of data. Similar type of data is classified by using classification or clustering method, which is the elementary task of segmentation and pattern matching. Various techniques like neural networks, bayesian networks, decision tree and rulebased algorithms are used to get the desired data mining outcomes in segmentation.
The study of brain disorders requires accurate tissue segmentation of brain MRI images. For large database manual delineation of WM, GM and CSF in brain MRI images by a human expert is too time-consuming. Doctors use the scheme to automated segment the region of WM, GM and CSF. If the image have some type of disorder then it automatically detect that region. The tissues are segmented by using neuro fuzzy techniques into WM, GM, CSF and tumor region[2]. And from these regions, calculate some statistical features like energy, entropy, contrast, inverse difference moment, mean, standard deviation, average gray scale value of region, area of region are computed and can store the values in a database[2]. But this scheme was tested only on three normal and three abnormal brain MRI images. Now in this paper firstly axial view images of brain MRI images are collected from the database and further these images are tested and compare by using our scheme. Results are compared from the given database which is given by Keith A. Johnson and J. Alex Becker[3]. Means if the image is normal and after tested with our scheme it will also show normal image. This means the result matches or accurate. Then further this paper evaluates some statistical test to measure the effectiveness of our scheme. By using the measures of the confusion matrix, calculate the value of these statistical tests. These tests are accuracy, precision, sensitivity, specificity, False Positive Rate(FPR), False Negative Rate(FNR), likelihood ratio positive, likelihood ratio negative and prevalence of disease. The purpose of these statistical tests is to explain that how feasible our scheme is? Our scheme automated the extraction of brain MRI regions like WM, GM and CSF and also checks whether the image has tumorous region or the image is normal one. If the image has tumor region then the image is called as cancerous image. After detecting the tumor region we calculate some statistical properties of that region. The purpose of this is to interpret, analyze, classify and recognize the brain tissues information. It is helpful to radiologists, physicians and surgeons in their decision process, providing accurate data within reasonable timeframe.
Rest of the paper is organized as follows: In section II literature review of the techniques for medical image segmentation are described. Classification of segmentation methods are discuss in section III. Section IV describes the classification of brain MRI region. Some statistical tests illustrate in section V. Finally results and conclusion are in section VI and VII respectively.
-
II. Literature Review
In this section, review some of the primary techniques available in literature for medical image segmentation. In the recent years various schemes for processing medical images appeared in literature. Researchers have developed many schemes and techniques for segmenting and characterizing the medical images. The use of segmentation is to partition an image into strong correlated parts with “area of interest” in the image. Image segmentation ends[4], when the object of focus is separated. Segmentation can be classified as complete and partial. Complete segmentation consequences in a set of disjoint regions corresponding absolutely with input image objects, whereas in partial segmentation resultant regions do not match directly with input image[5]. Image segmentation is often treated as a pattern recognition problem as segmentation requires classification of pixels[6]. In medical imaging automated description of different image components are used[6,49] for analyzing anatomical structures such as bones, muscles blood vessels, tissue types, pathological regions(like cancer, multiple sclerosis lesions) and for dividing an entire image into sub regions(WM, GM and CSF).
Paresh Chandra Barman et.al[7] proposed a new medical diagnosis system for image segmentation. In this a new variational level set algorithm is used without re-initialization. This algorithm can be easily implemented using a simple finite difference scheme. To remove noisy element of the image, thresholding and erosion methods are used. During this not only the initial curve shown anywhere in the image, the interior contours (like tumors) can also be automatically and quickly detected.
H.S. Prasantha et.al[8] discussed various image segmentation algorithms. They compare the outputs and check which type of segmentation technique is better for a particular format. Correctness and stability are the two key factors which allows for the use of a segmentation algorithm in a larger object detection system. Ajala Funmilola A. et.al[9] explained several methods employed for medical image segmentation such as Clustering, Thresholding, Classifier, Region Growing, Deformable Model, Markov Random Model etc. Their work is mainly focused on clustering methods, specifically k-means and fuzzy c-means clustering algorithms. They combine these algorithms together to form another method called fuzzy k-c-means clustering algorithm, which results better in terms of time utilization. The algorithms have been implemented and tested with MRI images of human brain. Results have been analyzed and recorded.
S. Murugavalli et.al[10] implements a neuro-fuzzy segmentation process of the MRI data to detect various tissues like WM, GM, CSF and tumor. To detect brain tumor a neuro fuzzy based segmentation process was implemented. In terms of weight vector, execution time and detected tumor pixels they studied the performance of the image. Then compare the results with the existing ones. This attains a higher value of detected tumor pixels than any other segmentation techniques. With extra input features this also acquires the weight vector value for the neuro fuzzy i.e. (6×6). The number of tumor cells and the execution time will also be analyzed for weight vector value with different distance classifier methods. This also analyzes the change of growth rate of the tumor of the same patient. A Fuzzy kohonen neural network for medical image segmentation[11] is used to analyses the tumor by extraction of the features(area, entropy, means and standard deviation).These measurements gives a description for a tumor. A combined thresholding and fuzzy rule based segmentation technique[12] has been presented for analyzing MRI brain images. These methods are faster than others (FCM and Neural Networks based techniques), by using thresholding as a pre-segmentation. Also it gives a rule-based interface which can combine rules based on the experience of humans and rules learned from the measured numerical data. The outcomes of the proposed method have been compared with the fuzzy c-means algorithm on brain MRI dataset. For brain tumor image segmentation S. Murugavalli et. al[13] proposed a high speed parallel fuzzy c-means algorithm to improve the performance of fuzzy c-mean(FCM) algorithm. In the segmentation techniques for clustering process, this proposed algorithm has the advantage of both the sequential FCM and parallel FCM. This algorithm is very fast when the image size is large and requires less execution time. They also accomplished less processing speed and minimizing the requirement for accessing secondary storage. In FCM algorithm, this decreases the computation cost and improves the performance by finding a good set of initial cluster centers instead of random initial cluster center. Shi juan He et. al[14] described an MRI brain image segmentation algorithm which works in two steps. One is histogram-based fuzzy C-means(FCM) method and another is multi-scale connectivity-restrained clustering algorithm for segmenting the brain image into three major classes of GM, WM and CSF. To segment the images, histogram based FCM algorithm is used first. Then segmented result was refined by connectivity restrained clustering. The results obtained were satisfied, but this method is little complicated.
Yan Li et.al[15] presented a new unsupervised MRI segmentation method based on self-organizing feature map(SOFM). By using a Markov Random Field(MRF) model, the proposed algorithm includes extra spatial information about a pixel region. The MRF improves the segmentation results without extra data samples in the training set. The cooperation of MRF into SOFM has shown its great potentials as MRF models the smoothness of the segmented regions. It verifies that the neighboring pixels should have similar segmentation assignment unless they are on the boundary of two distinct regions. The simulation results demonstrate that the proposed algorithm works well.
Jianhua Xuan et. al[16] proposed a method that unite region growing and edge detection methods for brain MRI image segmentation. They start with a simple region growing algorithm which produces an over segmented image, after that a sophisticated region merging method is applied which is capable of handling complex image structures. Edge information is then integrated to verify. And wherever required, correct region boundaries. The outcome shows that the method is reliable and efficient for MR brain image segmentation.
-
III. Classification of Segmentation Methods
-
3.1 Thresholding
-
3.2 Region Growing
-
3.3 Classifiers
-
3.4 Clustering
In this section various methods which are used by the researchers to segment the region of medical image are described. Some of them are thresholding, region growing, classifier, clustering, artificial neural networks, deformable models, atlas-guided approaches, level set methods.
For image segmentation this is one of the oldest methods. The segmentation is done by grouping all pixels with intensity between two such thresholds into one class. On the identification of a good threshold, this method relies and failing of such threshold may guide to poor segmentation. A process to determinate more than one threshold value is called multithresholding[17]. In a sequence of image processing operations[18] thresholding is used as an initial step. In digital mammography it has been used in which two classes of tissue are present; one is healthy and other is tumorous[19,20].
For image segmentation region growing method is a well developed technique. Based on some predefined criteria this method extracts image region. This is based on intensity information or edges in the image. An operator manually selects a seed point and extracts all pixels that are connected to the initial seed based on some predefined criteria.
An algorithm called as split-and-merge which is related to region growing algorithm, but it does not require a seed point[21]. Region growing can also be sensitive to noise, causing extracted regions to have holes or even become disconnected. These problems can be removed using a homotopic region-growing algorithm[22].
Classifier methods(supervised methods) are pattern recognition techniques that partition a feature space derived from the image by using data with known labels[23,24]. A simple classifier is the nearestneighbor classifier, in which each pixel is classified in the same class as the training datum with the closest intensity. The k-nearest-neighbor classifier is a generalization of this approach. The k-nearest-neighbor classifier is considered a nonparametric classifier because it makes no underlying assumption about the statistical structure of the data. A normally used parametric classifier is the maximum-likelihood or Bayes classifier. Other parametric and nonparametric classifiers are described elsewhere[25]. Limitation of classifiers are, they generally do not perform any spatial modeling and the requirement of manual interaction to obtain training data.
Clustering(unsupervised methods) can be defined as the process of organizing objects into groups whose members are similar in some way. Without using training data they normally performs as classifiers. To compensate for the lack of training data, this iteratively alternate between segmenting the image and characterizing the properties of each class. There are three commonly used clustering algorithms; k-means algorithm, the fuzzy c-means algorithm, and the expectation-maximization algorithm[26,27,28].
Assume that there are three types of classes; WM, GM and CSF. FCM algorithm generalizes the k-means algorithm which allow soft segmentations based on fuzzy set theory. Expectation Maximization(EM) algorithm applies the same clustering principles with that the data follow a Gaussian mixture model.
-
3.5 Artificial Neural Networks
-
3.6 Deformable Models
-
3.7 Atlas-guided Approaches
-
3.8 Level Set Methods
Artificial neural networks(ANNs) are parallel networks of processing elements or nodes that simulate biological learning. Each node in an ANN is capable of performing computations. Learning is achieved through the adaptation of weights assigned to the connections between nodes. It is most widely used in medical imaging as a classifier[29,30] in which the weights are determined by using training data and the ANN is then used to segment new data. ANNs can also be used in an unsupervised method as a clustering method[23,31], as well as for deformable models[32].
Deformable Models are extensively used in segmentating medical images. They are routinely used in the reconstruction of the cerebral cortex from MRI images [33-43]. These are also used in the segmentation of cardiac images[36], bone in Computed Tomography images[37] and ultrasound[38]. The ability to directly generate closed parametric curves or surfaces from images and their incorporation of a smoothness constraint are the main advantages of deformable models that provides robustness to noise and spurious edges.
These have been commonly used in MRI brain imaging for segmentation of various structures[44], as well as for extracting brain volume from head scans[45]. They also provide a standard system for studying morphometric properties[46,47,48]. Even with nonlinear registration methods, however, finding accurate segmentations of complex structures is difficult because of anatomical variability.
For medical image segmentation, level set method is a powerful method. It can handle any of the cavities, concavities, convolution, splitting, or merging. This method needs to specify initial curves. If these curves are placed near symmetrically with respect to the object boundary, can only give good outcomes.
-
IV. Classification of Brain MRI region
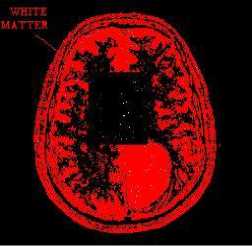
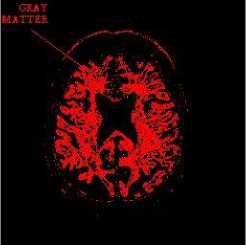
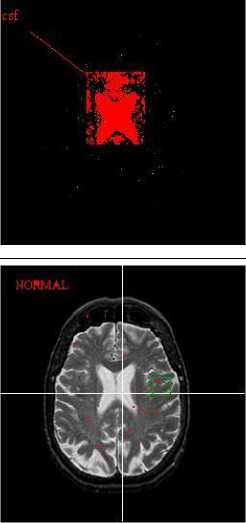
Normaly brain image can be classified into three regions; WM, GM and CSF. If there is some deformity in the image, called tumor region. This tumor(cancerous) region can be called as fourth region of the brain.
A scheme is proposed which is based on SOM neural network for segmenting brain MRI[2]. In this paper[2] we apply the scheme only on three normal and three abnormal brain MRI images. This scheme segments the brain MRI into WM, GM and CSF regions. But if the image is abnormal our scheme segments the tumor region also. These regions could be regarded as segmentation outcomes reserving some semantic meaning. This approach thus provides a feasible new solution for image segmentation like WM, GM, CSF and tumor, also characterize the tumor region by extracting features(area, entropy, contrast, energy, mean, IDM and standard deviation).
Now in this paper, we applied this scheme on Keith’s database to automatically segment the regions of brain MRI to extract WM, GM, CSF and tumor region. All axial view images are tested by this scheme. After getting the results, calculate the effectiveness of the scheme using some statistical tests like accuracy, precision, sensitivity, specificity, positive predictive value, negative predictive value, false positive rate, false negative rate, likelihood ratio positive, likelihood ratio negative and prevalence of disease. All these tests are very important to test the effectiveness of the scheme.
-
V. Statistical Test
Statistical test provides a mechanism for making quantitative decisions about a process (scheme). The aim is to determine whether there is enough evidence to "reject" a speculation or hypothesis about the process. The assumption is called the null hypothesis. This paper test axial view images of brain MRI from the database given on web[3]. There are total 49 axial view images which are tested by using confusion matrix. The interpretation being generally used is the confusion matrix. A confusion matrix is a visualization tool usually used in supervised learning while in unsupervised learning it is called as a matching matrix. A confusion matrix consist information about actual and predicted classifications which is done by a classification system. A confusion matrix illustrates the number of correct and incorrect predictions made by the model compared with the actual classifications in the test data. Performance of such systems is normally calculated by using the data in the matrix. Confusion matrix consists of True Negative(TN), False Positive(FP), False Negative(FN) and True Positive(TP). Each column and each row represents the instances in a predicted class and the instances in an actual class respectively.
C = P FP1 с = Ч Ч l^v TPi , Ui 29-1 (1)
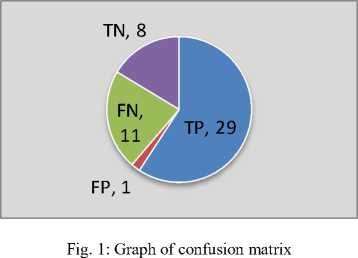
Table 1 shows the measures of confusion matrix. The images which are collected from the database are normal as well as cancerous(tumor) brain images. In this paper there are total 49 test cases in which 29 cases are TP means our test(scheme) says that they are positive. These are called TP. Some have the tumor, but the test claims they don't have tumor. These are called FN. There are 11 cases which are FN in our test. Some cases don't have the tumor, and the test says they don't, they are TN and in our test there are 08 such cases. Finally we have an image which is the normal brain MRI image and have a positive test result, this case is called as FP which is the only one case in our test. FNs and FPs are significant issues in medical testing.
Table 1: Confusion Matrix Measures
|
Truth |
||||
|
(Disease) Positive |
(Disease) Negative |
Total no. |
||
|
Test result |
Positive |
True Positive (TP) = 29 |
False Positive (FP) = 01 |
T test positive 30 |
|
Negative |
False Negative (FN) = 11 |
True Negative (TN) = 08 |
T test negative 19 |
|
|
Tr _ . disease 40 |
non disease 09 |
Total 49 |
||
Sensitivity and specificity are the two statistical measures of the performance of a binary classification test in medical field. In statistics it is also known as classification function. Sensitivity measures the percentage of actual positives values which are correctly identified whereas specificity measures the percentage of negative values which are correctly identified. Sensitivity(TPR) is the ratio of people that are tested positive(TP) and all the people that are actually positive(TP+FN). It can be seen as the probability that the test is positive, this means the patient is sick. A test has a 96.67% PPV, means 96.67% of those cases with a positive test will actually have the condition. In our test sensitivity and specificity are 72.50% and 88.89% respectively. Specificity(TNR) is the ratio of people that tested negative(TN) of all the people that actually are negative (TN+FP). Sensitivity can be viewed as the probability that the test result is negative given that the patient has no brain tumor.
Besides sensitivity and specificity, the performance of a test can be calculated with Positive Predictive Values(PPV) and Negative Predictive Values(NPV). The positive predictive value is defined as the ratio of true positives out of all positive outcomes. The Negative Predictive Value(NPV) is a summary statistic used to describe the performance of a diagnostic testing method in statistics and diagnostic testing. It is defined as the proportion of subjects with a negative test result which are correctly diagnosed. In medical testing, a high NPV means that the test rarely misclassifies a sick person as being healthy. In our scheme NPV is 42.11%, a negative test result may provide some reassurance that the patient is unlikely to have cancer. Positive predictive value is 96.67% in our test. So we can say that sensitivity and specificity are characteristics of the test.
Accuracy concerns the quality of data and the number of errors contained in a dataset. It is the degree to which information matches true or accepted values whereas the precision is the degree to which repeated measurements under unchanged conditions show the same results. It is also known as reproducibility or repeatability. Truthful information may specify the characteristics of features in detail. In the case of brain MRI image analysis, the results produced using a certain method can be presented in a few ways. Accuracy and precision are 75.51% and 96.67% respectively in our test.
The likelihood ratio merge information from sensitivity and specificity, to indicate how much the odds of disease change based on a positive or a negative result. The result of likelihood ratio positive and likelihood ratio negative are 6.53 % and 0.31 % respectively.
Prevalence can be defined as the total number of cases of a disease in a given population at a specific time. There are total 49 cases which are tested for disease(cancer). Out of these cases, 40 cases are cancerous image and 09 cases are non cancerous images. So according to our test, prevalence of the disease is 81.63%. The test has 88.89% specificity. In other words this can be said that 08 persons out of 49 persons with negative results are truly negative and 01 individuals test positive for a disease which they do not have. Higher prevalence increases positive predictive value. Conversely, increased prevalence results in decreased negative predictive value.
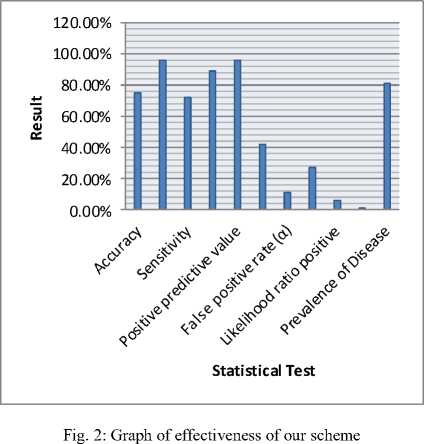
These are some often mentioned terms of statistical test (accuracy, precision, specificity, sensitivity or True Positive Rate(TPR), False Positive Rate(FPR), False Negative Rate, likelihood ratio positive, likelihood ratio negative and prevalence of disease). The effectiveness of our scheme of these statistical tests is summarized in Table 2. Fig1 shows the graph of confusion matrix and Fig2 shows the graph of effectiveness of our scheme.
Table 2: Effectiveness of Our Scheme
|
Statistical Test |
Formula |
Result |
|
Accuracy |
(TP+TN) / (TP+FP+FN+TN) |
75.51% |
|
Precision |
TP / (TP+FP) |
96.67% |
|
Sensitivity |
TP / (TP + FN) |
72.50% |
|
Specificity |
TN / (FP + TN) |
88.89% |
|
Positive predictive value |
TP / (TP + FP) |
96.67% |
|
Negative predictive value |
TN / (FN + TN) |
42.11% |
|
False positive rate (a) |
FP / (FP + TN) |
11.11% |
|
False negative rate (в) |
FN / (TP + FN) |
27.50% |
|
Likelihood ratio positive |
sensitivity / (1 – specificity) |
6.53% |
|
Likelihood ratio negative |
(1 - sensitivity) / specificity |
0.31% |
|
Prevalence of Disease |
T disease / Total * 100 |
81.63% |
-
VI. Results and Discussion
This paper enhances to test the axial view images of the web database by using the scheme discussed in[2]. This scheme automatically classifies the regions into WM, GM, CSF and tumor. Results of the extraction of regions of WM, GM, CSF and tumor of normal and abnormal brain MRI are shown in Table 3 and Table 4 respectively. Test and compare the results of the brain MRI images from the database given on the web. Then further calculate the confusion matrix where each column of the matrix represents the instances in a predicted class and each row represents the instances in an actual class. There are total 49 images of axial view in which 29 are TP images, 08 cases are TN images, 01 case is FP images and 11 are FN images.
According to Keith database; there are total 37 cancerous images. But after testing through the developed scheme[2], out of 37 cancerous images there are 29 True Positive(TP) images which means the images have tumor region and 08 images have True Negative(TN) result means the images have no tumor region shown in these images. And 12 cases are normal images of axial view according to Keith database. After testing these 12 cases from the developed scheme there are 11 False Negative(FN) cases means the image is normal and 01 is False Positive(FP) case means the image has tumor region. With the help of confusion matrix, calculate some statistical test like accuracy, precision, sensitivity, specificity, positive predictive value, negative predictive value, false positive rate, false negative rate, likelihood ratio positive, likelihood ratio negative and prevalence of disease are 75.51%, 96.67%, 72.50%, 88.89%, 96.67%, 42.11%, 11.11%, 27.50%, 6.53%, 0.31% and 81.63% respectively. All these results show the effectiveness of our scheme. For any new scheme, effectiveness is very much important to measure how feasible our scheme is?
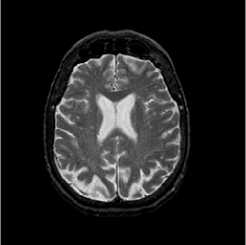
Table 3: Extraction of regions for normal brain MRI image
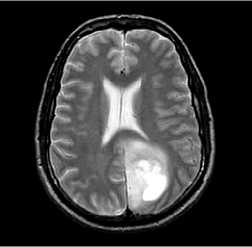
Table 4: Extraction of regions for abnormal brain MRI image
Input image
Input image
White matter
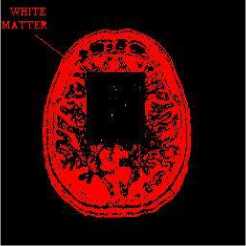
White matter
Gray matter
CSF
Tumor
|
Gray matter |
MATTER |
||
|
CSF |
|||
|
csf • v |
|||
|
Tumor |
~ \\ |
||
-
VII. Conclusion
This paper describes the study of various techniques for medical image segmentation. Further this paper also shows the effectiveness of our scheme by comparing the results from the Keith database given on web. Effectiveness can be checked by applying statistical test. This paper tests all the axial view brain MRI images using our scheme. Our scheme classifies the regions of brain MRI image and compares the results from the web database. On the bases of these results, first calculate the measures of confusion matrix. After calculating confusion matrix measures, calculate the statistical test like accuracy, precision, sensitivity, specificity, positive predictive value, negative predictive value, false positive rate, false negative rate, likelihood ratio positive, likelihood ratio negative and prevalence of disease to measure the effectiveness of the scheme. This scheme is based on integrating SOM and Neuro Fuzzy techniques to segment the regions of brain MRI images like WM, GM, CSF and tumor region. Results are summarized in Table 2 which shows the effectiveness of our scheme.
References Study of Techniques used for Medical Image Segmentation and Computation of Statistical Test for Region Classification of Brain MRI
- Dzung L.Pham et.al. A survey of current methods in medical image segmentation. Annual Review of Biomedical Engineering,January 1998.
- Anamika Ahirwar, R.S. Jadon. Segmentation and characterization of Brain MR image regions using SOM and neuro fuzzy techniques. Proceedings of the First International Conference on Emerging Trends in Soft Computing and ICT (SCIT2011), 16-17 March 2011 at Guru Ghasidas Vishwavidyalaya, Bilaspur (C.G.) India, ISBN: 978-81-920913-3-4, pp 128-131.
- http://www.med.harvard.edu/aanlib
- A.D. Jepson and D.J. Fleet. Image Segmentation. 2007.
- Wen-Xiong Kang, Qing-Qiang Yang, Run-Peng Liang. The Comparative Research on Image Segmentation Algorithms.
- C. Li, C.Y. Xu, C.F. Gui, and M.D. Fox. Level Set Evolution without Re-initialization: A New Variational Formulation, 2005 IEEE Computer Society Conference on Computer Vision and Pattern Recognition.
- Paresh Chandra Barman et.al. MRI IMAGE SEGMENTATION USING LEVEL SET METHOD AND IMPLEMENT AN MEDICAL DIAGNOSIS SYSTEM. Computer Science & Engineering: An International Journal (CSEIJ), Vol.1, No.5, December 2011.
- H.S.Prasantha et.al. MEDICAL IMAGE SEGMENTATION.(IJCSE) International Journal on Computer Science and Engineering. Vol. 02, No. 04, 2010, 1209-1218.
- Ajala Funmilola A et. al.,“Fuzzy k-c-means Clustering Algorithm for Medical Image Segmentation”. Journal of Information Engineering and Applications, ISSN 2224-5782 (print) ISSN 2225-0506 (online) Vol 2, No.6, 2012.
- S. Murugavalli and V. Rajamani. An Improved Implementation of Brain Tumor Detection Using Segmentation Based on Neuro Fuzzy Technique. Journal of Computer Science 3 (11): 841-846, 2007, ISSN 1549-3636.
- Nahla Ibraheem Jabbar, and Monica Mehrotra. Application of Fuzzy Neural Network for Image Tumor Description. Proceedings of world academy of science, engineering and technology volume 34 October 2008 ISSN 2070-3740.
- Y. Zhu, Z. Chi and H. Yan. Brain Image Segmentation Using Fuzzy Classifiers.
- S. Murugavalli, V. Rajamani. A HIGH SPEED PARALLEL FUZZY C-MEAN ALGORITHM FOR BRAIN TUMOR SEGMENTATION. BIME Journal, Volume (06), Issue (1), Dec. 2006.
- Shijuan He et.al. MRI Brain Images Segmentation. IEEE 0-7803-6253-5/00/$10.00©2000.
- Yan Li and Zheru Chi. MR Brain Image Segmentation Based on Self-Organizing Map Network. International Journal of Information Technology Vol. 11, No. 8, 2005.
- Jianhua Xuan, Tiilay Adali, Yue Wang. SEGMENTATION OF MAGNETIC RESONANCE BRAIN IMAGE: INTEGRATING REGION GROWING AND EDGE DETECTION. IEEE 1995.
- Sahoo PK, Soltani S, Wong AKC. A survey of thresholding techniques. Comp Vis Graph Image Proc 1988; 41:233–260.
- Singleton HR, Pohost GM. Automatic cardiac MR image segmentation using edge detection by tissue classification in pixel neighborhoods. Magn Reson Med 1997; 37:418–424.
- Polakowski WR, Cournoyer DA, Rogers SK, et al. Computer-aided breast cancer detection and diagnosis of masses using difference of Gaussians and derivative-based feature saliency. IEEE Trans Med Imaging 1997; 16:811–819.
- Cheng HD, Lui YM, Freimanis RI. A novel approach to microcalcification detection using fuzzy logic technique. IEEE Trans Med Imaging 1998; 17:442–450.
- Manousakas N, Undrill PE, Cameron GG, et al. Split-and-merge segmentation of magnetic resonance medical images: performance evaluation and extension to three dimensions. Comp Biomed Res 1998; 31: 393–412.
- Udupa K, Samarasekera S. Fuzzy connectedness and object definition: theory, algorithms and applications in image segmentation. Graph Models Image Process 1996; 58:246–261.
- Bezdek JC, Hall LO, Clarke LP. Review of MR image segmentation techniques using pattern recognition. Med Phys 1993; 20:1033–1048.
- Schalkoff J. Pattern recognition: statistical, structural and neural approach. New York: Wiley & Sons, 1992.
- Zijdenbos AP, Dawant BM. Brain segmentation and white matter lesion detection in MR images. Crit Rev Biomed Eng 1994; 22:401–465.
- Pham D. L., Xu C., and Prince J. L., A Survey of Current Methods in Medical Image Segmentation. Annual Review of Biomedical Engineering, 1998.
- Xu R., and Wunsch D. Survey of Clustering Algorithms. IEEE Transactions on Neural Networks, vol. 16, no. 3, May 2005.
- Engr. V. C. Chijindu et.al.,Medical Image Segmentation Methodologies – A Classified Overview, African Journal of Computing & ICT. ISSN 2006-1781, Vol 5. No. 5, Sept 2012.
- Hall LO, Bensaid AM, Clarke LP, et al. A comparison of neural network and fuzzy clustering techniques in segmenting magnetic resonance images of the brain. IEEE Trans Neural Netw 1992; 3:672–682.
- Gelenbe E, Feng Y, Krishnan KRR. Neural network methods for volumetric magnetic resonance imaging of the human brain. Proc IEEE 1996; 84:1488–1496.
- Reddick WE, Glass JO, Cook EN, et al. Automated segmentation and classification of multispectral magnetic resonance images of brain using artificial neural networks. IEEE Trans Med Imaging 1997; 16:911–918.
- Vilarino DL, Brea VM, Cabello D, et al. Discrete-time CNN for image segmentation by active contours. Pattern Recognit Lett 1998; 19:721–734.
- Davatzikos C, Bryan RN. Using a deformable surface model to obtain a shape representation of the cortex. IEEE Trans Med Imaging 1996;15:785–795.
- McInerney T, Terzopoulos D. Medical image segmentation using topologically adaptable surfaces. Lect Notes Comp Sci 1997; 1205:23–32.
- Xu C, Pham DL, Prince JL, et al. Reconstruction of the central layer of the human cerebral cortex from MR images. In Proc Int Conf Med Image Comp Comp Assist Interv. Cambridge, MA; 1998, pp. 482–488.
- Bardinet E, Cohen LD, Ayache N. A parametric deformable model to fit unstructured 3D data. Comp Vis Image Underst 1998; 71:39–54.
- Neumann A, Lorenz C. Statistical shape model based segmentation of medical images. Comp Med Image Graph 1998; 22:133–143.
- Cohen LD. On active contour models and balloons. CVGIP: Image Underst 1991; 53:211–218.
- Caselles V, Catte F, Coll T, et al. A geometric model for active contours. Number Math 1993; 66:1–31.
- Xu C, Prince JL. Snakes, shapes, and gradient vector flow. IEEE Trans Image Proc 1998; 7:359–369.
- McInerney T, Terzopoulos D. Topologically adaptable snakes. In: Proc Int Conf Comp Vis. Cambridge, MA: IEEE Comp Soc, 1995; 840–845.
- McInerney T, Terzopoulos D. Deformable models in medical image analysis: a survey. Med Image Anal 1996; 1:91–108.
- Maintz JBM, Viergever MA. A survey of medical image registration. Med Image Anal 1998; 2:1–36.
- Collins DL, Holmes CJ, Peters TM. Evans neuroanatomical segmentation. Hum Brain Mapp 1995; 3:190–208.
- Aboutanos GB, Dawant BM. Automatic brain segmentation and validation:image-based versus atlas-based de-formable models. SPIE Proc Med Imag 1997; 3034:299–310.
- Thompson P, Toga AW. Detection, visualization and animation of abnormal anatomic structure with a probabilistic brain atlas based on random vector field transformations. Med Image Anal 1997; 1:271–294.
- Pathak SD, Grimm PD, Chalana V, et al. Pubic arch detection in transrectal ultrasound guided prostate cancer therapy. IEEE Trans Med Imaging 1998; 17:762–771.
- Bae KT, Giger ML, Chen C, et al. Automatic segmentation of liver structure in CT images. Med Phys 1993; 20:71–78.
- Yang Fei and Jong Won Park. A New Variational Level Set Evolving Algorithm for Image Segmentation.
