Study of the kinetics structure formation of cement dispersed systems. Part I

Author: Korolev E.V., Grishina A.N., Inozemtcev A.S., Ayzenshtadt A.M.
Journal: Nanotechnologies in Construction: A Scientific Internet-Journal @nanobuild-en
Section: Construction materials science
Article in issue: 3 Vol.14, 2022.
Free access
Introduction. The study of the kinetics structure formation is rarely the subject of a careful study. Although it is important for materials used to create elements of building structures, energy elements, thermoelements and materials for other purposes. The article proposes refinements of the methodology for determining the parameters of the kinetics structure formation of cement composites, including modified compositions. Methods and materials. The structure formation of cement systems with plasticizers, microsized mineral additives (hydrosilicates of barium, copper and zinc) and nanosized particles of zinc hydrosilicates has been studied. Results and discussion. It is proposed to single out two stages of initial structure formation: the stage of setting the cement paste and the stage of hardening. The selection of the setting stage is connected with the natural laws of the development of natural systems, namely, the initial formation of a structural grid obeys an exponential law. Moment of time when a deviation from this law is observed is the time of occurrence of spatial and/or prescription difficulties that hinder the exponential development of the system. Conclusions. A strong negative relationship between the parameters φ and β of the equation H(t) = a exp(φt β) has been established. These parameters characterize the rate of structure formation at the setting stage (parameter φ) and the density of the structure (parameter β or the internal dimension Di, 0 associated with it). The presence of such a negative relationship indicates the inadvisability of accelerating the processes of structure formation at the stage of setting. This is supported by a strong positive relationship between the period of initial structure formation t0, s1 and the strength of the material R28.
Cement binder, cement hydration, structure formation, plasticizer, hydrosilicate
Short address: https://sciup.org/142232048
IDR: 142232048 | DOI: 10.15828/2075-8545-2022-14-3-176-189
Text of the scientific article Study of the kinetics structure formation of cement dispersed systems. Part I
Original article
A mong the properties of various materials used in the construction industry, strength characteristics are important [1, 2].This applies both to composites on mineral [3–5] and organic binders [6, 7]; to structural products [4, 7, 8], thermal insulation materials [9], materials used to create photovoltaic cells [10], materials for 3D printing [5, 11]. In this case, the strength of the formed composite is determined by the number and energy of the formed bonds
(the strength of an individual bond) [8, 12, 13], which is determined by the chemical composition of the formed substances. At the same time, systems with a certain number of already formed bonds are analysed in the scientific literature [14, 15]. Often the analysis begins to produce on 1 of the 28 days of hardening. The set dependencies between the number of crystallization centres, the chemical composition of the composite, the rate of formation of bonds between individual elements and the formed strength of the composite are of interest for mineral systems.
CONSTRUCTION MATERIAL SCIENCE
The study of the kinetics of structure formation of building materials is rarely the subject of careful study. The kinetics of material strength development is often investigated. For example, the results of a study of changes in the strength of cement concrete over a long period of time are presented in [16–22]. Also, the object of study is the kinetics of destruction of the material during its strength test [23-31].
Investigation of the kinetics of chemical reactions for “CaO‒SiO2‒H2O” systems was carried out according to the kinetic dependences of changes in the concentration of indicator ions, changes in electrical conductivity, etc. [32].
Often the choice of method for studying structure formation depends on the type of material. For mineral binders, hydration has a significant effect on the structure formation of artificial stone. For such binders, several theories of their hydration have been developed [33]. For mineral binders, for which the process of product formation in the contact zone of interacting components is the limiting one, the equation proposed by G. Tammn can be applied:
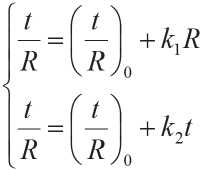
A system of equations to determine the kinetics of the process of structure formation is proposed by Rakhim-baev Sh.M. with co-authors [34]. It makes it possible to evaluate the influence of various factors on the structure formation of building materials:

and to determine the degree of transformation of substances the equation proposed by V. Yander:
— = -(1-л/кП?У , (2)
dt 2V ' \ t
where h is interaction product layer thickness; α is the degree of conversion of the starting reagent into the reaction product; k is chemical reaction rate constant; D is diffusion coefficient; c is empirical constant; t is time.
From equation (2) it follows that the diffusion coefficient and the reaction rate constant are the main parameters for the process of hydration of mineral binders.
The dependence of the strength of an artificial stone on the content of a component capable of transformation (hydration) is proposed in [34]:
^0
Х-Се^ -^-Cybt
1 — Ce"28a — (1 — C^e"%b ,
C is calculated content of tricalcium silicate in Port-
land cement; a , b are empirical coefficients; t is time (“28” is the time measured in days and taken as the standard period for the formation of the strength of the cement stone).
The formation of hydration products is a necessary but not sufficient condition for the formation of a durable artificial stone. In this regard, the general equation of curing strength is often used:
R(t) = a-vb ln(/),
a , b are empirical coefficients.
k 1, k 2 are empirical coefficients of inhibition of the process of structure formation of a building material; ( t / R )0 is reverse initial rate of structure formation.
In this case, structure formation is understood as any processes that lead to a change in the strength of the material, which is an important characteristic of the quality of its structure. Naturally, processes at the stage of formation of the material structure (initial structure formation) and destruction processes that occur most intensively during the operational period (structure formation during the operational period) can be attributed to the processes of structure formation.
The initial period of structure formation is also considered as a period that includes several stages. In particular, the equation in which the curing of artificial stone is considered as a two-stage process is given in [34]:
R^ = R^-e"bta ^qdXxY - , (6)
Vo 7
R 0 is initial strength; t 0 is start time hardening of the primary structure; a , b , q , d are empirical coefficients depending on various factors: coefficient q is coefficient of the relative effect of temperature on the intensity of hardening of cement stone in the late stages of hardening; coefficient d is coefficient characterizing the intensity of the increase in the strength of the cement stone in the late stages of hardening; coefficient a is coefficient characterizing the kinetics of increase in the strength of cement stone in the initial period; coefficient b is scale factor.
The general kinetic equation (6) is very useful and, as indicated, characterizes the presence of two stages in the formation of the strength of the cement stone. From here, it has an obvious structure, namely: the first term describes the strength gain in the time period t ≤ t 0, and the second term describes in the subsequent period, that is, for t > t 0. It is important to note some features of this equation: • in the first period of time t ≤ t 0, the second term of equation (6) has negative values, which should be compensated by a scale factor, but in this formulation it has no physical meaning. In this case, from the analysis of the first term, the coefficient b must have a unit of change [unit of time– a ] (here a is the coefficient of equation (6));
CONSTRUCTION MATERIAL SCIENCE
-
• the coefficient d in the second term must have a unit of strength measurement, and not the rate of change in strength per unit time, since this term of the equation uses the relative time ‒ t 0;
• when studying formula (6), it is obvious that at t → ∞ the first term will be equal to R 0 (strength after the completion of the first stage of structure formation), and the second term will demonstrate a constant unlimited increase in strength, which is naturally erroneous. In this regard, the maximum value of the strength R max and the period of structure formation ts should be set. In this case, the period of structure formation can be calculated by the formula:
The fundamental justification of the coefficients a and b in formula (6) is given in the works of A.N. Bobryshev et al. [35–39]. To describe various kinetic processes of structure formation, these authors used only the first term of formula (6), while imagining that kinetic processes obey the following equation:
^^(l-e-^”), (8)
where y m is limiting value of the property characterizing the process of structure formation; α , n are coefficients.
In this description of the kinetic process, the coefficient α characterizes the rate of the process, and the coefficient n characterizes the geometric properties of the emerging structure.
Formally, the coefficient n is equal to the Hurst exponent H , which varies in the range: 0 < H < 1. In this case [40]:
-
• at H > 0.5, the process is persistent, that is, the process for which the probability of maintaining the observed trend has high values,
-
• at H < 0.5, the process is anti-persistent; for such a process there is a high probability of a change in the observed trend in the subsequent period (in the future),
-
• at H = 0.5, process for which there is no pronounced trend.
The Hurst exponent is related to the Hausdorff-Besicovich dimension D , which is used to evaluate the geometric characteristics of the emerging structure [35]:
Д =2и + 1, (9)
of structure formation. In this regard, we will propose some clarifications, namely: when forming a database on the structure formation of various materials, it is advisable to use the following characteristic:
here the index “ c ” means “clean”.
The general equation of system development is an alternative to model (8) [41]:
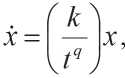
k is coefficient characterizing the rate of development of the system in time t ; q is constant; x is quantity characterizing the property of the system.
Equation (11) shows:
-
• the rate of change in the “size” of the system depends on its size;
-
• the coefficient k / tq , which characterizes the rate of increase in the size of the system, decreases with time. For building materials, the size of the system in the context of structure formation can be understood as the
number of formed bonds that determine the properties of the material; this follows from the definition of the structure [42–44]. It is obvious that the rate of bond formation will decrease as the components providing their formation are reduced. From this, we can conclude that
formula (11) is applicable to the analysis of the structure formation of building materials at different stages of their
life cycle. When analysing structure formation during the
operational period x in equation (11) will characterize the number of destroyed (destructured) bonds.
The solution of differential equation (11) has the following form:
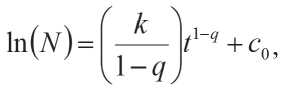
N is number of connections.
We determine the constant c 0 from the condition N ( t 0) = N max, that is, after the completion of the considered period of structure formation at t = t 0, the number of bonds formed is maximum:
After transformation (12), taking into account formula (13) and replacing φ = ( k /(1 – q )) and β = 1 – q , we obtain:
here the index “ i ” indicates that this is the “internal” dimension of the emerging structure.
The coefficient α of formula (8), as well as the coefficient b of formula (6), also has a complex unit of measurement, which makes it difficult to analyse the kinetics
In --- = -tp^ -t^
v ^max > or
N)=^max eXp(-^ -^))
CONSTRUCTION MATERIAL SCIENCE
Comparison of formulas (14) and (8) indicates their obvious difference: equation (8) describes the development of a system whose indicator properties reach the maximum value ym and do not change in the future, that is:
)™^) = У™, (15)
and according to formula (14), up to t = t 0 and at β > 0, φ > 0, the development of the system proceeds according to the classical exponential law, and at t > t 0, the development of the system accelerates. However, this acceleration has no physical justification. The exponential nature of the increase in the number of bonds indicates their formation without the presence of interfering factors. For β < 0 and φ < 0, the nature of the change in the number of bonds is similar to equation (8). However, for t > t 0, the development of the system continues, which also has no physical justification.
From this, we can conclude that for the analysis of systems in which conditions that prevent the formation of new bonds are not formed, it is advisable to apply formula (14). As a rule, this is the initial period of structure formation, the completion of which coincides with the emergence of spatial and resource constraints that affect structure formation. In this case, it is expedient to use formula (8) to describe structure formation.
It is important to note that formula (8) allows to describe the entire period of structure formation. However, the value n > 1, which is outside the natural range of variation of the Hurst exponent. It is noted in [45] that in the case of amplitude jumps distributed according to Levy statistics over a time determined by the jump value, the Hurst exponent is H > 1. Obviously, this case ( H > 1) requires a separate study related to the definition of the law of distribution of a random variable.
In [46–50] it is shown that the analysis of the structure formation of building composites should be carried out using an intensive property, that is, depending on the structure of the material. In addition, φ and β are interdependent and characterize the system development constant:
фР = ks . (16)
The coefficient ks can also be used as an additional characteristic of the process of structure formation of materials with an exponential growth of bonds. The analysis of formulas (14) and (16) shows that φ has a unit of measurement similar to the coefficient ks [unit of time–1], and the coefficient β does not have a unit of measurement.
Naturally, the formation of a structure from a mixture of components combined in certain proportions develops gradually. Point zones of products of physical and chemi-
cal processes are formed initially. Developing, they form the initial “network” of the products of the transformation of the components. At this stage, there are no difficulties and the development of the structure is characterized by exponential growth. Gradually, the density of the initial “network” increases both due to an increase in the number of “branches” and due to an increase in the volume of previously formed “branches”. Naturally, at this stage, both spatial and resource (gradual reduction in the amount of conversion products of components) constraints arise, which slow down the process of structure formation. After the complete transformation of the active components of the material into products and the completion of the formation of the “network”, its substance can undergo transformations that provide a minimum of Gibbs free energy (a minimum of the isobaric-isothermal potential). This process is the final stage of the initial (pre-operational) structure formation of the material.
The application of this approach provides the involvement of the concept of Shklovsky – De Gennes to describe the structure formation of the material. This was applied in [35]; the coefficient n of formula (8) is correlated with the Hurst exponent. For the initial stage of formation, the determination of the internal dimension of the network requires the involvement of another method for determining the Hurst exponent. To do this, it is rational to use the classical methods proposed by G. Hurst – R/S-analysis of time series [51–53]. In this case, the coefficient β is also equal to the Hurst exponent. Calculation of the internal dimension of the initial network is carried out according to the formula:
Д,о =2^ + 1. (17)
As shown earlier, the formation of products of physical and/or chemical transformations of the components (hydration for Portland cement) is not a sufficient condition for the formation of the strength of an artificial stone. An insufficient condition will also be the formation of a dense structure of the stone. All three conditions must be met, namely: 1) the presence of products of physical and/or chemical transformations of the components, 2) the formation of a dense structure, as well as 3) sufficient strength of the obtained products of transformations of the components. The parameters φ and β or α ( αc ) and Di ( Di , c ), determined from the kinetic dependences (8) and (14), characterize only two conditions: the formation of transformation products (parameters φ and α ( αc )) and the density of the structure (parameters Di ,0 and Di ( Di , c )).The strength of the products is an unknown quantity. Its definition is possible only when solving the inverse problem. That is, according to the known parameters of the structure and strength of an artificial stone (material), the strength values of the structure element are calculated.
CONSTRUCTION MATERIAL SCIENCE
METHODS AND MATERIALS
For cement materials, effective technological methods for controlling their structure formation are:
-
• use of plasticizers;
-
• introduction of mineral additives;
-
• use of nanoscale additives.
The following plasticizers were used: S3 (0.25–2.0% by weight of Portland cement), Melflux 2651F based on polycarboxylate esters (0.10–1.00% by weight of Portland cement); Melment F15G based on sodium sulfomelamin formaldehyde (0.50–1.50% by weight of Portland cement). The study of the effect of plasticizing additives on the processes of cement stone structure formation was carried out on Portland cement compositions with a constant W/C = 0.25.
Microsized particles of barium, copper, or zinc hydrosilicates were used as mineral additives. Nanosized particles of zinc hydrosilicates were used as nanosized additives. The influence of nanosized particles on the structure formation of the cement material was carried out in the presence of microsized particles of barium hydrosilicates, the content of which was constant and amounted to 10% by weight of Portland cement. To create a composite binder, microsized barium hydrosilicates were introduced into Portland cement in an amount of 10% by weight of cement, zinc hydrosilicates in an amount of 0.5, 1.0, 2.0, 3.0, 4.0, 5.0 and 6.0%, copper hydrosilicates in the amount of 0.25, 0.50, 0.75 and 1.00% or iron hydrosilicates in the amount of 1.0, 2.0, 3.0 and 5.0% by weight of cement. These modifiers were synthesized using the technology of hydrochemi-
cal synthesis from sodium hydrosilicates and aqueous solutions of salts (copper and barium chloride, as well as zinc and iron sulfate). For the synthesis of metal hydrosilicates, a solution of sodium hydrosilicates with silicate modulus M Si = 3.0; ω = 26.5% and salt solutions with concentrations С (ZnSO4) = 12%; С (СuCl2) = 15%; C (BaCl2) = 9.5%, C (Fe2(SO4)3) = 10.0% were used. The synthesis was carried out by adding a salt solution (ZnSO4, Fe2(SO4)3, CuCl2 or BaCl2) to a solution of sodium hydrosilicates at a ratio of MeO(Me2O3)/SiO2 = 1.0. The resulting precipitate was thoroughly washed by distilled water, dried at a temperature of 100–105оC and grinded. The average particle diameter of the obtained modifiers was 5–7 µm. The chemical composition of the modifying additive based on barium hydrosilicates additionally contains a small amount of barium carbonates formed during the carbonization of a barium salt as a result of mixing during synthesis. The modifying additive based on zinc hydrosilicates additionally contains a small amount of Zn4SO4(OH)6• х H2O. For the nanomodification of the binder nanosized zinc hydrosilicates produced according to the technology presented in [54] were used. Modifier have sedimentation stability [55]. The value of αs is the ratio of the concentration of sodium cations to the concentration of chloride anions during the synthesis of the nanomodifier. The gross formulas of the applied nanomodifiers are given in Table 1.
The concentrations of the used nanomodifiers are presented in Table 2.
The average particle size is presented in Table 3.
Cement, barium hydrosilicates in an amount of 10% by weight of cement, and zinc, iron or copper hydrosili-
Table 1
Chemical brutto-formula of zinc hydrosilicates
|
α s |
Concentration Fe(OH)3, % |
||
|
0.3 |
0.5 |
0.7 |
|
|
0.5 |
ZnO•2.35SiO2•nH2O |
ZnO•3.92SiO2•nH2O |
ZnO•5.49SiO2•nH2O |
|
1.0 |
ZnO•4.70SiO2•nH2O |
ZnO•7.84SiO2•nH2O |
ZnO•10.97SiO2•nH2O |
|
1.5 |
ZnO•7.05SiO2•nH2O |
ZnO•11.76SiO2•nH2O |
ZnO•16.46SiO2•nH2O |
Table 2
Concentration of nanoscale zinc hydrosilicates, %
|
α s |
Concentration Fe(OH)3, % |
||
|
0.3 |
0.5 |
0.7 |
|
|
0.5 |
0.0282 |
0.0410 |
0.0539 |
|
1.0 |
0.0474 |
0.0732 |
0.0989 |
|
1.5 |
0.0667 |
0.1053 |
0.1438 |
CONSTRUCTION MATERIAL SCIENCE cates were thoroughly mixed until homogeneous. Cement paste with W/C = 0.32–0.325 was made from such a complex binder and samples were moulded. After that samples were stored in a normal curing chamber. Determination of the chemical composition of the samples was carried out on the 1st, 3rd, 7th, 14th and 28th days of hardening. After the strength test, the samples were grinded, and then the hydration of the binder was stopped by microwave method.
RESULTS AND DISCUSSION
In the kinetic equation (6), the initial period of structure formation (the first term) is determined arbitrarily in accordance with the assumptions of the researcher. The limit is set by the parameters R 0 and t 0. The first term of formula (6) can be excluded under conditions:
R„JR«»L tj«. »1, (18)
this will actually lead to obtaining a version of formula (4). In this case, important information about the structure formation of the material will be excluded from the analysis: β and Di ,0. At the same time, the allocation of two stages of initial structure formation (the period of operation is a separate stage, which in essence can be considered as the third stage of the process of material structure formation) is natural for materials (or artificial stones):
-
• the setting stage, which is characterized by the duration t 0 and a mechanical property that describes the resistance of the emerging structure to external mechanical action;
-
• hardening stage, which is characterized by duration t s and material strength R ( ts ).
To describe structure formation at the setting stage, it is advisable to use the mechanical value Rst , which characterizes the strength of the emerging structure, which is determined by the resistance force Fc . Experimentally, Rst is determined by the immersion depth h of an indenter having a mass m 0 and a cross-sectional area S .
In a state of equilibrium, the indenter immersed in the material (mixture) is subject to the forces of gravity Fg , resistance and the Archimedes force FA :
fe4f.+fa)=o . (19)
It is assumed that the change in the surface level of the mixture when the indenter is immersed in it can be neglected, that is, Vsm / Vin >> 1 (here Vsm is the volume of the mixture; Vin is the volume of the indenter immersed in the mixture).
After substituting F g = m 0 g and FA = Shρlg , and transforming with respect to Fc , we get:
R^=gpl>-h^ , (20)
ρl is mixture density; g is acceleration of gravity.
It follows from formula (20) that the kinetics of structure formation at the setting stage can be estimated from the depth of immersion of the indenter into the material mixture h ( t ):
at h(0) = m0/Sρl, the strength of the structure will be Rst(0) = 0, at h(t0) = 0 the strength of the structure is maximum Rst(t0) = gm0/S.
When obtaining the parameters of equation (12), the main difficulty is the establishment of the integration constant c 0, which affects the values of the parameters φ and β . To eliminate the difficulties associated with c 0, it is expedient to obtain the parameters φ and β as follows. According to the experimental data H ( t ) = f ( t ) (here H ( t ) = H 0 – h ( t ); H 0 is the depth of the container in which the mixture under study is located), the parameters of the equation are determined:
H^ = aexpQ)t) , (21)
-
a , b are empirical coefficients.
Also, using the indicated experimental data, the Hurst exponent (parameter β ) is determined according to the method presented in [51–53]. Next, the value of the coefficient b is refined in the equation of the form:
H(t)= ciexp^t^ . (22)
It is important to note that the parameter bn in equation (22) is equal to the parameter φ of equation (12).
Table 3
Average particle diameter, nm
|
α s |
Concentration Fe(OH)3, % |
||
|
0.3 |
0.5 |
0.7 |
|
|
0.5 |
13.3 |
12.9 |
14.7 |
|
1.0 |
11.3 |
15.8 |
21.0 |
|
1.5 |
13.1 |
20.8 |
29.7 |
CONSTRUCTION MATERIAL SCIENCE
Thus, the values of the parameters characterizing the kinetics φ and the density β (internal dimension Di ,0) of the emerging structure can be determined without setting the value of the parameter c 0.
Selection of the setting stage of the stage of initial structure formation is important not only for assessing the influence of various prescription or technological factors (that is, to develop technological solutions for obtaining material with the necessary set of operational properties), but also for predicting the quality of the material structure (strength), which naturally affects the rate of destructive processes during its operation. In this case, scientifically substantiated answers to the following questions should be obtained:
-
• Does the rate of the process of structure formation, which is estimated by the coefficient φ , affect the density of the structure, characterized by the value Di ,0 or β ?
-
• Do the parameters φ and β affect the strength of the material?
-
• What effect do t 0 and ks have on the strength of the material?
-
• How do φ and β affect t 0?
-
• Which of the parameters α (or φ ) and Di (or β ) has a dominant influence on the strength of the material?
-
• Are the parameters α and n (or Di ) interrelated?
-
• Which process describes the parameter n (or β ): persistent or anti-persistent?
-
• Is it possible to predict strength by α (or φ ) and Di (or β )?
In the presented formulation, any prescription and technological factors will be described by the parameters α (or φ ) and n (or β ). The fulfillment of this statement will confirm the presence of a fundamental relationship between the parameters of the structure and the rate of its formation, as well as the relationship between the parameters of the structure and its strength (structure quality).
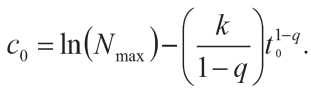
Typical kinetic dependences of the structure formation of cement materials at the setting stage and at the hardening stage are shown in Fig. 1.
The parameters of equations (8) and (12), obtained from the results of processing experimental data, are presented in Table 4.
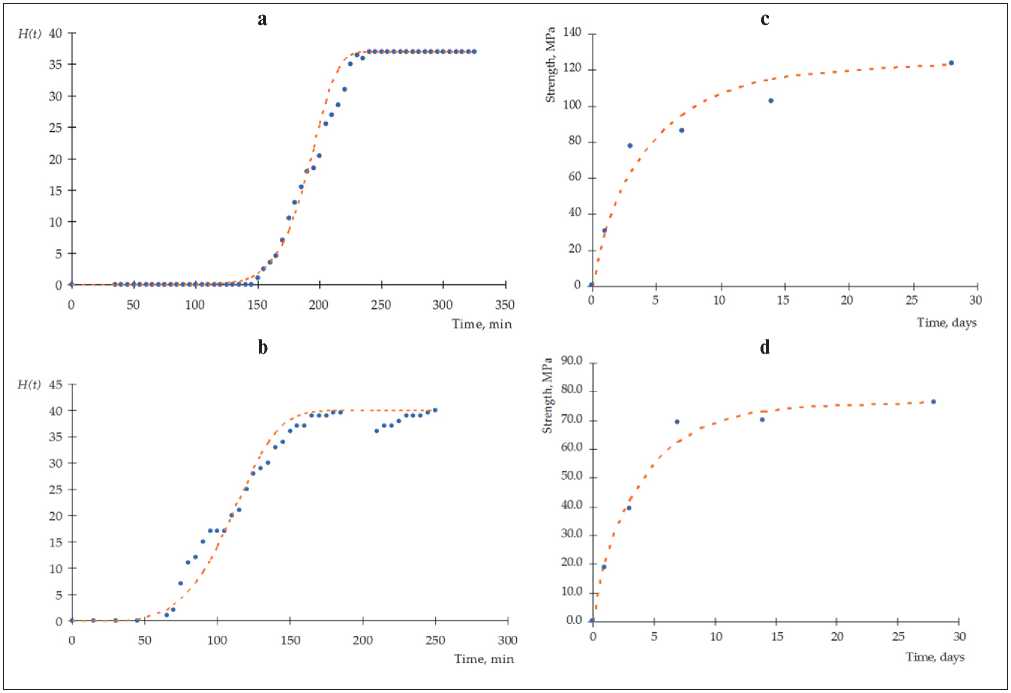
Fig. 1. Experimental kinetic dependences of the structure formation of cement materials : (a) and (b) for setting stage; (c) and (d) for curing stage; (a) and (c) in the presence of S3 plasticizer; (b) and (d) in the presence of microsized particles of zinc hydrosilicates
CONSTRUCTION MATERIAL SCIENCE
Table 4
The results of processing experimental data obtained at the stage of setting of cement materials
|
No |
Concentration (%) / composition of additive |
Empirical Coefficients H ( t ) = a exp( bt ) |
t 0,s1, min |
Equation Options* H ( t ) = a exp( φtβ ) |
D i ,0 |
k s |
R 28, (MPa) |
||
|
a |
b |
φ |
β |
||||||
|
Plasticizer variation |
|||||||||
|
1 |
Control composition |
2.00•10–4 |
0.065 |
185 |
0.132 |
0.862 |
2.72 |
0.114 |
124.5 |
|
Plasticizer Melflux 2651F |
|||||||||
|
2 |
0.10 |
2.00•10–4 |
0.054 |
230 |
0.112 |
0.865 |
2.73 |
0.097 |
121.2 |
|
3 |
0.25 |
2.64•10–2 |
0.022 |
320 |
0.034 |
0.924 |
2.85 |
0.031 |
128.0 |
|
4 |
0.40 |
1.00•10–5 |
0.889 |
17 |
1.433 |
0.835 |
2.67 |
1.196 |
110.6 |
|
5 |
0.50 |
1.00•10–6 |
0.815 |
20 |
1.396 |
0.821 |
2.64 |
1.146 |
118.0 |
|
6 |
1.00 |
2.33•10–1 |
0.024 |
215 |
0.030 |
0.963 |
2.93 |
0.028 |
112.3 |
|
Plasticizer S3 |
|||||||||
|
7 |
0.25 |
5.40•10–3 |
0.041 |
225 |
0.069 |
0.902 |
2.80 |
0.062 |
98.6 |
|
8 |
0.50 |
6.00•10–4 |
0.045 |
245 |
0.088 |
0.875 |
2.75 |
0.077 |
102.5 |
|
9 |
0.75 |
6.00•10–4 |
0.038 |
295 |
0.075 |
0.873 |
2.75 |
0.066 |
106.9 |
|
10 |
1.00 |
4.68•10–2 |
0.018 |
340 |
0.026 |
0.936 |
2.87 |
0.025 |
109.9 |
|
11 |
2.00 |
3.58•10–1 |
0.013 |
375 |
0.016 |
0.968 |
2.94 |
0.015 |
108.7 |
|
Plasticizer Melment F15G |
|||||||||
|
12 |
0.50 |
1.00•10–4 |
0.744 |
17 |
1.116 |
0.855 |
2.71 |
0.955 |
123.7 |
|
13 |
0.75 |
5.00•10–7 |
0.670 |
27 |
1.255 |
0.809 |
2.62 |
1.016 |
118.0 |
|
14 |
1.00 |
1.00•10–6 |
0.596 |
29 |
1.124 |
0.812 |
2.62 |
0.913 |
105.5 |
|
15 |
1.25 |
8.00•10–8 |
0.919 |
22 |
1.730 |
0.795 |
2.59 |
1.375 |
103.2 |
|
16 |
1.50 |
1.00•10–7 |
0.738 |
27 |
1.429 |
0.799 |
2.60 |
1.142 |
100.0 |
|
Variation of microsized particles of metal hydrosilicates |
|||||||||
|
17 |
Control composition |
2.00•10–4 |
0.067 |
167 |
0.127 |
0.873 |
2.75 |
0.111 |
72.0 |
|
Microsized particles of copper hydrosilicates + 10% particles of barium hydrosilicates |
|||||||||
|
18 |
0.25 |
9.00•10–4 |
0.048 |
180 |
0.079 |
0.904 |
2.81 |
0.071 |
69.5 |
|
19 |
0.50 |
2.00•10–3 |
0.054 |
205 |
0.087 |
0.906 |
2.81 |
0.079 |
70.1 |
|
20 |
0.75 |
3.00•10–14 |
0.195 |
170 |
0.752 |
0.734 |
2.47 |
0.552 |
49.6 |
|
21 |
1.00 |
1.00•10–4 |
0.026 |
415 |
0.071 |
0.831 |
2.66 |
0.059 |
43.7 |
|
Microsized zinc hydrosilicate particles + 10% barium hydrosilicate particles |
|||||||||
|
22 |
0.50 |
4.00•10–6 |
0.139 |
100 |
0.281 |
0.843 |
2.69 |
0.237 |
80.5 |
|
23 |
1.00 |
3.00•10–4 |
0.139 |
70 |
0.218 |
0.891 |
2.78 |
0.195 |
76.1 |
|
24 |
2.00 |
8.00•10–5 |
0.064 |
170 |
0.120 |
0.876 |
2.75 |
0.105 |
78.2 |
|
25 |
3.00 |
1.00•10–10 |
0.152 |
165 |
0.501 |
0.764 |
2.53 |
0.383 |
78.0 |
|
26 |
4.00 |
8.00•10–9 |
0.142 |
150 |
0.413 |
0.786 |
2.57 |
0.325 |
81.4 |
|
27 |
5.00 |
2.00•10–5 |
0.169 |
80 |
0.328 |
0.848 |
2.70 |
0.278 |
44.1 |
|
28 |
6.00 |
7.00•10–8 |
0.016 |
120 |
0.040 |
0.801 |
2.60 |
0.032 |
44.9 |
|
Microsized particles of iron hydrosilicates + 10% particles of barium hydrosilicates |
|||||||||
|
29 |
1.00 |
7.00•10–6 |
0.240 |
60 |
0.387 |
0.839 |
2.68 |
0.325 |
65.9 |
|
30 |
2.00 |
1.00•10–5 |
0.190 |
75 |
0.381 |
0.839 |
2.68 |
0.320 |
52.7 |
CONSTRUCTION MATERIAL SCIENCE
|
31 |
3.00 |
2.00•10–6 |
0.240 |
65 |
0.490 |
0.828 |
2.66 |
0.406 |
54.6 |
|
32 |
5.00 |
1.20•10–3 |
0.194 |
50 |
0.296 |
0.892 |
2.78 |
0.264 |
52.4 |
|
Nano-sized particles of zinc hydrosilicates + 10% micro-sized particles of barium hydrosilicates |
|||||||||
|
33 |
С(Fe(OH)3) = 0.3% |
α =0.5 s |
4.00•10–4 |
0.066 |
135 |
0.108 |
0.899 |
2.80 |
0.097 |
|
34 |
α =1.0 s |
7.00•10–4 |
0.084 |
110 |
0.136 |
0.896 |
2.79 |
0.122 |
|
|
35 |
α =1.5 s |
2.00•10–5 |
0.090 |
150 |
0.193 |
0.849 |
2.70 |
0.164 |
|
|
36 |
С(Fe(OH)3) = 0.5% |
α =0.5 s |
4.00•10–11 |
0.179 |
145 |
0.584 |
0.763 |
2.53 |
0.445 |
|
37 |
α =1.0 s |
3.00•10–3 |
0.088 |
80 |
0.120 |
0.930 |
2.86 |
0.111 |
|
|
38 |
α =1.5 s |
2.00•10–4 |
0.127 |
85 |
0.215 |
0.880 |
2.76 |
0.190 |
|
|
39 |
С(Fe(OH)3) = 0.7% |
α =0.5 s |
8.00•10–4 |
0.110 |
75 |
0.163 |
0.909 |
2.82 |
0.148 |
|
40 |
α =1.0 s |
1.00•10–4 |
0.165 |
70 |
0.293 |
0.865 |
2.73 |
0.253 |
|
|
41 |
α =1.5 s |
4.00•10–4 |
0.163 |
65 |
0.266 |
0.882 |
2.76 |
0.234 |
|
|
Nano-sized particles of zinc hydrosilicates + 10% micro-sized particles of barium hydrosilicates |
|||||||||
|
42 |
С(Fe(OH)3) = 0.3% |
α =0.5 s |
1.00•10–4 |
0.102 |
110 |
0.187 |
0.869 |
2.74 |
0.163 |
|
43 |
α =1.0 s |
6.00•10–6 |
0.139 |
95 |
0.278 |
0.847 |
2.69 |
0.235 |
|
|
44 |
α =1.5 s |
7.00•10–4 |
0.097 |
95 |
0.157 |
0.893 |
2.79 |
0.141 |
|
|
45 |
С(Fe(OH)3) = 0.5% |
α =0.5 s |
6.00•10–4 |
0.097 |
95 |
0.153 |
0.898 |
2.80 |
0.138 |
|
46 |
α =1.0 s |
2.00•10–5 |
0.179 |
70 |
0.330 |
0.856 |
2.71 |
0.282 |
|
|
47 |
α =1.5 s |
6.00•10–4 |
0.125 |
75 |
0.198 |
0.892 |
2.78 |
0.177 |
|
|
48 |
С(Fe(OH)3) = 0.7% |
α =0.5 s |
2.60•10–3 |
0.125 |
70 |
0.186 |
0.905 |
2.81 |
0.168 |
|
49 |
α =1.0 s |
1.00•10–3 |
0.124 |
75 |
0.192 |
0.897 |
2.79 |
0.172 |
|
|
50 |
α =1.5 s |
5.00•10–5 |
0.179 |
65 |
0.313 |
0.865 |
2.73 |
0.271 |
|
Notes: «Control» ‒ control composition; «MF» ‒ plasticizer Melflux 2651F ; «S3» ‒ plasticizer S3; «MM» ‒ plasticizer Melment F15G; С ‒ concentration, % by weight of Portland cement ; t 0,s1 ‒ completion time of the first stage of structure formation according to the formula (12); Di 0 ‒ internal dimension at the first stage of structure formation ; ks ‒ system development constant (formula (16)); R 28 ‒ compressive strength of cement stone after 28 days of normal hardening ; * ‒ analogue of the formula (12).
The analysis of the experimental data will done according to the distinguished two stages of initial structure formation. The first stage (setting stage) is considered in this paper.
As noted earlier, the experimental data for this stage have some features:
According to the method for determining the strength Rst ( t ) (formula (20)) the nature of the change in the dependence H ( t ) = f ( t ) has an S-shaped form. This indicates the achievement of maximum strength at a certain point in time. That is, it can be determined using the specified method Rst ( t 0) = max. Therefore, for t ≥ t 0, the immersion depth h ( t ) = min.
To establish patterns of structure formation in the initial period (from t ≥ 0), equation (12) is applicable. At the same time, the deviation from the exponential law indicates the occurrence of spatial and other difficulties for the formation of the structure. Such a deviation occurs at the time t = t 0,s1.
As a rule, several successive stages, which are described by exponential dependencies can be distinguished on the S-shaped dependencies H ( t ) = f ( t ) (Figure 2).
An analysis of the obtained S-shaped dependences shows that the intensity and duration of the stages of structure formation naturally decrease in the process of formation of the material structure. Naturally, this is due to spatial and resource constraints, the influence of which increases over time.
Analysis of the results of processing experimental data (table 4) shows the values of the parameter β > 0.5, which indicates the persistent nature of structure formation or the presence of a stable development trend.
Two isolated data clusters can be identified in the dependences β = f ( φ ) shown in Figure 3. Moreover, the power of the clusters is different: a smaller cluster is represented mainly by data for the plasticizer Melment F15G and separate data for Melflux 2651F (only at 0.4 and 0.5% by weight of Portland cement); the rest of the data (for 43 compositions) make up the main cluster (Figure 4).
Such an effect of the plasticizer is clearly displayed in the dynamics of changes in the parameters φ and β (Figure 5). The periodic nature of the change in the param-
CONSTRUCTION MATERIAL SCIENCE
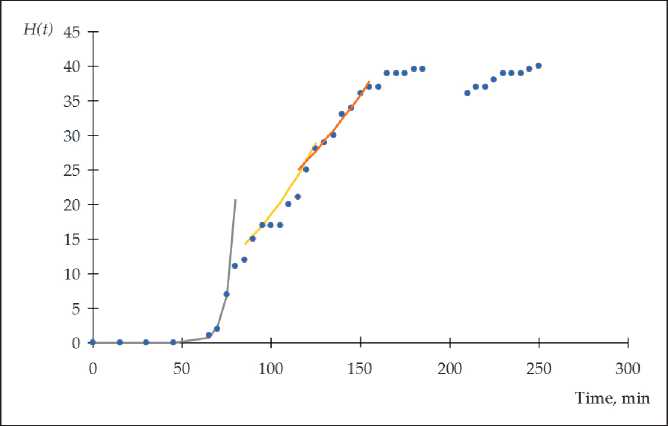
Fig. 2. The presence of multi-stage structure formation of cement materials at the stage of setting
Fig. 3. Dependence β = f ( φ ) (50 compositions according to table 4)
eters φ and β is observed for all plasticizers with a change in their concentrations. A positive trend in the change in the parameter φ is observed for the plasticizer Melment F15G. That is, the rate of structure formation is increased. But the negative trend for parameter β indicates the formation of a less dense structure for composition with the plasticizer Melment F15G. The opposite to Melment F15G for parameters φ and β is observed for plasticizer S3. It is important to note that the values of φ for S3 are on average the smallest. For the plasticizer Melflux 2651F, it is difficult to identify a trend. However, the φ values for the specified plasticizer are high, especially for concentrations of 0.4 and 0.5% by weight of Portland cement.
The interdependencies of the considered factors are presented in the correlation Table 5.
From Table 5 it follows that, in accordance with the Chaddock scale [56], there is no relationship ( r < 0,1) or a moderate relationship ( r < 0,5) between most of the analyzed factors. A significant value of the correlation coefficient is observed for the parameters φ and β of the equation H ( t ) = a exp( φt β ). Moreover, the correlation of the coefficients is high (0.7 < r < 0.9) for the main data cluster, in accordance with the Chaddock scale. The sign of the correlation coefficient indicates that the density of the material structure decreases (a decrease in the coefficient β ) at an increase in the rate of structure formation (an increase in the coefficient φ ). In addition, for the main data cluster, the relationship between the period of initial structure formation t 0,s1 and the strength of the material R 28 is noticeable (according to Chaddock
CONSTRUCTION MATERIAL SCIENCE
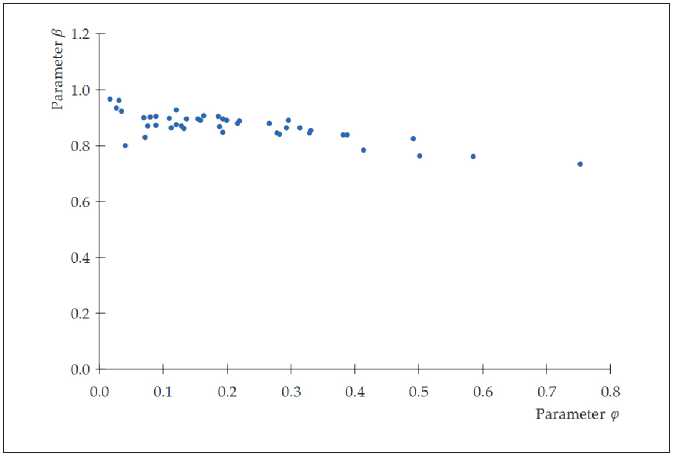
Fig. 4. Dependence β = f ( φ ) (43 compositions according to table 4; compositions No. 4; 5; 12–16 are excluded)
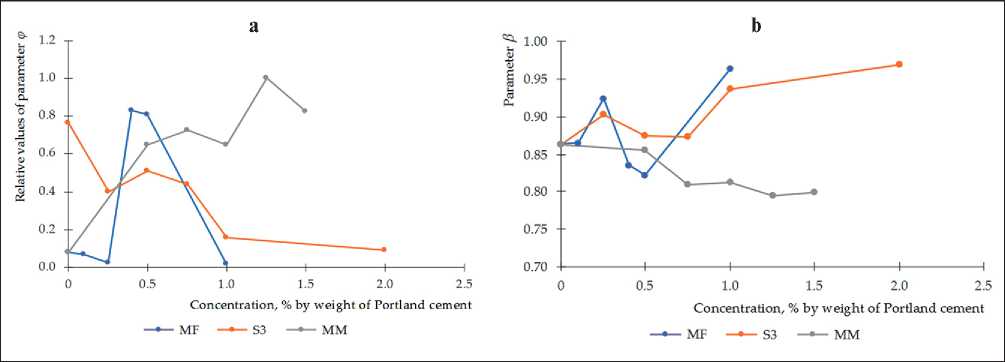
Fig. 5. Influence of the type and concentration of plasticizers on the parameters of structure formation: parameter φ (the relative values of the parameter φ are increased by an order of magnitude for clarity) (a); parameter β (b).
(0.5 < r < 0.7)). Moreover, the positive sign of the correlation coefficient indicates that an increase in the period t 0,s1
leads to an increase in the strength of R 28.
Accounting for the second data cluster (Fig. 3) leads to a decrease in the value of the correlation coefficient between the parameters φ and β : from 0.781 to 0.602.
Table 5
Correlation table
|
Values of correlation coefficients r (for 50 compositions of Table 5) |
||||||
|
φ | β |
φ | R 28 |
β | R 28 |
k s | R 28 |
t 0,s1 | R 28 |
φ | t 0,s1 |
β | t 0,s1 |
|
–0.602 |
0.36 |
0.05 |
0.36 |
0.237 |
–0.562 |
0.316 |
|
Values of correlation coefficients r (for 43 compositions of Table 5) |
||||||
|
–0.781 |
–0.40 |
0.30 |
–0.43 |
0.637 |
–0.458 |
0.184 |
CONSTRUCTION MATERIAL SCIENCE
In addition, there is a change in the direction of the relationships between the parameter φ and R 28, as well as between ks and R 28. This indicates that conditions accelerating the process of structure formation of cement stone with high strength occur for Melment F15G and Melflux 2651F plasticizers at concentrations of 0.4 and 0.5 % by weight of Portland cement. This is possible when the structures are formed with significantly different parameters.
Thus, an increase in the rate of structure formation (parameter φ ) leads to the formation of a less dense structure (parameter β ), which is characterized by a lower strength of the cement stone. In addition, an increase in the duration of the initial structure formation (period t 0,s1) leads to an increase in the strength of R 28. The parameter ks is not a tool for qualitative analysis of the structure formation of cement stone.
CONCLUSIONS
Thus, the methods for determining the parameters of equations describing the kinetics of structure formation of cement composites, including modified by various compounds, have been refined. The essence of the refinement is to consider the kinetics of structure formation as a time
series, the development of which can be described by the dependence proposed by Hurst. After determining the Hurst exponent, the coefficient characterizing the rate of structure formation is refined.
In the structure formation of cement composites, it is proposed to distinguish two stages: the stage of setting the cement paste and the stage of hardening. The selection of the setting stage is connected with the natural laws of the development of natural systems, namely, the initial formation of a structural grid obeys an exponential law. Moment of time when a deviation from this law is observed is the time of occurrence of spatial and/or prescription difficulties that hinder the exponential development of the system. A strong negative relationship between the parameters φ and β of the equation H ( t ) = a exp( φt β ) has been established. These parameters characterize the rate of structure formation at the setting stage (parameter φ ) and the density of the structure (parameter β or the internal dimension Di, 0 associated with it). The presence of such a negative relationship indicates the inadvisability of accelerating the processes of structure formation at the stage of setting. This is supported by a strong positive relationship between the period of initial structure formation t 0,s1 and the strength of the material R 28.
References Study of the kinetics structure formation of cement dispersed systems. Part I
- Ramezani M., Kim Y.H., Sun Z.. Mechanical properties of carbon nanotube reinforced cementitious materials: database and statistical analysis. Magazine of Concrete Research. 2019; 72: 1047–1071. Available from: https://doi.org/10.1680/jmacr.19.00093.
- Ahmed H., Bogas J.A., Guedes M., Pereira M.F.C.. Dispersion and reinforcement efficiency of carbon nanotubes in cementitious composites. Magazine of Concrete Research. 2018; 71(8): 408–423. Available from: https://doi.org/10.1680/jmacr.17.00562.
- Dai J., Wang Q., Xie Ch., Xue Y., Duan Y., Cui X.. The Effect of fineness on the hydration activity index of ground granulated blast furnace slag. Materials. 2019; 12 (18): 2984. Available from: https://doi.org/10.3390/ma12182984.
- Joel S. Compressive strength of concrete using fly ash and rice husk ash: a review. Civil Engineering Journal. 2020; 7: 1400–1410. Available from:https://doi.org/10.28991/cej-2020-03091556.
- Inozemtcev A.S., Korolev E.V., Duong T.Q. Study of mineral additives for cement materials for 3D-printing in construction. IOP Conference Series: Materials Science and Engineering. 2018; 365: 032009. Available from: https://doi.org/10.1088/1757-899X/365/3/032009.
- Lee S. Mechanical properties and durability of mortars made with organic-inorganic repair material. Journal of Testing and Evaluation. 2021; 49: JTE20200024.
- Aksenova V.V., Alimbaev S.A., Pavlov A.V., Mustafin R.M. Briquetting of Porous Alumina-Containing Materials Using Organic Binders. Steel in Translation. 2021; 51: 291–295.
- Wang X., Peng Z., Wu Z., Sun S. High-performance composite bridge deck with prestressed basalt fiber-reinforced polymer shell and concrete. Engineering Structures. 2011; 201: 109852.
- Shi C., Liu H., Wang J., Yang M., Zhao J., Zhang L. et al. Vermiculite aerogels assembled from nanosheets via metal ion induced fast gelation. Applied Clay Science. 2022; 2181: 106431. Available from: https://doi.org/10.1016/j.clay.2022.106431.
- Shepovalova O.V. Mandatory characteristics and parameters of photoelectric systems, arrays and modules and methods of their determining. Energy Procedia. 2019; 157: 1434–1444.
- Chen M., Li L., Cheng X. Rheological and mechanical properties of admixtures modified 3D printing sulphoaluminatecementitious materials. Construction and Building Materials. 2018; 189: 601–611. Available from: https://doi.org/10.1016/j.egypro.2018.11.308.
- Kim M., Kim T., Kim H. Rheological analysis of physical states of cellulose nanocrystal suspension and synergetic effect of aligned gel state. Carbohydrate Polymers. 2022; 28415: 119170. Available from: https://doi.org/10.1016/j.carbpol.2022.119170.
- Zhai Y., Tang Y., Li J., Duan L, Su C, Cao A. et al. Structure, Raman spectra and properties of two low-εr microwave dielectric ceramics Ca3B2Ge3O12 (B = Al, Ga). Ceramics International. 2020; 46: 28710–2871515. Available from: https://doi.org/10.1016/j.ceramint.2020.08.031.
- Zhang H., He L., Li G. Bond failure performances between near-surface mounted FRP bars and concrete for flexural strengthening concrete structures. Engineering Failure Analysis. 2015; 56: 39–50. Available from: https://doi.org/10.1016/j.engfailanal.2015.04.018.
- Shi Y., Wu G., Chen S.-C., Song F., Wang Y.-Z. Green Fabrication of High-Performance Chitin Nanowhiskers/PVA Composite Films with a “brick-and-Mortar” Structure. ACS Sustainable Chemistry and Engineering. 2020; 8: 17807–178157. Available from: https://doi.org/10.1021/acssuschemeng.0c06736.
- Maksimova I., Makridin N., Erofeev V., Barabanov D. Study of the properties of water-hardened cement stone depending on the water-cement ratio and age. Proceedings of EECE 2020. 2021; 192–203.
- Maksimova I.N., Makridin N.I., Tambovtseva E.A., Erofeev V.T. Regression dependencies of the main properties of cement stone with a change in its structure and age. Regional architecture and construction. 2015; 2: 37–44.
- Erofeev V.T., Makridin N.I., Maksimova I.N. Kinetic parameters and governing equations of structure formation and hardening of cement stone of different structure in the time interval up to 18 years after steaming. News of universities – Construction. 2019; 3: 5–19.
- Makridin N.I., Tarakanov O.V., Maksimova I.N., Surov I.A. The time factor in the formation of the phase composition of the cement stone structure. Regional architecture and construction. 2013; 2: 26–31.
- Maksimova I.N., Makridin N.I., Polubarova Yu.V., Erofeev V.T. Comprehensive assessment of the kinetic parameters of the structural strength of cement stone in the time range from 28 days to 4.5 years after steaming. Regional architecture and construction. 2018; 3: 23–30.
- Maksimova I.N., Erofeev V.T., Makridin N.I. Kinetic parameters of hydration structure formation and hardening of cement stone up to 9.5 years old after steaming. News of universities. Construction. 2018; 3: 24–33.
- Maksimova I.N., Makridin N.I., Korolev E.V. Comparative analysis of kinetic dependencies at early and late stages of structure formation processes of structural strength of cement composites. Regional architecture and construction. 2018; 2: 5–12.
- Sokolova Yu.A., Koroleva O.V., Korolev E.V. Radiation-protective sulfur concretes of frame structure. Moscow: Paleotype; 2009.
- Makridin N.I., Maksimova I.N., Korolev E.V. Acoustic emission method. Building Materials: Science. 2007; 9: 25–27.
- Korolev E.V., Evstifeeva I.Yu., Makridin N.I., Egorev S.I. Limit states of the structure of sulfur composites. Building Materials: Science. 2007; 7: 61–63.
- Bazhenov Yu.M., Korolev E.V., Evstifeeva I.Yu., Vasilyeva O.G. Nano-modified corrosion-resistant sulfur building materials. Moscow: RGAU-MSHA named after K.A. Timiryazev; 2008.
- Korolev E.V., Kiselev D.G., Smirnov V.A. Destruction kinetics of nanomodified sulfur composites. Nanotechnologies in construction: scientific online journal. 2013; 6: 31–43.
- Makridin N.I., Maksimova I.N., Korolev E.V. Structure formation and structural strength of cement composites. Moscow: MGSU; 2013.
- Proshin A.P., Bozhev N.V., Fokin G.A., Smirnov V.A. Acoustic-emission study of the destruction of radiationprotective composite materials. News of higher educational institutions. Construction. 2004; 1: 20–23.
- Fokin G.A. Acoustics in construction. Penza: PGUAS; 2006.
- Smirnov V.A., Kruglova A.N. Applications of the acoustic emission method to the study of composite materials for special purposes. In the world of scientific discoveries. 2010; 415: 63.
- Vernigorova V.N. Physicochemical basis for the formation of modified calcium hydrosilicates in composite materials based on the CaO–SiO2–H2O System. – Penza: PGUAS, 2001. – 394 p.
- Volzhensky A.V., Burov Yu.S., Kolokolnikov V.S. Mineral binders. Moscow: Stroyizdat; 1979.
- Pospelova E.A., Rakhimbaev Sh.M. Analysis of the processes of production and use of building materials based on the theory of transfer. Belgorod: BGTU im. V.G. Shukhov; 2019.
- Bobryshev A.N., Erofeev V.T., Kozomazov V.N. Physics and synergetics of dispersed-disordered condensed composite systems. Saint Petersburg: Science; 2012.
- Bobryshev A.N., Kozomazov V.N., Lakhno A.V., Tuchkov V.V. Strength and durability of polymer composite materials. Lipetsk: Ulis; 2006.
- Bobryshev A.N., Kozomazov V.N., Avdeev R.I., Tumanova N.N. Topological features of kinetic processes. Condensed media and interfaces. 2003; 5: 120–125.
- Avdeev R.I., Bobryshev A.N., Tumanova N.N. Models of evolutionary processes with linear mapping. News of the Tula State University. Series: Technology, mechanics and durability of building materials, structures and structures. 2001; 2: 45–49.
- Voronov P.V., Bobryshev A.N., Lakhno A.V. Estimation of the kinetics of phase transitions in hardening heterogeneous materials. Regional architecture and construction. 2010; 2: 58–66.
- Kalush Yu.A., Loginov V.M. Hurst exponent and its hidden properties. Siberian Journal of Industrial Mathematics. 2002; 5: 29–37.
- Zhirmunsky A.V., Kuzmin V.I. Critical levels in the development of natural systems. Leningrad: Science; 1990.
- Modern encyclopedic dictionary. Moscow: Great Russian Encyclopedia; 1997.
- New Illustrated Encyclopedic Dictionary. Moscow: Great Russian Encyclopedia; 2005.
- Evtushenko E.I. Activation processes in building materials technology. Belgorod: BGTU im. V.G. Shukhov; 2003.
- Bazueva SA, Mikhailov AA. Analysis of the problem of identification of the law of distribution of random processes. Don Engineering Gazette. 2015; 3: 27.
- Bazhenov Yu.M., Garkina I.A., Danilov A.M., Korolev E.V. System analysis in building materials science. Moscow: MGSU; 2012.
- Danilov A.M., Korolev E.V., Garkina I.A. Building materials as systems. Building Materials. 2006; 7: 55–57.
- Danilov A.M., Garkina I.A. Development of building materials as complex systems. Regional architecture and construction. 2016; 2: 50–54.
- Garkina I.A., Danilov A.M. Methods of system analysis in the design of composites. Regional architecture and construction. 2020; 1: 63–68.
- Kirichenko L., Radilova T. Estimation of the self-similarity parameter for stationary stochastic processes. International Journal Information Content and Processing. 2008; 5: 41–71.
- Porshnev S.V., Solomakha E.V., Ponomareva O.A. On the peculiarities of estimates of the hurst exponent of classical brownian motion calculated using the R/S-analysis method. International Journal of Open Information Technologies. 2020; 8: 45–50.
- Aleksandrovich S.V. R/S – analysis of temperature time series. Innovation and investment. 2020; 2: 119–122.
- Ovsyannikov V.E., Nekrasov R.Yu., Teploukhov O.Yu., Kokorin I.N. Application of fractal models to study the cyclic strength of metallic materials. Don Engineering Gazette. 2020; 2: 42.
