Study of the kinetics structure formation of cement dispersed systems. Part II

Author: Evgenij V. Korolev, Anna N. Grishina, Aleksandr S. Inozemtcev, Arkady M. Ayzenshtadt
Journal: Nanotechnologies in Construction: A Scientific Internet-Journal @nanobuild-en
Section: Construction materials science
Article in issue: 4 Vol.14, 2022.
Free access
Introduction. The study of the kinetics structure formation is rarely the subject of a careful study. Although it is important for materials used to create elements of building structures, energy elements, thermoelements and materials for other purposes. The article proposes refinements of the methodology for determining the parameters of the kinetics structure formation of cement composites, including modified compositions. Methods and materials. The structure formation of cement systems with plasticizers, microsized mineral additives (hydrosilicates of barium, copper, iron and zinc) and nanosized particles of zinc hydrosilicates has been studied. Results and discussion. It is proposed to single out two stages of initial structure formation: the stage of setting the cement paste and the stage of hardening. It was found that the strength of the material at the stage of hardening should be influenced by an additional factor, depending on the type of the introduced substance. A strong negative relationship between the parameters α and n of the equation R(t) = Rmax(1–eatn) at the hardening stage was confirmed. The trends identified at the setting stage also demonstrated, namely: an increase in the rate of structure formation leading to the formation of a less dense structure. Conclusions. An analysis of the change in the value of the internal dimension of the system during the transition from the stage of setting to the stage of hardening made it possible to identify two trajectories of the system development. The first trajectory appears only by combining the elements of the structure (trajectory No. 1). Preservation of the characteristic dimensions of structural elements, but an increase in the proportion of elements with small dimensions (when the conditions that prevent the combination of elements of the structure are realized) describes the second trajectory (trajectory No. 2). The implementation of trajectory No. 2 is typical for compositions which the structure formation of cement stone is carried out in the presence of Melment F15G plasticizer or microsized particles of copper or zinc. For other studied compositions, structure formation is proceeding with the enlargement of structural elements.
Cement binder, cement hydration, structure formation, plasticizer, hydrosilicate
Short address: https://sciup.org/142234626
IDR: 142234626 | DOI: 10.15828/2075-8545-2022-14-4-263-273
Text of the scientific article Study of the kinetics structure formation of cement dispersed systems. Part II
Original article
Strength characteristics are important for building materials for various purposes. High requirements for these indicators are imposed on composites based on mineral and organic binders, on structural products manufactured in a monolithic, prefabricated or extrusion method [1–5]. In this case, the key factor is the chemical composition of the formed substances, which affects the strength of an individual bond in the structure. [6, 7]. The task of establishing the relationship between the number of crystallization centers, the chemical composition of
CONSTRUCTION MATERIAL SCIENCE the composite, the rate of formation of bonds between individual elements and the strength of the composite is of interest for mineral systems.
Early, the refinements of the methodology for determining the parameters of the kinetics structure formation of cement composites, including modified compositions, are proposed in the article [8]. The essence of the refinement is to consider the kinetics of structure formation as a time series, the development of which can be described by the dependence proposed by Hurst. After determining the Hurst exponent, the coefficient characterizing the rate of structure formation is refined.
It is proposed to single out two stages of initial structure formation: the stage of setting the cement paste and the stage of hardening. The selection of the setting stage is connected with the natural laws of the development of natural systems, namely, the initial formation of a structural grid obeys an exponential law. Moment of time when a deviation from this law is observed is the time of occurrence of spatial and/or prescription difficulties that hinder the exponential development of the system. A strong negative relationship between the parameters φ and β of the equation H ( t ) = α exp( φtβ ) has been established. These parameters characterize the rate of structure formation at the setting stage (parameter φ ) and the density of the structure (parameter β or the internal dimension Di, 0 associated with it). The presence of such a negative relationship indicates the inadvisability of accelerating the processes of structure formation at the stage of setting. This is supported by a strong positive relationship between the period of initial structure formation t 0,s1 and the strength of the material R 28.
As shown earlier [9–13], the kinetic processes of structure formation obey the following equation:
y(t)=y (1 - e"t'), (1)
where ym is limiting value of the property characterizing the process of structure formation; α , n are coefficients. The coefficient α characterizes the rate of the process, and the coefficient n characterizes the geometric properties of the emerging structure.
The general equation of system development is an alternative to model (1) [7]:
• ( k )
x = Iv I x , (2)
V t q )
k is coefficient characterizing the rate of development of the system in time t ; q is constant; x is quantity characterizing the property of the system.
Equation (2) shows:
-
• the rate of change in the “size” of the system depends on its size;
-
• the coefficient k / tq , which characterizes the rate of increase in the size of the system, decreases with time.
When analyzing structure formation during the op-
erational period x in equation (2) will characterize the number of destroyed (destructured) bonds.
The solution of differential equation (2) has the following form:
In (N ) =
( k )
V 1 - q )
t 1 - -
+ c 0 ,
N is number of connections.
Let us consider the features of cement compositions at the second stage of initial structure formation (at the stage of hardening).
METHODS AND MATERIALS
For cement materials, effective technological methods for controlling their structure formation are:
-
• use of plasticizers;
-
• introduction of mineral additives;
-
• use of nanoscale additives.
The following plasticizers were used: S3 (0.25–2.0 % by weight of Portland cement), Melflux 2651F based on polycarboxylate esters (0.10–1.00 % by weight of Portland cement); Melment F15G based on sodium sulfomelamin formaldehyde (0.50–1.50 % by weight of Portland cement). The study of the effect of plasticizing additives on the processes of cement stone structure formation was carried out on Portland cement compositions with a constant W/C = 0.25.
Microsized particles of barium, copper, iron or zinc hydrosilicates were used as mineral additives. Nanosized particles of zinc hydrosilicates were used as nanosized additives. The influence of nanosized particles on the structure formation of the cement material was carried out in the presence of microsized particles of barium hydrosilicates, the content of which was constant and amounted to 10% by weight of Portland cement. To create a composite binder, microsized barium hydrosilicates were introduced into Portland cement in an amount of 10% by weight of cement, zinc hydrosilicates in an amount of 0.5, 1.0, 2.0, 3.0, 4.0, 5.0 and 6.0% , copper hydrosilicates in the amount of 0.25, 0.50, 0.75 and 1.00% or iron hydrosilicates in the amount of 1.0, 2.0, 3.0 and 5.0% by weight of cement. These modifiers were synthesized using the technology of hydrochemical synthesis from sodium hydrosilicates and aqueous solutions of salts (copper and barium chloride, as well as zinc and iron sulfate). For the synthesis of metal hydrosilicates, a solution of sodium hydrosilicates with silicate modulus M Si = 3,0; ω = 26,5% and salt solutions with concentrations С (ZnSO4) = 12%; С (СuCl2) = 15%; C (BaCl2) = 9,5%, C (Fe2(SO4)3) = 10,0% were used. The synthesis was carried out by adding a salt solution (ZnSO4, Fe2(SO4)3, CuCl2 or BaCl2) to a solution of sodium hydrosilicates at a ratio of MeO(Me2O3)/SiO2 = 1,0. The
CONSTRUCTION MATERIAL SCIENCE resulting precipitate was thoroughly washed by distilled water, dried at a temperature of 100–105oC and grinded. The average particle diameter of the obtained modifiers was 5–7 µm. The chemical composition of the modifying additive based on barium hydrosilicates additionally contains a small amount of barium carbonates formed during the carbonization of a barium salt as a result of mixing during synthesis. The modifying additive based on zinc hydrosilicates additionally contains a small amount of Zn4SO4(OH)6•хH2O. For the nanomodification of the binder nanosized zinc hydrosilicates produced according to the technology presented in [8] were used. Modifier have sedimentation stability [9]. The value of αs is the ratio of the concentration of sodium cations to the concentration of chloride anions during the synthesis of the nanomodifier. The gross formulas of the applied nanomodifiers are given in Table 1.
The concentrations of the used nanomodifiers are presented in Table 2.
The average particle size is presented in Table 3.
Cement, barium hydrosilicates in an amount of 10% by weight of cement, and zinc, iron or copper hydrosilicates were thoroughly mixed until homogeneous. Cement paste with W/C = 0.32–0.325 was made from such a complex binder and samples were moulded. After that samples were stored in a normal curing chamber. Determination of the chemical composition of the samples was carried out on the 1st, 3rd, 7th, 14th and 28th days of hardening. After the strength test, the samples were grinded, and then the hydration of the binder was stopped by microwave method.
RESULTS AND DISCUSSION
Typical kinetic dependences of the structure formation of cement materials at the setting stage and at the hardening stage are shown in Fig. 1.
The parameters of equations (1) and (2), obtained from the results of processing experimental data, are presented in Tables 4.
Table 1
Chemical brutto-formula of zinc hydrosilicates
|
α s |
Concentration Fe(OH)3, % |
||
|
0.3 |
0.5 |
0.7 |
|
|
0.5 |
ZnO•2.35SiO2•nH2O |
ZnO•3.92SiO2•nH2O |
ZnO•5.49SiO2•nH2O |
|
1.0 |
ZnO•4.70SiO2•nH2O |
ZnO•7.84SiO2•nH2O |
ZnO•10.97SiO2•nH2O |
|
1.5 |
ZnO•7.05SiO2•nH2O |
ZnO•11.76SiO2•nH2O |
ZnO•16.46SiO2•nH2O |
Table 2
Concentration of nanoscale zinc hydrosilicates, %
|
α s |
Concentration Fe(OH)3, % |
||
|
0.3 |
0.5 |
0.7 |
|
|
0.5 |
0.0282 |
0.0410 |
0.0539 |
|
1.0 |
0.0474 |
0.0732 |
0.0989 |
|
1.5 |
0.0667 |
0.1053 |
0.1438 |
Table 3
Average particle diameter, nm
|
α s |
Concentration Fe(OH)3, % |
||
|
0.3 |
0.5 |
0.7 |
|
|
0.5 |
13.3 |
12.9 |
14.7 |
|
1.0 |
11.3 |
15.8 |
21.0 |
|
1.5 |
13.1 |
20.8 |
29.7 |
CONSTRUCTION MATERIAL SCIENCE
Table 4
The results of processing experimental data obtained at the stage of hardening of cement materials
|
No |
Concentration (%) / composition of additive |
Equation Options R ( t ) = R max(1 – exp(– αtn ) |
D i |
r 1 (MPa) |
||
|
R max |
α |
N |
||||
|
1 |
2 |
3 |
4 |
5 |
6 |
7 |
|
Plasticizer variation |
||||||
|
1 |
Control composition |
124.5 |
0.565 |
0.740 |
2.48 |
168.3 |
|
Plasticizer Melflux 2651F |
||||||
|
2 |
0.10 |
121.2 |
0.535 |
0.736 |
2.47 |
164.6 |
|
3 |
0.25 |
128.0 |
0.543 |
0.753 |
2.51 |
169.9 |
|
4 |
0.40 |
110.6 |
0.614 |
0.742 |
2.48 |
149.1 |
|
5 |
0.50 |
118.0 |
0.579 |
0.757 |
2.51 |
155.9 |
|
6 |
1.00 |
121.2 |
0.535 |
0.736 |
2.47 |
164.6 |
|
Plasticizer S3 |
||||||
|
7 |
0.25 |
0.25 |
98.6 |
0.835 |
0.799 |
2.60 |
|
8 |
0.50 |
0.50 |
102.5 |
0.720 |
0.760 |
2.52 |
|
9 |
0.75 |
0.75 |
106.9 |
0.690 |
0.759 |
2.52 |
|
10 |
1.00 |
1.00 |
109.9 |
0.635 |
0.853 |
2.71 |
|
11 |
2.00 |
2.00 |
108.7 |
0.720 |
0.728 |
2.46 |
|
Plasticizer Melment F15G |
||||||
|
12 |
0.50 |
0.50 |
124.6 |
0.285 |
0.837 |
2.67 |
|
13 |
0.75 |
0.75 |
118.7 |
0.365 |
0.816 |
2.63 |
|
14 |
1.00 |
1.00 |
107.0 |
0.295 |
0.830 |
2.66 |
|
15 |
1.25 |
1.25 |
103.9 |
0.335 |
0.838 |
2.68 |
|
16 |
1.50 |
1.50 |
100.5 |
0.325 |
0.865 |
2.73 |
|
Variation of microsized particles of metal hydrosilicates |
||||||
|
17 |
Control composition |
72.0 |
0.935 |
0.776 |
2.551 |
92.8 |
|
Microsized particles of copper hydrosilicates + 10% particles of barium hydrosilicates |
||||||
|
18 |
0.25 |
69.9 |
0.248 |
0.905 |
2.81 |
77.2 |
|
19 |
0.50 |
71.5 |
0.176 |
0.955 |
2.91 |
74.9 |
|
20 |
0.75 |
50.0 |
0.271 |
0.901 |
2.80 |
55.5 |
|
21 |
1.00 |
44.3 |
0.267 |
0.901 |
2.80 |
49.1 |
|
Microsized zinc hydrosilicate particles + 10% barium hydrosilicate particles |
||||||
|
22 |
0.50 |
80.9 |
0.323 |
0.865 |
2.73 |
93.5 |
|
23 |
1.00 |
76.6 |
0.315 |
0.862 |
2.72 |
88.9 |
|
24 |
2.00 |
78.5 |
0.275 |
0.889 |
2.78 |
88.3 |
|
25 |
3.00 |
78.7 |
0.248 |
0.897 |
2.79 |
87.7 |
|
26 |
4.00 |
82.2 |
0.229 |
0.897 |
2.79 |
91.6 |
|
27 |
5.00 |
44.2 |
0.520 |
0.752 |
2.50 |
58.8 |
|
28 |
6.00 |
47.5 |
0.320 |
0.825 |
2.65 |
57.6 |
CONSTRUCTION MATERIAL SCIENCE
|
1 |
2 |
3 |
4 |
5 |
6 |
7 |
|
Microsized particles of iron hydrosilicates + 10% particles of barium hydrosilicates |
||||||
|
29 |
1.00 |
65.9 |
0.595 |
0.740 |
2.48 |
89.0 |
|
30 |
2.00 |
52.7 |
0.525 |
0.758 |
2.52 |
69.5 |
|
31 |
3.00 |
54.6 |
0.263 |
0.870 |
2.74 |
62.7 |
|
32 |
5.00 |
52.4 |
0.675 |
0.723 |
2.45 |
72.5 |
|
Nano-sized particles of zinc hydrosilicates + 10% micro-sized particles of barium hydrosilicates |
||||||
|
33 |
С(Fe(OH)3) = 0.3% |
α =0.5 s |
40.8 |
0.555 |
0.776 |
2.55 |
|
34 |
α =1.0 s |
47.7 |
0.421 |
0.821 |
2.64 |
|
|
35 |
α =1.5 s |
44.9 |
0.408 |
0.827 |
2.65 |
|
|
36 |
С(Fe(OH)3) = 0.5% |
α =0.5 s |
42.2 |
0.571 |
0.771 |
2.54 |
|
37 |
α =1.0 s |
49.2 |
0.388 |
0.835 |
2.67 |
|
|
38 |
α =1.5 s |
44.1 |
0.425 |
0.790 |
2.58 |
|
|
39 |
С(Fe(OH)3) = 0.7% |
α =0.5 s |
45.4 |
0.507 |
0.791 |
2.58 |
|
40 |
α =1.0 s |
53.9 |
0.371 |
0.844 |
2.69 |
|
|
41 |
α =1.5 s |
52.8 |
0.408 |
0.827 |
2.65 |
|
|
Nanosized zinc hydrosilicate particles + 10% microsized barium hydrosilicate particles + 2% microsized zinc hydrosilicate particles |
||||||
|
42 |
С(Fe(OH)3) = 0.3% |
α =0.5 s |
40.6 |
0.289 |
0.859 |
2.72 |
|
43 |
α =1.0 s |
68.2 |
0.361 |
0.832 |
2.66 |
|
|
44 |
α =1.5 s |
40.6 |
0.309 |
0.871 |
2.74 |
|
|
45 |
С(Fe(OH)3) = 0.5% |
α =0.5 s |
58.7 |
0.361 |
0.847 |
2.69 |
|
46 |
α =1.0 s |
52.7 |
0.424 |
0.821 |
2.64 |
|
|
47 |
α =1.5 s |
54.8 |
0.405 |
0.828 |
2.66 |
|
|
48 |
С(Fe(OH)3) = 0.7% |
α =0.5 s |
51.3 |
0.311 |
0.870 |
2.74 |
|
49 |
α =1.0 s |
54.4 |
0.300 |
0.875 |
2.75 |
|
|
50 |
α =1.5 s |
42.4 |
0.369 |
0.843 |
2.69 |
|
Note. r 1 – strength of a single element of the structure.
Table 5
Correlation table
|
Values of correlation coefficients r (for 50 compositions of Table 5) |
|||
|
α | n |
α | R max |
n | R max |
α/n | R max |
|
–0.813 |
0.249 |
-0.248 |
0.263 |
CONSTRUCTION MATERIAL SCIENCE
Table 6
DTA results of cement stone and data analysis results
|
No |
Enthalpy of anomalies (J/g) |
|Σ H | (J/g) |
Reduced enthalpy of anomalies |
δDi (%) |
||||
|
№1 |
№2 |
№3 |
№2 |
№3 |
№2+№3 |
|||
|
1 |
2 |
3 |
4 |
5 |
6 |
7 |
8 |
9 |
|
Plasticizer variation |
||||||||
|
1 |
-22.3 |
-54.7 |
-29.3 |
106.3 |
261.0 |
140.0 |
400.98 |
8.85 |
|
Plasticizer Melflux 2651F |
||||||||
|
2 |
-16.7 |
-51.7 |
-52.1 |
120.5 |
371.9 |
375.2 |
747.12 |
9.41 |
|
3 |
-27.9 |
-50.2 |
-47.9 |
126.0 |
227.2 |
216.6 |
443.78 |
11.97 |
|
4 |
-16.9 |
-54.9 |
-35.5 |
107.3 |
348.3 |
225.0 |
573.23 |
6.97 |
|
5 |
-16.9 |
-55.6 |
-26.6 |
99.1 |
325.4 |
156.0 |
481.38 |
4.90 |
|
6 |
-23.2 |
-43.0 |
-45.9 |
112.1 |
208.1 |
222.4 |
430.44 |
5.12 |
|
Plasticizer S3 |
||||||||
|
7 |
-32.2 |
-48.9 |
-48.0 |
129.0 |
195.8 |
192.2 |
387.96 |
7.36 |
|
8 |
-29.9 |
-51.7 |
-44.9 |
126.4 |
218.7 |
190.1 |
408.79 |
8.30 |
|
9 |
-40.3 |
-47.3 |
-51.5 |
139.1 |
163.3 |
177.8 |
341.09 |
8.30 |
|
10 |
-95.2 |
-49.0 |
-48.7 |
192.8 |
99.2 |
98.6 |
197.81 |
5.80 |
|
11 |
-160.6 |
-49.8 |
-58.3 |
268.7 |
83.3 |
97.5 |
180.87 |
16.34 |
|
Plasticizer Melment F15G |
||||||||
|
12 |
-22.2 |
-45.5 |
-48.8 |
116.5 |
239.1 |
256.7 |
495.75 |
1.33 |
|
13 |
-31.3 |
-40.5 |
-55.7 |
127.5 |
165.2 |
227.0 |
392.21 |
-0.49 |
|
14 |
-45.6 |
-42.9 |
-46.9 |
135.4 |
127.2 |
139.1 |
266.27 |
-1.36 |
|
15 |
-45.6 |
-39.1 |
-13.4 |
98.1 |
84.1 |
28.9 |
113.02 |
-3.31 |
|
16 |
-10.6 |
-3.7 |
-10.6 |
25.0 |
8.7 |
24.9 |
33.65 |
-5.09 |
|
Variation of microsized particles of metal hydrosilicates |
||||||||
|
17 |
-19.8 |
-54.4 |
-28.5 |
102.8 |
282.5 |
148.2 |
430.72 |
7.11 |
|
Microsized particles of copper hydrosilicates + 10% particles of barium hydrosilicates |
||||||||
|
18 |
-48.6 |
-43.2 |
-40.3 |
132.1 |
117.6 |
109.7 |
227.33 |
-0.08 |
|
19 |
-22.3 |
-48.2 |
-44.0 |
114.5 |
247.8 |
226.2 |
474.03 |
-3.42 |
|
20 |
-38.5 |
-45.4 |
-69.0 |
152.9 |
180.4 |
274.1 |
454.47 |
-13.51 |
|
21 |
-34.5 |
-25.0 |
-25.1 |
84.6 |
61.4 |
61.6 |
123.06 |
-5.28 |
|
Microsized particles of copper hydrosilicates + 10% particles of barium hydrosilicates |
||||||||
|
22 |
-33.8 |
-41.0 |
-42.8 |
117.5 |
142.4 |
148.7 |
291.13 |
-1.65 |
|
23 |
-65.6 |
-37.6 |
-49.6 |
152.8 |
87.4 |
115.5 |
202.92 |
2.12 |
|
24 |
-26.9 |
-58.8 |
-49.5 |
135.2 |
295.7 |
249.0 |
544.65 |
-0.96 |
|
25 |
-59.4 |
-51.1 |
-56.0 |
166.5 |
143.4 |
157.1 |
300.47 |
-10.53 |
|
26 |
-131.0 |
-31.3 |
-41.5 |
203.7 |
48.7 |
64.5 |
113.18 |
-8.66 |
|
27 |
-39.0 |
-21.2 |
-29.2 |
89.4 |
48.5 |
67.0 |
115.50 |
7.11 |
|
28 |
-66.1 |
-15.2 |
-23.3 |
104.5 |
24.0 |
36.8 |
60.79 |
-1.85 |
CONSTRUCTION MATERIAL SCIENCE
|
1 |
2 |
3 |
4 |
5 |
6 |
7 |
8 |
9 |
|
Nano-sized particles of zinc hydrosilicates + 10% micro-sized particles of barium hydrosilicates |
||||||||
|
33 |
-7.9 |
-41.5 |
-39.6 |
89.0 |
469.2 |
447.6 |
916.80 |
8.81 |
|
34 |
-13.1 |
-39.5 |
-38.0 |
90.6 |
272.8 |
263.0 |
535.80 |
5.35 |
|
35 |
-9.1 |
-45.5 |
-35.5 |
90.1 |
451.4 |
352.4 |
803.81 |
1.62 |
|
36 |
-8.6 |
-44.0 |
-28.4 |
80.9 |
414.7 |
267.7 |
682.37 |
-0.70 |
|
37 |
-15.2 |
-42.2 |
-38.6 |
96.0 |
266.8 |
244.2 |
511.03 |
6.60 |
|
38 |
-9.1 |
-45.5 |
-35.5 |
90.1 |
451.4 |
352.4 |
803.81 |
6.56 |
|
39 |
-8.8 |
-42.5 |
-35.5 |
86.8 |
420.7 |
351.5 |
772.15 |
8.39 |
|
40 |
-22.6 |
-41.5 |
-38.8 |
102.9 |
189.0 |
177.1 |
366.06 |
1.57 |
|
41 |
-13.1 |
-42,4 |
-38,7 |
94.2 |
306.1 |
279.2 |
585.22 |
4.01 |
|
Nanosized zinc hydrosilicate particles + 10% microsized barium hydrosilicate particles + 2% microsized zinc hydrosilicate particles |
||||||||
|
42 |
-9.9 |
-31.9 |
-42.1 |
83.9 |
271.9 |
358.6 |
630.42 |
0.72 |
|
43 |
-72.2 |
-30.7 |
-33.4 |
136.3 |
58.0 |
63.0 |
121.07 |
1.14 |
|
44 |
-36.9 |
-35.4 |
-34.2 |
106.6 |
102.2 |
98.7 |
200.91 |
1.62 |
|
45 |
-39.8 |
-35.0 |
-30.3 |
105.1 |
92.6 |
80.0 |
172.59 |
3.65 |
|
46 |
-16.1 |
-32.1 |
-27.9 |
76.1 |
152.0 |
132.3 |
284.24 |
2.55 |
|
47 |
-21.0 |
-33.5 |
-28.9 |
83.4 |
133.1 |
115.0 |
248.11 |
4.57 |
|
48 |
-20.7 |
-35.1 |
-32.0 |
87.8 |
148.7 |
135.4 |
284.13 |
2.50 |
|
49 |
-24.6 |
-33.3 |
-31.7 |
89.7 |
121.5 |
115.6 |
237.10 |
1.59 |
|
50 |
-14.3 |
-31.6 |
-33.7 |
79.7 |
176.1 |
187.8 |
363.98 |
1.64 |
Note. The number of the composition is similar to the number of the composition in Table 4.
This period of initial structure formation is characterized by a classical asymptotic dependence (Fig. 1, c and d ). The values of the correlation coefficients for the data of Table 4 are presented in Table 5, from which it follows:
-
• there is a high correlation between the parameters α and n of the equation of kinetics of structure formation (1); the trends identified during the setting stage are also shown, namely: an increase in the rate of structure formation leads to the formation of a less dense structure;
-
• between the parameters α and n of the equation of the kinetics of structure formation (1) there is only a weak connection with the maximum strength of the material. The use of a complex variable that includes the indicated parameters of equation (1) insignificantly increases the correlation coefficient.
The absence of a significant relationship between the parameters of equation (1) and the strength of the material indicates the presence of additional parameters that characterize the elements that make up the structure of the material. It is obvious that a qualitative average estimate of the elements of the structure can be obtained using the parameters R max (characterizes the maximum strength of the material) and the parameter n (characterizes the density of the material structure):
-
r 1 = R max / n , (4)
-
r 1 is structure element strength.
It is natural to assume that such an additional factor for the considered material should be the mineralogical composition of the Portland cement hydration products.
CONSTRUCTION MATERIAL SCIENCE
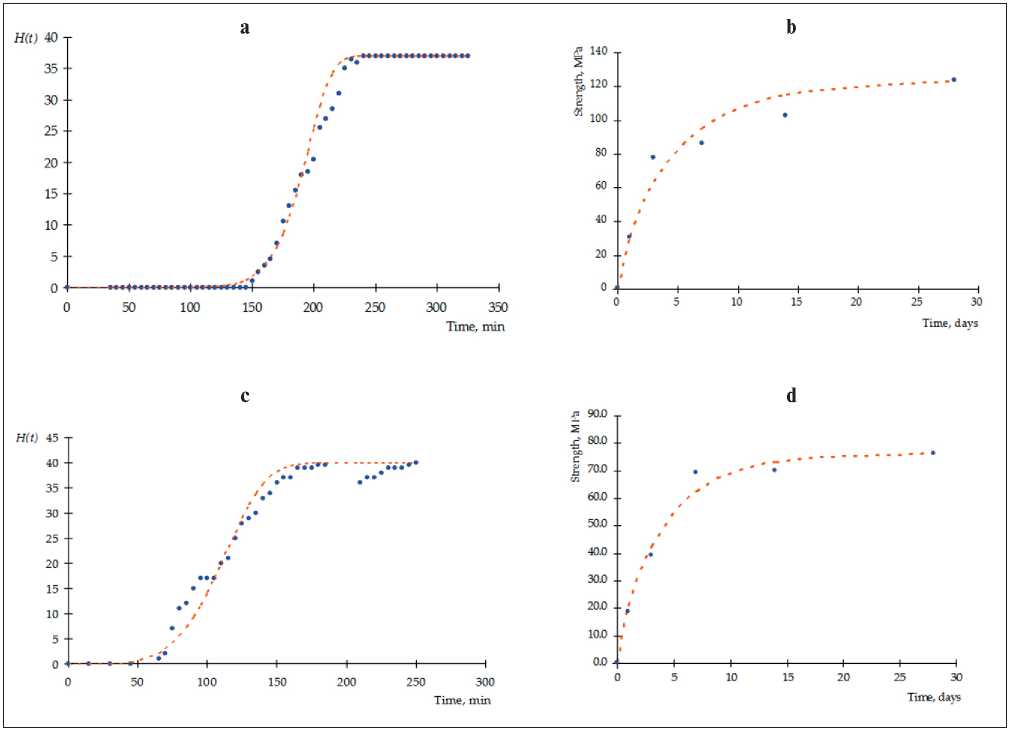
Fig. 1. Experimental kinetic dependences of the structure formation of cement materials : (a) and (b) for setting stage; (c) and (d) for curing stage; (a) and (c) in the presence of S3 plasticizer; (b) and (d) in the presence of microsized particles of zinc hydrosilicates
Differential thermal analysis data (Table 6) were used for the specified analysis.
The following qualitative characteristics were used for the analysis:
-
• reduced value of anomaly № 2:
Q2 = HIXH ,(5)
-
• reduced value of anomaly № 3:
Q3 = HIX H ,(6)
-
• reduced value of anomalies № 2 и № 3:
Q23 = HHH X H ,(7)
where Σ H is total enthalpy of anomalies; Hi is enthalpy of i -th anomaly.
In addition, the following coefficient was used to evaluate the change in internal dimension during the transition from the setting stage to the hardening stage:
A = Di^ , (8)
D i, 0
׀ Σ H ׀ is absolute total enthalpy of anomalies; δDi is relative change in the internal dimension of the system.
In accordance with the definition of the fractal dimension [10], the sign in front of δDi will indicate the trajectory along which the system developed:
-
• δDi > 0 indicates an increase in the range of characteristic sizes of structure elements; there is a consistent increase in the size of the elements of the structure in the process of its evolution or transition from the setting stage to the hardening stage;
-
• δDi < 0 indicates not a change in the characteristic dimensions of the elements of the system, but an increase in the relative number of elements with small dimensions; conditions that block the process of element enlargement are implemented in the system.
Analysis of Table 6 shows that the obtained data form two clusters in the coordinate system R max –׀ Σ H ׀ (Figure 2). Moreover, one cluster is formed by data characterizing the effect of a plasticizer, and the other ‒ the effect of particles of metal hydrosilicates.
The presented data clustering demonstrates the limited influence of the general fundamental regularities of the material structure parameters on its strength. That is, to achieve maximum strength, it is necessary to provide not only a high density of the structure, but also the presence of structural elements with high strength. Thus, the data of correlation table 7 demonstrate opposite trends in the influence of factors controlling structure formation: the introduction of plasticizers or the introduction of particles of metal hydrosilicates.
The relationship between the total enthalpy and the strength of the material is insignificant ( r < 0.3) at the introduction of plasticizers and the relationship is high at the introduction of particles of metal hydrosilicates ( r > 0.7). The same opposite trends are observed for individual anomalies. A noticeable positive relationship is observed for the second anomaly with the introduction of a plasticizer and a moderate negative relationship with the introduction of particles of metal hydrosilicates. At the same time, it should be noted that higher values of the correlation coefficient are observed when establishing relationship with the strength of the structural element. In addition, it follows from the presented data that the range of variation in the concentration of metal hydrosilicate particles should be refined.
An analysis of the dependence n = f ( δDi ) (Fig. 3) shows that the development path of the system depends on the type of input component. Values δDi < 0 are typi-
CONSTRUCTION MATERIAL SCIENCE
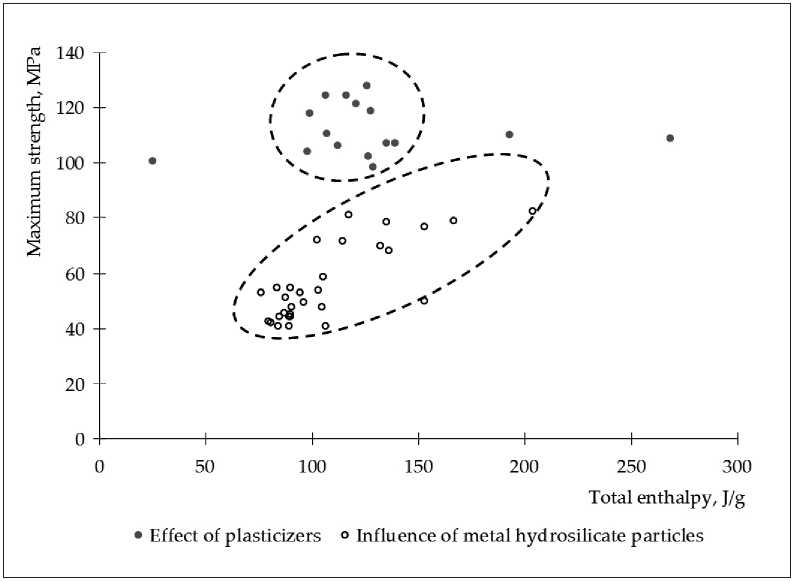
Fig. 2. Dependence of the maximum strength of cement stone on the total enthalpy of Portland cement hydration processes in the presence of a plasticizer or particles of metal hydrosilicates
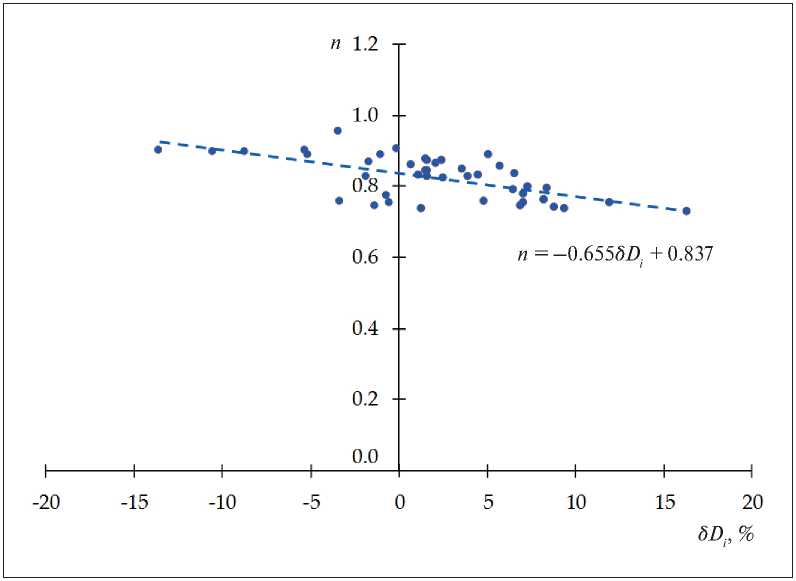
Fig. 3. Dependence n = f ( δDi )
CONSTRUCTION MATERIAL SCIENCE cal for cement systems with plasticizer Melment F15G or microsized particles of copper or zinc, for other systems the structure formation proceeds with the coarsening of the structural elements (δDi > 0).
The presented data demonstrate that systems characterized by δDi < 0 generally have a higher structure density, which is characterized by the parameter n (internal dimension of the system Di ).
CONCLUSIONS
In the structure formation of cement composites, it is proposed to distinguish two stages: the stage of setting the cement paste and the stage of hardening.
A strong negative relationship between the parameters α and n of the equation R ( t ) = R max(1– eatn ) at the hardening stage was confirmed. The trends identified at the setting stage are also demonstrated, namely: an increase in the rate of structure formation leads to the formation of a less dense structure. At the same time, it was found that the strength of the material at the stage of hardening should be influenced by the third factor (except for the rate of structure formation and structure density), which depends on the mineralogical composition of the cement stone. Analysis of data from the study of the min-
eralogical composition of cement stone by the method of differential thermal analysis shows that the effect of the influence of the third factor depends on the type of introduced substance. Moreover, opposite trends in the influence of plasticizers and particles of metal hydrosilicates have been established. This indicates the need to refine the range of variation in the concentration of metal hydrosilicate particles.
An analysis of the change in the value of the internal dimension of the system during the transition from the stage of setting to the stage of hardening made it possible to identify two trajectories of the development of the system. The first of them appears only by combining the elements of the structure (trajectory No. 1). Preservation of the characteristic dimensions of structural elements, but an increase in the proportion of elements with small dimensions (when the conditions that prevent the combination of elements of the structure are realized) describes the second trajectory (trajectory No. 2). The implementation of trajectory No. 2 is typical for compositions which the structure formation of cement stone is carried out in the presence of Melment F15G plasticizer or microsized particles of copper or zinc. For other studied compositions, structure formation proceeds with the enlargement of structural elements.
Table 7
Correlation table
|
|Σ H | | r 1 |
|Σ H | | R max |
Q 2| r 1 |
Q 23 | r 1 |
Q 23 | r 1 |
Q 2| R max |
Q 23| R max |
Q 23| R max |
|
Effect of plasticizers |
|||||||
|
0.165 |
0.023 |
0.654 |
0.501 |
0.617 |
0.540 |
0.497 |
0.550 |
|
Influence of metal hydrosilicate particles |
|||||||
|
0.687 |
0.754 |
–0.277 |
–0.361 |
–0.321 |
–0.337 |
–0.378 |
–0.362 |
References Study of the kinetics structure formation of cement dispersed systems. Part II
- Ahmed H, Bogas JA, Guedes M, Pereira MFC. Dispersion and reinforcement efficiency of carbon nanotubes in cementitious composites. Magazine of Concrete Research. 2018; 71(8): 408–423. Available from: https://doi.org/10.1680/jmacr.17.00562
- Aksenova VV, Alimbaev SA, Pavlov AV, Mustafin RM. Briquetting of Porous Alumina-Containing Materials Using Organic Binders. Steel in Translation. 2021; 51: 291–295. Available from: https://doi.org/10.3103/S0967091221050028
- Duong TQ, Korolev EV, Inozemtcev AS. Selection of Reinforcing Fiber for High-strength Lightweight Concrete for 3D-Printing. IOP Conference Series: Materials Science and Engineering. 2021; 1030 (1): 012007. Available from: https://doi.org/10.1088/1757-899X/1030/1/012007
- Kim M, Kim T, Kim H. Rheological analysis of physical states of cellulose nanocrystal suspension and synergetic effect of aligned gel state. Carbohydrate Polymers. 2022; 28415: 119170. Available from: https://doi.org/10.1016/j.carbpol.2022.119170
- Zhai Y, Tang Y, Li J, Duan L, Su C, Cao A, Jin C, Fang L. Structure, Raman spectra and properties of two lowεr microwave dielectric ceramics Ca3B2Ge3O12 (B = Al, Ga). Ceramics International. 2020; 46: 28710–28715. Available from: https://doi.org/10.1016/j.ceramint.2020.08.031
- Maksimova I, Makridin N, Erofeev V, Barabanov D. Study of the Properties of Water-Hardened Cement Stone Depending on the Water-Cement Ratio and Age. Proceedings of EECE 2020. 2021; 192–203. Available from: https://doi.org/10.1007/978-3-030-72404-7_20
- Maksimova IN, Erofeev VT, Makridin NI. Kinetic parameters of hydration structure formation and hardening of cement stone up to 9.5 years old after steaming. News of universities. Construction. 2018; 3: 24–33. Available from: https://elibrary.ru/item.asp?id=35250280 [Accessed 20th January 2022].
- Korolev EV, Grishina AN, Inozemtcev AS, Ayzenshtadt AM, Study of the kinetics structure formation of cement dispersed systems. Part I. Nanotechnologies in Construction. 2022; 14(3): 176–189. Available from: https://doi.org/10.15828/2075-8545-2022-14-3-176-189
- Bobryshev AN. Physics and synergetics of dispersed-disordered condensed composite systems / AN Bobryshev, VT Erofeev, VN Kozomazov. SPb.: Science; 2012.
- Bobryshev AN Strength and durability of polymer composite materials / A.N. Bobryshev, VN Kozomazov, AV Lakhno, VV Tuchkov. Lipetsk: Ulis; 2006.
- Bobryshev AN, Kozomazov VN, Avdeev RI, Tumanova NN. Topological features of kinetic processes. Condensed media and interfaces. 2003; 5: 120–125.
- Avdeev RI, Bobryshev AN, Tumanova NN. Models of evolutionary processes with linear mapping. News of the Tula State University. Series: “Technology, mechanics and durability of building materials, structures and structures. 2001; 2: 45–49.
- Voronov PV, Bobryshev AN, Lakhno AV. Estimation of the kinetics of phase transitions in hardening heterogeneous materials. Regional architecture and construction. 2010; 2: 58–66. Available from: https://elibrary.ru/item.asp?id=15322265 [Accessed 21th January 2022].
- Zhirmunsky AV. Critical levels in the development of natural systems / AV Zhirmunsky, VI Kuzmin. L.: Science; 1990.
- Grishina AN, Korolev EV. Efficiency of Modifying Cement Composites with Nanosized Barium Hydrosilicates. Building Materials. 2015; 2: 72–76. Available from: https://elibrary.ru/item.asp?id=22992326 [Accessed 22th January 2022].
- Grishina AN, Korolev EV. Choice of Technology for the Synthesis of Nanosized Barium Hydrosilicates. Nanotechnologies in construction. 2013; 5: 111–119. Available from: https://elibrary.ru/item.asp?id=20355453 [Accessed 23th January 2022].
- Grinchenko VT. A dozen lectures on fractals: From an object of admiration to a tool of knowledge / VT Grinchenko, AA Matsypura, IV Snarsky, L Vovk. M.: LENAND; 2020.
