Study on Optimization of Phase Offset at Adjacent Intersections

Author: Yuanli GU, Lei Yu
Journal: International Journal of Intelligent Systems and Applications(IJISA) @ijisa
Article in issue: 1 vol.2, 2010.
Free access
Optimization of the phase offset at adjacent intersections is the key parameter regarding coordinated control of traffic signal for adjacent intersections, which decides the effect of the coordinated control for adjacent intersections. According to characters of saturated traffic flow of Chinese urban road, this thesis establishes a model for optimization of phase offset for adjacent interactions and finds a solution from such model by adopting genetic algorithm. The model is verified by actual traffic flow datum of two adjacent signal intersections on Changan Avenue. Then a comparison is made between the optimization result of such model and that of the existing mathematical method and SYNCHRO model, which indicates that the model established by this thesis can reduce the delay suffered by vehicles at the intersections and increase the traffic efficiency of the intersections.
Optimization, adjacent intersections, phase offset, traffic flow, modeling
Short address: https://sciup.org/15010137
IDR: 15010137
Text of the scientific article Study on Optimization of Phase Offset at Adjacent Intersections
Published Online November 2010 in MECS
There mainly are British SCOOT system, Australia SCATS system, Spanish ITACA system, American Quicnet/4 system, Italian UTOPIA system and American RHODES system, etc. that involve the study on control system for urban traffic signal.[1-2]
There are two traditional design methods of green wave coordinated control system for urban arterial road: graphical method and mathematical method [3], which is widely used as their principle is simple. However, the control effect resulting from coordinated control parameters solved by adopting such two methods usually comparatively differs from actual situation as the factors taken into consideration by which are excessively simple.
The scholars have already conducted research on defects in the optimization of phase offset for arterial road. Reference [4] establishes optimization adjustment model of phase offset by analyzing delay orderliness of up and down vehicles at intersections, but it does not consider vehicle flow swarming into arterial road from intersection or discreteness and non-uniformity of motorcade; Reference [5] puts forward coordinated algorithm for signal control of two adjacent intersections, which comprehensively considers length of motorcade on each lane, quantity of vehicles between two induction coils of each lane and traffic volume between two intersections, but it does not establish a complete coordinated control theory; Reference [6] establishes a model for signal coordinated control of adjacent intersections based on mixed integer programming, but such model only considers single lane. Therefore, the methods mentioned in the above literatures have not completely resolved the problem of traffic coordinated control for urban arterial road, and it is required that further study shall be conducted on issues relating to the optimization of phase offset.
-
II. M ATHEMATICAL M ODEL FOR O PTIMIZATION OF P HASE O FFSE
-
A. Definitions
External entry lane of coordinated system for arterial road is entry lane entering the coordinated system for arterial road from the outside is referred to as external entry lane of the system. Sub-road entry lane and two entry lanes outside the intersections at two terminals of arterial road are external entry lanes of the system.
Internal Entry lane of coordinated system for arterial road means the entry lane on the arterial road that does not directly connect to the road outside the coordinated system for arterial road.
-
B. Descriptions of Model
Descriptions of coordinated control system for two adjacent intersections on arterial road (as shown in Figure 1: the system is composed of two intersections, i.e. A and B, which share the same arterial road, and the distance between the adjacent intersections is lab. Regarding this system: the respective average traffic volume of up and down vehicle flow swarming onto arterial road of the system (including the right-turn vehicles and left-turn vehicles swarming at the crossing road) is qdown, qup(pcu/s), the respective average vehicle speed of up and down vehicle flow of the system within single hour is vdown, vup (m/s). The respective up and down traffic capacity of road section between two intersections of the system is udown, uup (pcu/s). This system is composed of two intersections, within which there are six entry lanes connecting to the outside.
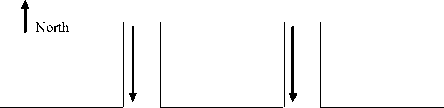
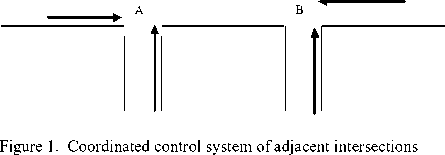
In respect of coordinated control system for
n arterial road, target function is min S Di i=1
D i in the function is the sum of delay of up and down vehicles at the i th intersection within a cycle.
The model of this thesis contains two intersections, within which there are six external entry lanes and two internal entry lanes.
-
C. Analysis of External Entry Lane Delay
The delay of external entry lane can be solved by applying classical Webster delay model [7], and the calculation formula of Webster intersections entry lane delay is:
d =
2 2 1/3
.c v- A L+— X q 65 _ c _ I ^( 2 + 5 2 ) 2 ( 1 - AX ) + 2 q ( 1 - X ) ( q 2 J X
( 1 )
in which, d is average delay of each vehicle;
C is length of time of signal cycle;
λ is green ratio, i.e. the ratio of effective green light time to length of time of signal cycle;
q is standard traffic volume (pcu/h);
X is saturation, i.e. the ratio of actual arrival traffic volume to traffic capacity of entry lane at signal intersections.
It can be seen from formula (1) that the delay of external entry lane has no relation with phase offset and it can be calculated out independently, therefore, the target function in this thesis only calculates the delay of the two external entry lanes at artery direction other than that of the four external entry lanes at side road direction, which will not affect the optimization of phase offset.
Suppose the respective delay caused by each vehicle from external entry lane at artery direction of intersection A and B is da and db , the respective arrival traffic volume of vehicle from artery direction of intersection A and B is qa and qb , the respective total delay caused by external entry lane at artery direction of intersection A and B is Da and Db , then the following relational expression is tenable.
Da = da * qa
Db = db * qb(
Suppose the total delay of external entry lane at artery direction of the two intersections is D ext , then
Dext = Da + Db(
The delay of external entry lane can be solved by substituting the value of each parameter.
-
D. Analysis of Internal Entry Lane Delay
-
1) Model of Exit Traffic Flow Rate of Arterial Road
The traffic volume of arterial road exit is mainly composed of straight vehicles of arterial road exit and left-turn and right-turn vehicles of the crossing road. As the vehicles on the arterial road and vehicles on the crossing road move out of the arterial road exit lane in turn, analysis can be conducted respectively.
After arterial road exit traffic flow pattern of vehicles on the arterial road and crossing road at intersections is obtained, exit flow rate of arterial road can be obtained by conducting superposition, on the basis of which, flow rate distribution of each intersections when arrives at next intersection entry lane and their delay can be calculated by applying Robertson traffic flow dispersion model.
Under general circumstance, regarding two phases signal control system, the traffic flow rate pattern of arterial road exit obtained after traffic flow superposition shall be as shown in Figure 2 (the meaning of period of time in the Figure: white indicates green light period of time, black indicates red light period of time).
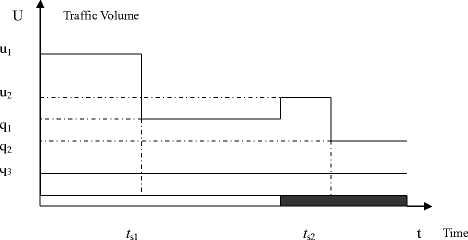
Figure 2. Arterial road exit traffic flow pattern
Meanings of each quantum in the Figure:
-
u 1 : saturated traffic volume of straight lane of arterial road;
-
u 2: saturated traffic volume of left-turn lane of crossing road;
-
q 1: free traffic volume of straight lane of arterial road;
-
q 2: free traffic volume of left-turn lane of crossing road;
-
q 3: free traffic volume of right-turn lane;
-
t s1: queuing dispersal time of straight vehicle traffic flow of arterial road;
-
t s2: queuing dispersal time of left-turn vehicle traffic flow of crossing road.
In order to conveniently express the time, the following Figure (as shown in Figure 3) is used to indicate the situation of cycle at the intersection:
Simplification of which is : ts
t d X Q
U — Q
( 9 )
T
t k t k+1
t g
Figure 3. Cycle at the intersection
2) Discretization Disposal on Traffic Flow
To conduct discretiztion disposal on traffic flow by applying D. I. Robertson traffic flow dispersion formula, 1s shall be chosen for dispersion period of time in this model. Then there is the following mathematical relationship between the arrival rate of vehicle on a downstream fracture surface and the pass rate of vehicle on the upstream fracture surface of parking line:
qd ( i + 1 ) = Fq o ( i ) + (1 + F ) qd ( i + 1 — 1) ( 10 )
In the formula,
Q a ( i + t )
: the anticipated arrival rate
of vehicle flow at the ( i + t ) th period of time on a
The meaning of symbol in the Figure:
downstream fracture surface;
-
t k , t k+1 : the beginning time and terminal time of the k th cycle of the intersection from t k to t k+1, t k is the time when red light turns into green light;
-
T: length of time of the cycle;
-
t g: length of time of green light of artery direction within the k th cycle.
Traffic flow pattern of arterial road exit shown by subsection function:
qo ( ) : the pass rate of vehicle flow at the ith
period of time on an upstream fracture surface of parking line;
t : 0.8 times of average vehicle driving time between the two fracture surfaces (taking quantity of period of time as the unit);
u ( t ) =<
'u i ( t ) t e | tk,tk + t g J U2 ( t ) t c [ t k + t g/ t k + l J
t _ Q-^ abb ( mOd, t ) v
( 11 )
( 5 )
F: dispersion coefficient of traffic flow, empirical formula for F is:
u1 ( t )_
<
u + q 3
q i + q 3
u 2 ( t ) =
<
u2 + q 3
q 2 + q 3
t e[ tk , t k + t si ) ( 6 )
t e[ tk + ^П t k + t g ) t e [ tk + t g , t k + t g + t s2 ) t e[ tk + t g + t s2 - t k + i )
F =---1---
1 + A*t
( 12 )
ts in the subsection function above is unknown, now the queuing dispersal time ts of traffic flow is needed to be solved.
Assuming that at the beginning of system analysis, traffic flow just begins to lining up at the parking line when the red light turns on, when the waiting time td for red light is passing by (artery direction t d = t r , crossing road direction t d = T — t r ), the queue of vehicle begins to disperse, and it will take ts to realize the complete dispersal of the motorcade.
Q is free flow rate (artery direction is Q 1 , crossing road direction is Q 2 );
U is saturated flow rate (artery direction is U 1 , crossing road direction is U 2 ).
Based on vehicle queue quantity conservation, there is:
Q ( t d + t s ) = U X t s ( 8 )
It is very important to confirm the dispersion coefficient F. According to the characters of traffic flow of Chinese urban road [7], as A value that between 0.1 and 0.15 is comparatively suitable, A in this thesis is chosen as 0.12.
If suppose j=i+t, i=j-t, the following formula also can be deduced from the formula of Robertson:
j — t
q d ( j ) = 2 q o ( i ) f (1 — f ) ( j —t"'
1 ( 13 )
q 0 ( i ) is the array whose value is already known as in the subsection function u(t) shown in Figure 2, and its expression formula is formula (5), formula (6) and formula (7).
3) M ethod of Calculation of Delay Suffered by Down Vehicle Passing the Intersections
There are two situations in which the traffic flow passing the intersections might be blocked by red light (taking B intersection for example): the first one is that the head of the motorcade is blocked by red light when it arrives at the intersection B (i.e. the first vehicle of the motorcade encounters the red light when it arrives at the parking line); the other situation is that the motorcade does not encounter the red light when it arrives at intersection B at the very start, but the
0.8----
(
mod
T
)
-
motorcade is blocked as the signal light turns from green into red when partial motorcade has passed the intersection, which shall be defined as block of central section of motorcade.
Suppose the signal phase offset of intersection B against intersection A is α
(
0<α
The block situation of motorcade is confirmed by discussing the big and small relationship between lab and α.
v down
a) Block situation of the head of motorcade before the next intersection
0.8-b^(mod T)< tg or 0.8-ab^-(mod T)> tg , gg down down the following relational expression is tenable:
In the event that 0.8 —ab— (mod T) < a , the first v, down vehicle in the motorcade encounters the red light when it arrives at intersection B, i.e. block of head of motorcade. Assume the waiting time for the red light suffered by the blocked motorcade at intersection B is ωdown , then the signal light turns from red into green, the queuing vehicles begins to disperse and it will take ts to realize the complete dispersal. In the event that 0.8 —ab— (mod T)< a and the head of the v, down motorcade is blocked, no matter
0 8 l
---ab - (mod T ) + W down = a ( 14 )
v down
The time for the block of head of motorcade can be obtained:
W down = a - ^^ ab ( mod T )
down
( 15 )
When the motorcade begins to disperse, the equation can be enumerated based on vehicle quantity conservation:
W d own + t s
2 q d
0.8I к / ч
---a- ( mod T )+ i = U 1 t s
v down the queuing dispersal time ts of the motorcade can be obtained from the equation above:
t s
W down + t s
2 q d
U 1
^^ ( mod T ) + i
Vj down
( 17 )
the parking delay of the traffic flow from such direction can be obtained according to the length of time for waiting the red light suffered by the motorcade and the queuing dispersal time obtained by enumerating the equation, then the calculation formula of delay can be obtained as follows:
down
A = 0.5 ( w down + t s ) 2 q d
^*$ aab ( mod T ) + i v, down
( 18 )
b) Block situation of the central section of motorcade before the next intersection
0.8 —ab— (mod T) > a and the central section of the v, down motorcade is blocked, no matter 0.8 ab (mod T)< t or0.8 —ab— (mod T)> t , the following relational g down expression is tenable:
In the event that 0.8 —ab— (mod T)> a , the v, down first vehicle of the motorcade encounters the green light when it arrives at intersection B, and partial vehicles pass the intersection B, assume the central section of the motorcade begins to be blocked after ω'down as the light turns from green into red , and the queuing vehicle begins to disperse after waiting for the red light time tr , and it will take ts to realize the complete dispersal. In the event that
g down
-
0 8 l
----ab - (mod T )+ W down = a + t g ( 19 ) v down
Obtaining that
0 8 l
W down = a + tg-- a ^ (mod T ) ( 20 )
down
When the motorcade begins to disperse, the equation can be obtained based on vehicle quantity conservation:
t r + « s
2 q d
0.8 l '
-----(mod T )+ W down
v down
+ i = U 1 t s
( 21 )
The dispersal time ts of the vehicle can be obtained
( 16 )
from the equation above:
t s
t r + t s
2 q d
U 1
-
0.8 Ia^ ( mod T )+ W down + i
Vj down
( 22 )
The parking delay of the traffic flow from such direction can be obtained according to the length of time for waiting the red light suffered by the motorcade and the queuing dispersal time obtained by enumerating the equation, then the calculation formula of delay can be obtained as follows:
' tr
A = 0.5 ( t r + t s ) Z q d\ a + t g + i J ( 23 )
motorcade and the queuing dispersal time obtained by enumerating the equation.
As when vehicle arrives at the intersection B, it constitutes either block of head of motorcade or block
up в _ 0-5Шup +1, )Z qd
0'8lab (modT) + i v up
( 29 )
of central section of motorcade, the expression formula of delay caused by the down vehicle at internal entry
b) Block of central section of up motorcade
lane is:
D down _ m A + ( 1 - m ) A
1 ^ ( mod t ) < a m J v down
|o O-8^ (mod T )> a down
( 24 )
4) M ethod of Calculation of Delay Suffered by Up Vehicle Passing the Intersections
It is known from the phase offset theory that if the signal phase offset of intersection B in the system against intersection A is α, then the signal phase offset of intersection A against intersection B is в _ T - a .
It is similar to the analysis of delay suffered by down vehicle passing the intersection that the analysis of delay suffered by up vehicle passing the intersection also can be discussed based on two situations: block of head of motorcade and block of central section of motorcade.
OR/.,
----(modT)+Wup _ в +1g (30) v up
Based on^li b ( mod T ) + Ш „, _ в + 12 ( 30 )
v pg up
Can obtain:
Ш Up _ в + t g - 0:8 l aL ( mod T ) ( 31 )
v up
When the motorcade begins to disperse, the equation can be obtained based on vehicle quantity conservation:
t r + t s
Z q d
0.8 l ab
v up
( mod T ) + ш up + i
_ и 1 1 .
( 32 )
The dispersal time ts of the vehicle can be obtained
from the equation above:
t s
t r + t s
Z q d
U 1
^^ (mod T )+uUp + i v up
( 33 )
a) Block of head of up motorcade
OR/ . ,
---ab ( mod T ) + Ш up _ в ( 25 )
v up the time for the block of head of up motorcade can be obtained from081^(mod T)+Ш _ в :
v up p
Ш up _ в — °8- ( mod T ) ( 26 )
v up
When the motorcade begins to disperse, the equation can be enumerated based on vehicle quantity conservation:
the parking delay B’ of the traffic flow from such direction can be obtained according to the length of time for waiting the red light suffered by the motorcade and the queuing dispersal time obtained by enumerating the equation.
в _ 0'5( t r + t s )^ t L q d [ в + t g + i ] ( 34 )
As when vehicle arrives at the intersection A, it constitutes either block of head of motorcade or block of central section of motorcade, the expression formula of delay caused by the down vehicle at internal entry lane is:
D up _ nB + ( 1 - n ) B
Ш up + t s
Z q d
0'8lab (mod T) + i v up
_ U 1 t .
( 27 )
the queuing dispersal time ts of the motorcade can be
obtained from the equation above:
1 t - °ZaL (mod T)> a v up
0 t - °:^ (mod T)< a V up
( 35 )
t s
U 1
Ш up + t s
Z q d
0'8lab (mod T) + i v up
( 28 )
In order to simplify the issue, T-α is took to substitute β herein.
The parking delay B of the traffic flow from such direction can be obtained according to the length of time for waiting the red light suffered by the
E. Model for the Optimization of Phase offset
It can be obtained from the conclusion above that the sum of delay of up and down motorcade in a linearity coordinated system constituted by two adjacent intersections is D, which is
min D = D„ + Dex, = (Dd„. + D„)+ (D, + Db)
= { mA + (1 - m ) A '] + [ nS + ( 1 - n ) S ']} + ( d , * qo + d , * q b )
m = <
0.8lab
v down
0.8lab
(mod T)< a
T
v, down
0.8^
ab
(mod T) > a
n = <
T -
v up
0.8l ab
v up
(mod T)> a
(mod T)< a
( 36 )
in addition, adding a restrictive condition 0 < a < T
-
C. Optimization result of Existing M athematical Method
Distance between intersection A and B is 754 meter. Cycle time is 125s, down traffic speed is 9 m/s, up traffic speed is 8.5 m/s, and taking ν=8.7m/s as tape speed of the system.
It is can be obtained from analysis that A and B constitute an alternate coordinated control system, cycle C=125s, the calculation of phase offset is as follow:
α= C/2 + (750 – 640) / 10.24 = 73s
-
D. Optimization Result of Existing SYNCHRO Model
Applying SYNCHRO software to optimize the phase offset of the two adjacent intersections on the Changan Avenue, from which the optimized phase offset 63s of the two intersections is obtained. Figure 5 shows the simulation interface of SYNCHRO software.
-
III. E XAMPLE OF M ODEL A PPLICATION
-
A. Traffic Flow Data of Adjacent Intersections
The thesis has chosen two adjacent intersections on Changan Avenue of Beijing, whose detailed location is as shown in Figure 4.
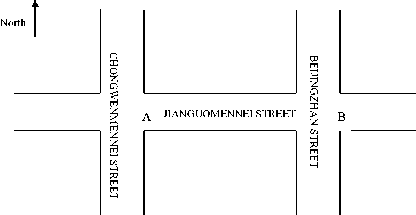
Figure 4. Link and intersection survey chart
To categorize the datum of the adjacent intersections, the result derived from which is as shown in Table 1(suppose down direction is from west to east):
Table 1 Relative Data statistical result of adjacent intersections
|
A |
B |
|
|
Green Light Time (s) |
70 |
68 |
|
Red Light Time (s) |
55 |
57 |
|
Signal Cycle (s) |
125 |
125 |
|
Saturated Traffic Volume (pcu/s) |
2.5 |
2.5 |
|
Average Arrival Traffic Volume (pcu/s) |
1.0894 |
1.1606 |
|
Right-Turn Traffic Volume (pcu/s) |
0.1001 |
0.3011 |
|
Traffic Capacity (pcu/s) |
1.3889 |
1.3889 |
|
Average Speed ( m/s ) |
8.5 |
9 |
|
Intersection Distance (m) |
754 |
754 |
-
B. Solution Result of the Most Optimized Model
Adopting genetic algorithm to optimize the model and stop the iteration after genetic algorithm has been iterated fifty-one times. The calculation result is that in the event that the phase offset is 61s, total delay of the system is minimums, and the average minimums delay of each vehicle is 59.13s.
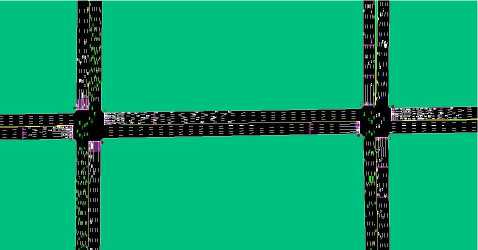
Figure 5. Simulation interface of SYNCHRO
-
E. Simulation Result and Comparison Analysis
Applying simulation software PARAMICS to conduct simulation study. Initial input parameters are the distance between two intersections, quantity of lanes of each intersection, traffic volume and flow direction of the traffic flow, speed of traffic flow, proportion of big vehicle, signal timing dial plan, then conducting simulation experiment by respectively applying the optimization result of mathematical method and SYNCHRO software and the phase offset plan obtained from the method stated in this thesis. The simulation interface is as shown in Figure 6.
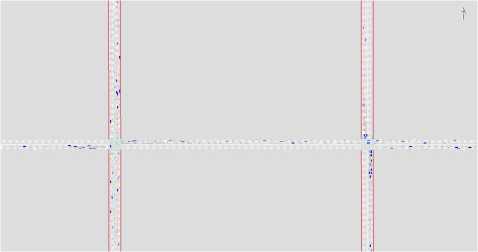
Figure 6. Simulation interface of PARAMICS software
Through simulation and statistic analysis, the comparison analysis among the calculation result of the model in this thesis, mathematical method and SYNCHRO method is as shown in Table 2.
|
Table 2 Analysis of delay based on three methods |
|
|
Delay of Each Vehicle (s) |
|
|
Method of this Thesis |
59.13 |
|
Mathematical Method |
81.01 |
|
SYNCHRO Method |
65.57 |
It is can be concluded from the comparison analysis of result that the solution result derived from the model established by this thesis is superior to the optimization result derived from mathematical method and SYNCHRO software.
-
IV. C ONCLUSION
Through the analysis on delay orderliness of vehicles driving through arterial road at up and down direction, this thesis establishes a mathematical model for the optimization of phase offset for adjacent intersections, and finds a solution from such model by adopting genetic algorithm. Through simulation verification based on actual example, it is can be concluded that the optimization model established by this thesis can improve the effect of coordinated control for arterial road system.
A CKNOWLEDGMENT
This work was supported in part by “973” National Key Basic Research Development Planning Project (2006CB705505).
References Study on Optimization of Phase Offset at Adjacent Intersections
- Stevanovic, Kergaye, and Martin, “SCOOT and SCATS: A Closer Look into Their Operations”, Preprint CD-ROM of 88nd TRB Annual Meeting. TRB, National Research Council, Washington, D.C. 2009.
- P. Mirchandani and L. Head, “RHODES” Traffic-adaptive control system. Workshop on Adaptive Traffic Signal Control Systems, TRB Meeting, January 2001.
- TRANSYT-7F User’s Guide, U.S. Department of Transportation, Washington DC, 1991.
- X. WAN and H. LU, “An Optimal offset Model for artery traffic signal control system”, China Journal of Highway and Transport, 2001, Vol. 2, pp.99-102.
- L. Li, H. Gao, F. Wang. “Cooperative Control of Traffic Signal for Adjacent Intersection”, Acta Automatica Sinica, 2003, Vol. 6, pp.947-952.
- E. YUAN, F. TU and X. CAI, “A Mixed Integer Programming Formulation for Coordinated Traffic Control of Adjacent Intersections”, Systems Engineering, 2006 Vol. 8, pp.32-37.
- Y. CH ANG, G. PENG. “Urban arterial road coordinate control based on genetic algorithm”, Journal of Traffic and Transportation Engineering, 2003, Vol. 2, pp.106-112.
