Study on the influence of zeolite nanoparticles on selected properties of portland cement

Author: Mohammedameen A.I.M., Agzamov F.A., Ismakov R.A.
Journal: Nanotechnologies in Construction: A Scientific Internet-Journal @nanobuild-en
Section: The study of the properties of nanomaterials
Article in issue: 1 Vol.16, 2024.
Free access
Introduction. Cement microstructure imaging is an emerging field of non-destructive compositional investigation. Some data may be available via one method but not the other due to various physical and chemical mechanisms that could cause cement decay. In order to quantitatively and qualitatively evaluate cement stone, it is necessary to investigate it as a complex multi-phase composite material, identify its crystalline phases, and estimate the precise size of its nanoparticles. Materials and methods. This work presents the results of a microscopic study of the effect of Nanozeolites (particle size ≤ 100 nm) on cements for cementing wells. To study the surface properties (chemical bonds between molecules, analysis of mineral composition, and surface topography and morphology) of class G cement stone, three types of microscopes – IR spectrum, X-ray diffraction (XRD), and atomic force microscopy (AFM) – were used. Zeolite nanoparticle additives were introduced at varying concentrations (0.5%, 1%, 1.5% by weight of cement) after 8 hours of curing in a water bath at atmospheric pressure and a heating temperature of 60оC (140оF). Results and discussion. The infrared spectra revealed changes in surface properties, indicating a decrease in free water and an increase in the strength of the system with the addition of nano zeolite. X-ray diffraction method (XRD) allowed for the identification of the main phases of crystalline hydration. The highest peak intensity is due to calcium hydroxide CH, which decreases with the addition of nano zeolite. This phenomenon elucidates the pozzolanic behavior of nano zeolite, which reacts with precipitated calcium hydroxide upon hydration to form C–S– H, reduces the calcium hydroxide content of the layered structure and increases C–S–H. The topography and surface morphology of the samples were studied at the nanoscale using atomic force microscopy. The images show the nanoparticles propagate along the cracks and appear to increase the surface layer's resistance to deformation and stress relaxation in cement-based materials. In addition, they promote viscoelastic C–S–H behavior. Conclusion. Adding nano zeolite to Portland cement affects the process of early hydration of cement stone and increases its early strength. Additionally, the introduction of 1.5% nano zeolite into cement results in the formation of irregular peaks and valleys of low porosity filler, ultimately enhancing the cement's strength.
Nano-zeolite, IR spectroscopy, calcium silicate hydrate (C–S–H), calcium hydroxide (CH), X-ray diffraction (XRD), atomic force microscopy (AFM)
Short address: https://sciup.org/142240522
IDR: 142240522 | DOI: 10.15828/2075-8545-2024-16-1-12-21
Text of the scientific article Study on the influence of zeolite nanoparticles on selected properties of portland cement
Original article
After the mixture has hardened, the composition of the cement stone includes various crystalline and amorphous phases, as well as water and pores of various sizes. During the hydration process, calcium-silicate-hydrate (C–S–H) is formed, which constitutes up to 60% of the volume of hydrated cement and about 25% of the solution volume is calcium hydroxide (CH) crystals. To study such systems, infrared spectroscopy in combination with X-ray analysis and microscopy is a useful tool for characterizing the phases [1, 2].
Nano-zeolite is a type of nanomaterial that has received insufficient attention as an additive in well cementing. This may be due to the wide availability of many nano-materials, with the use of nano-zeolite in a number of other industrial applications.
In general, nano-zeolites are crystalline aluminosilicates with a distinct porous structure and molecular pore sizes in the range of 0.3–2 nm (within an open three-
THE STUDY OF THE PROPERTIES OF NANOMATERIALS dimensional structure of tetrahedral silica SiO4 and aluminum oxide AlO4). Nano-sized zeolite has been found in both volcanic and sedimentary rocks. In industry, zeolite has proven itself as an ion exchanger, catalyst and adsorbent, which is used in oil refining, petrochemicals, agriculture, soil management, water and wastewater treatment [3]. Therefore, the formula for the crystallographic unit cell can be used to describe all zeolites; Ma/n [(AlO2) a (SiO2)b].XH2O. Where M denotes cations, n is the valence of the cation, the ratio b:a >= 1 and 5, and X is the number of moles of water trapped within the zeolite structure[4].
This study is aimed at assessing the effectiveness of using nano zeolite as an additive for cementing oil wells. The study focused on analyzing the surface morphology and structure of all samples using X-ray diffraction, IR and AFM techniques. The results of this study may help determine the potential of nano-zeolites as an alternative component in cement slurry to maintain long-term well integrity.
MATERIALS AND METHODS
For the experiments, oil well cement (Glass G) and zeolite nanoparticle powder with a particle size of less than 100 nm, called (Sapo-11 nano zeolite powder 4A) was used in the form of a white powder (Fig. 1) with a pore volume (≥ 0.16 cm3/g) and specific surface area (SSA ≥ 180 m2/g). The chemical composition are (SiO2 ~ 6%, Al2O3 ~ 48%, and Na2O ≤ 0.2%).
Deionized water with a water/cement ratio of 0.44 was used for sample preparation. The tested cement mortar was placed in prepared molds (50 mm*50 mm*50 mm) at various dosages of 0.5%, 1% and 1.5% nano-zeolite. Samples were cured hermetically by storing the slurry inside copper molds with lids tightly attached and immediately immersing them in the curing bath, at atmospheric pressure and a heating temperature of 60оC (140оF) for 8 hours
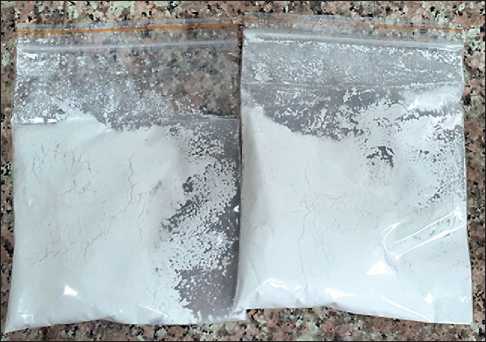
Fig. 1. Nano zeolite appearance
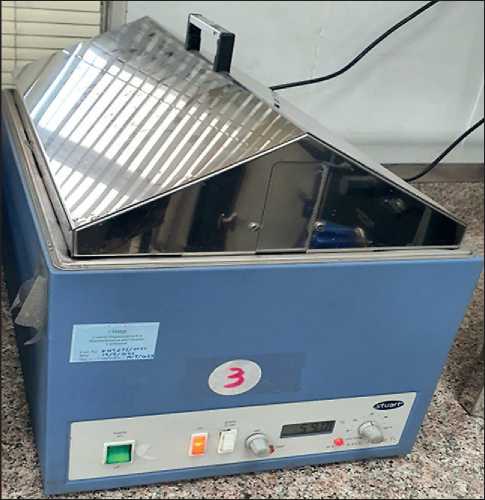
Fig. 2. Water path used in this research for curing samples at atmospheric pressure and heating temperature 60oC (140oF)
Fig. 2. The entire process of preparing cement mixtures was carried out at room temperature. The procedure was performed in accordance with API Spec. 10A, 2019 [5].
After a specified time (8 hours), all samples were removed from the curing bath and the cubes were removed from the molds. The samples were dried at room temperature for 24 hours. Cement samples were crushed and sieved. Studies of the morphology and microstructure and phase composition of the formed hydrates were carried out using X-ray diffraction patterns (XRD-6000 Shimadzu with an incident angle of 0.154 nm using Cu-Kα radiation), Fourier transform infrared spectra (FTIR) (Sgimadzu model 1800, Japan) and atomic force microscopy (NaioAFM 2022, Nanosurf, Switzerland).
RESULTS AND DISCUSSION
Analysis of cement powder by infrared spectra
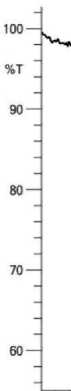
Spectroscopy analysis of four mixtures (pure cement and with nano zeolite additives Z 0.5%, Z 1% and Z 1.5%) is presented below. Four samples were ground into powder and tested to study surface properties in terms of chemical bonds between molecules. In Fourier transform infrared spectroscopy analysis, the horizontal axis of the infrared (IR) spectrum is denoted as wavenumber (1/cm) and covers the range from 400 cm–1 at the far right to 4000 cm–1 at the far left, scaling by a factor of 2 at 2000 cm–1. The vertical axis, denoted as percent transmittance (%T), ranges from 0 at the beginning of the y-axis to 100 at the
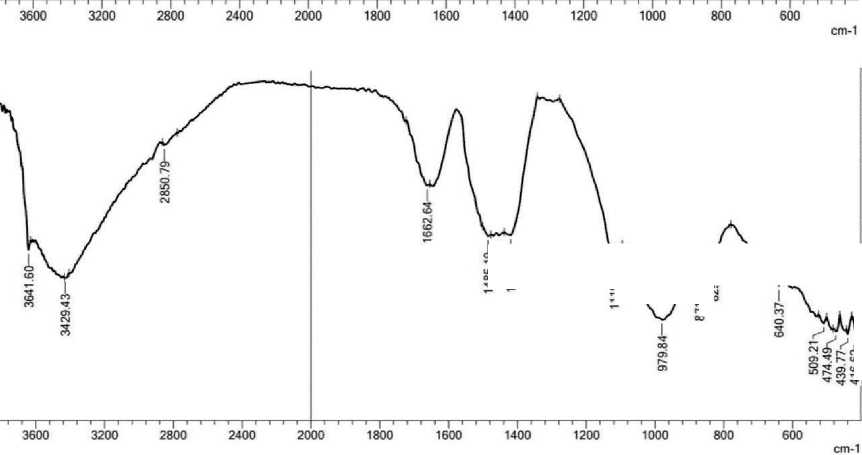
THE STUDY OF THE PROPERTIES OF NANOMATERIALS top. Characteristic peaks in the infrared spectrum were identified [6]. Some chemical elements in cement have different functional groups; including H2O, Al–O, Si–O, SO4–2, CO3– and OH–, are active in the infrared range [7]. The transmission spectra of pure cement mortar and cement with different amounts of nano-zeolite are shown in Fig. 3 (a, b, c and d, respectively).
From Fig. 3(a), it can be seen that the band value at 3641.60 cm–1 decreases to 424.34 cm–1, which suggests the formation of C–S–H gel. From Figure 3 (b), (c) and (d) with the addition of nano-zeolite, the band value between 3641.60 cm–1 and 3637.75 cm–1 decreases to 416.62 cm–1 at 0.5% nano-zeolite and 420.48 cm–1 at 1.5% nano-zeolite. It can be seen that the lowest band value is observed with the addition of 0.5% nano-zeolite, and a decrease in the band value means a decrease in free water and an increase in the strength of the system. All peak values are given in Table. 1.
Spectral analysis of all solution samples revealed the presence of broad bands in the range from 3641.60 to 3637.75 cm–1. These bands can be attributed to overlapping stretching vibrations of the structural OH groups of portlandite Ca(OH)2, resulting from the hydration process involving C3S and C2S. The band associated with nano zeolite (Z 1.5%) decreased as the hydration process progressed, indicating a decrease in the presence of unbound water and the formation of C–S–H bonds [7,8].
The waveband in the range of 3417.86-3444.87 cm–1 is often associated with OH stretching of water molecules bound to the cement matrix. The wavelength range of cement mortar without nano-zeolite had a reduced size compared to cement containing nano-zeolite. This re-
.^s
4E6Z8
U——Z8X8
LfcoL 二
L96LW
—EmL8H
^s^
v— 冃符寸 C9E
AZB96
-WKS
-og・L 备
а
八 Ng .95
Fig. 3. IR spectrum of cement mixtures with nano-zeolite: a – Net cement, b – Cement with 0.5% nano-zeolite; c – Cement with 1% nano-zeolite; d – Cement with 1.5% nano-zeolite
^ss
VIS ^«
ULL
IG.67L
I6Llri8H
b
THE STUDY OF THE PROPERTIES OF NANOMATERIALS
c
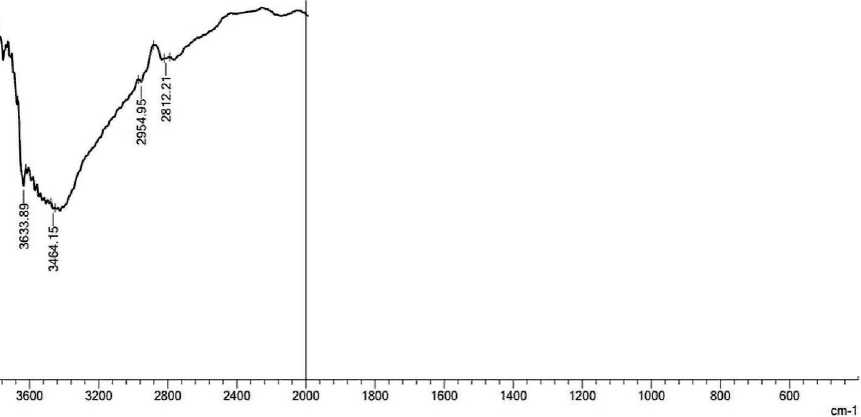
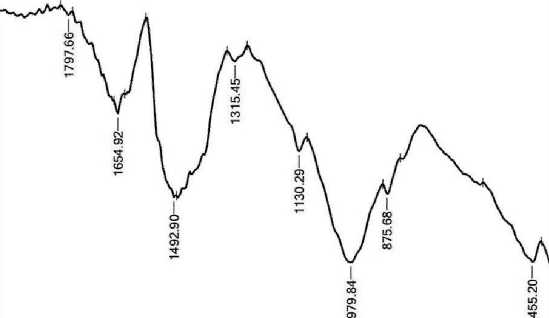
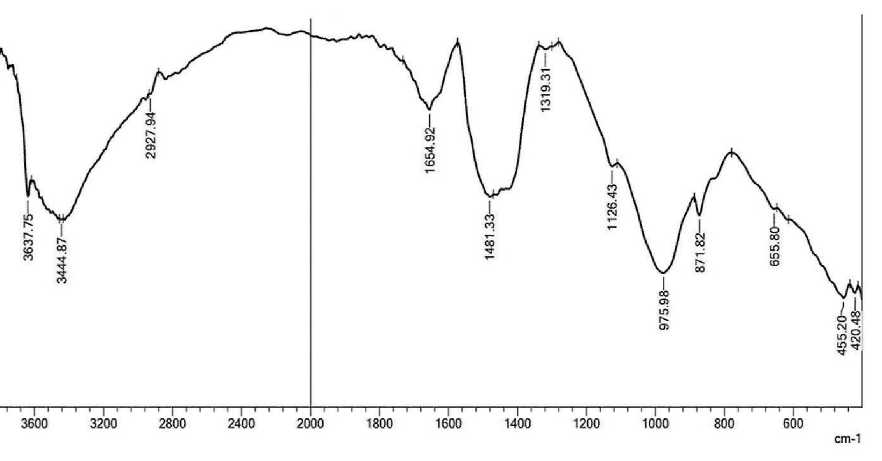
Fig. 3. IR spectrum of cement mixtures with nano-zeolite: a – Net cement, b – Cement with 0.5% nano-zeolite; c – Cement with 1% nano-zeolite; d – Cement with 1.5% nano-zeolite
sult suggests that the hydration phase at this particular location was more effective for cement without any additives [8, 9].
The observed peaks at 2835.36–2927.94 cm–1 can be attributed to the stretching vibrations of the OH and CH molecular groups. These peaks indicate a decrease in the presence of unbound water molecules [10]. The bond between cement and nano-zeolite (Z 1%) became asymmetrical with respect to other samples with a wave number of 2954.95 cm–1 due to the appearance of the wave number later than that of the other samples, but the trends are the same for all. The spectral band observed in the wavenumber range from 1654.92 to 1658.78 cm–1 may be associated with the bending vibration of the H–O–H fragment within the molecular structure of H2O [11]. The observed wavelength range of 1419.61 cm–1 is attributed to the presence of CO3–2 in pure cement and nano-zeolite (Z 0.5%). The appearance of calcium carbonate (CaCO3) may be due to the absorption of carbon dioxide (CO2) from the environment during sample hydration. The absorption peak of calcium carbonate (CaCO3) is observed at 1480 cm–1, which can be explained by the consumption of hydroxyl groups (CH) and calcium silicate compounds (C–S–H) in this spectral region [12, 13]. At a wavelength of 1319.31 cm–1 for nano zeolite (Z 1.5%), sulfur (S) exhibits vibrational bands corresponding to (S-O) bond
THE STUDY OF THE PROPERTIES OF NANOMATERIALS
Table 1
The influence of nano-zeolite on the IR spectroscopy of cement stone
|
Net Cement |
Z 0.5% |
Z 1% |
Z 1.5% |
Approximate description |
|
3641.60 |
3641.60 |
3633.89 |
3637.75 |
Overlapping stretching vibrations of structural OH groups of Ca(OH)2 |
|
3417.86 |
3429.43 |
3464.15 |
3444.87 |
OH stretching of water molecules bound to the cement matrix |
|
2835.36 |
2850.79 |
2954.95 |
2927.94 |
Stretch vibrations of molecular groups O–H and C–H |
|
1658.78 |
1662.64 |
2819.21 |
1654.92 |
H–O–H bending vibration |
|
1481.33 |
1485.19 |
1797.66 |
1481.33 |
CO3–2 |
|
1419.61 |
1419.61 |
1657.92 |
1319.3 |
CO3–2 and (S–O) relationship |
|
1118.71 |
1118.71 |
1492.90 |
1126.43 |
Si–O bonds C2S and C3S |
|
968.27 |
979.84 |
1315.45 |
975.98 |
Si–O bonds |
|
871.82 |
871.82 |
1130.29 |
871.82 |
CO3–2 |
|
829.39 |
829.39 |
979.84 |
655.80 |
Bending CO3–2 and Si –O–Si , or Al–O–Al |
|
667.37 |
640.37 |
875.68 |
455.20 |
The deformation of SiO4 occurs in the shape of a tetrahedron and becomes clearer |
|
470.63 |
509.21 |
455.20 |
420.48 |
|
|
424.34 |
474.49 |
|||
|
439.77 |
||||
|
416.62 |
-
[14]. The bands observed at 1118.71–1126.43 cm–1, with the exception of the nano zeolite additive bond (Z 1%), are attributed to the bending in-plane vibrations of Si–O bonds in C3S and C3A. This means the formation of Ettringite, which in experiments occurred at 8 hours of age [15, 16].
The fundamental difference between hydrated and non-hydrated cement samples is the shift in the Si–O stretching mode from the absorption peak of 968.27 cm–1 in non-hydrated cement to 979.84 cm–1 in hydrated cement [7]. Bands in the frequency range of 871.82 cm–1 for (pure cement, cement with nano zeolite 0.5% and cement with nano zeolite 1.5%) and connection at 829.39 cm–1 for (pure cement and cement with nano zeolite 0. 5%) are attributed to the CO3–2 ion, and the out-of-plane bends of CO3 correspond to vibrations of C–O bonds in CH and CaCO3 resulting from the interaction of Ca(OH)2 and CO2 present in the atmosphere [8,13]. The band at 655.80 cm–1 for cement containing (1.5%) nano-zeolite is due to asymmetric and symmetric stretching of Si–O–Si or Al–O–Al deformation vibrations [11,17]. The presence of a band in the range of 400–500 cm–1 in all samples can be explained by the deformation of the SiO4 tetrahedron, which becomes more distinct. The crystal structure of Alite (C3S) or Belite (C2S) suggests the arrangement of SiO4 groups in a tetrahedral ring. The infrared spectra of all silicates show two prominent peaks at 1000 and
500 cm–1, which are thought to correspond to the two active frequencies of the tetrahedral point group [11, 18].
X-ray diffraction analysis
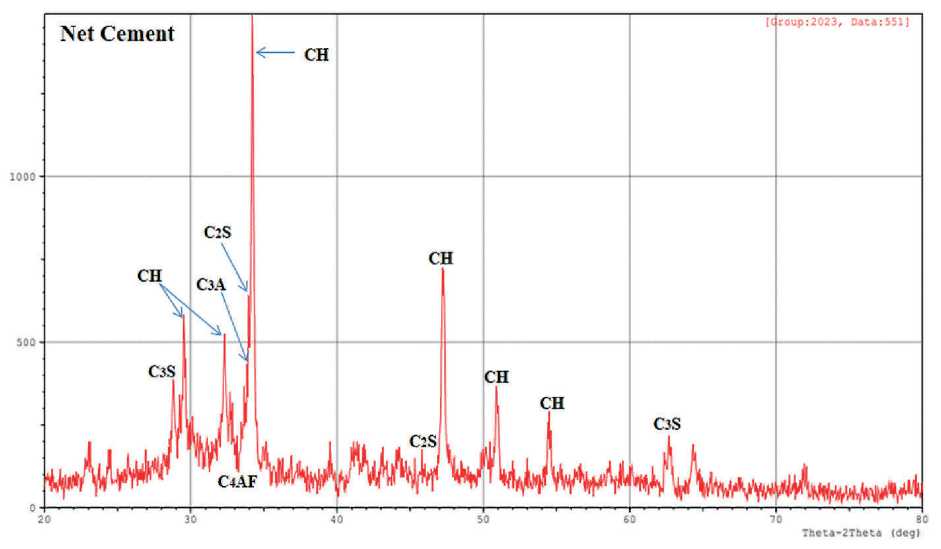
The XRD method allows the identification of the main phases of crystalline hydration. X-ray profiles were used to analyze the mineral composition of pure cement stone and hardened cement with (0.5%, 1% and 1.5%) nano-zeolite after curing for 8 hours in a bath at 60oC. The results are presented in Fig. 4.
From the X-ray diffraction patterns of the samples, it is clear that calcium hydroxide Ca(OH)2 marked CH, characteristic peaks of 2-Theta (29.561, 32.330, 34.231, 47.244, 50.918 and 54.473), Tricalcium silicate (Ca3SiO5, abbreviated to C3S), characteristic peaks of 2-Theta (29.244 and 62.740), Dicalcium Silicate Hydrate (Ca2SiO4•H2O, abbreviated C2S), characteristic peak 2-Theta (46.989), Aluminate (CaO•Al2O3, abbreviated C3A), characteristic peak 2-Theta (32.730) and Ferrite (CaO•Al2O3•Fe2O3, marked C4AF), characteristic 2-Theta peak (33.958) [19, 20].
The highest peak intensity at 2-Theta (34.231 and 47.244) is due to calcium hydroxide CH, which decreases with the addition of nano-zeolite. This phenomenon elucidates the pozzolanic behavior of nano zeolite, which reacts with precipitated calcium hydroxide upon hydration
THE STUDY OF THE PROPERTIES OF NANOMATERIALS to form C–S–H, reduces the calcium hydroxide content of the layered structure and increases C–S–H. As a result, the addition of nano-zeolite to Portland cement affects the early hydration process of the cement stone and improves its early strength. In addition, the possibility of calcium carbonate CaCO3 may occur due to partial carbonation of portlandite.
Since the mixtures were prepared simultaneously for all cement samples, random carbonation due to the reaction of calcium hydroxide with atmospheric carbon dioxide occurred to the same extent for all samples. This observation was also confirmed by IR spectrum analysis. Due to the presence of only a limited number of broad and weak diffraction peaks in C–S–H X-ray diffraction
70 80
K : cgp : 2Q23, 0&ti;55)]
Net Cement
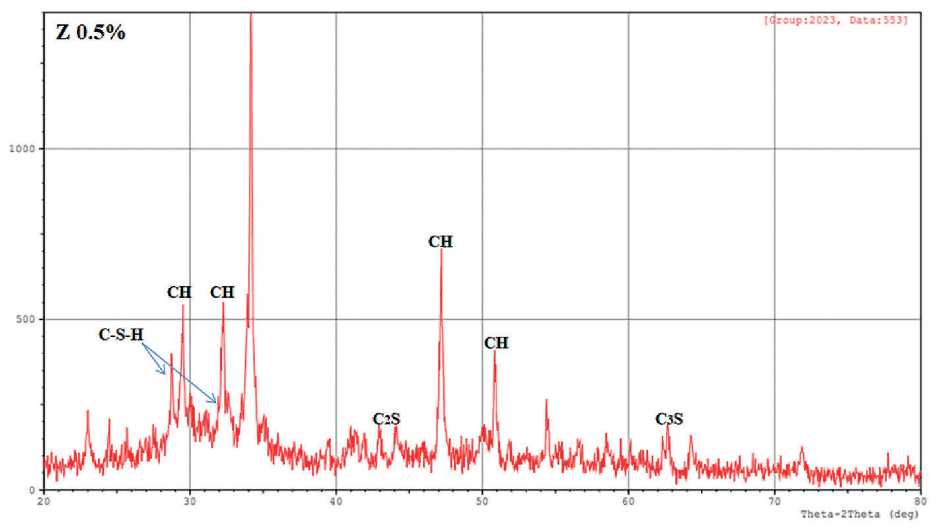
Fig. 4. X-ray patterns of four samples of cement stone with and without nano zeolite
THE STUDY OF THE PROPERTIES OF NANOMATERIALS
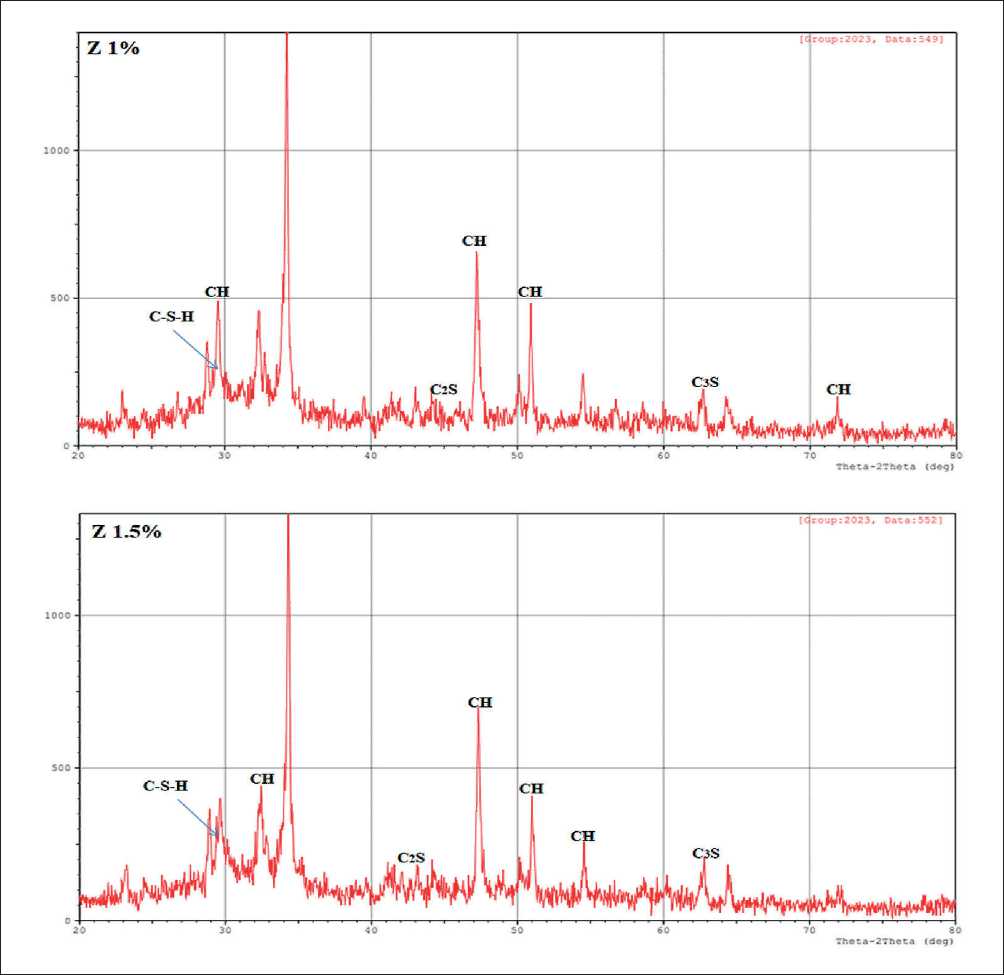
Fig. 4. X-ray patterns of four samples of cement stone with and without nano zeolite
patterns, this phase is often called X-ray amorphous. This term suggests that the C–S–H crystal structure does not exhibit any organized arrangement over long distances [21]. However, according to published data, X-ray diffraction patterns (XRD) of C–S–H consistently show peaks at certain angles in 2-Theta (7.4, 16.7, 29.1, 32, 49.8, 55, 66.8), which are mainly asymmetrical [22, 23]. According to this and from the XRD data table (main data processing), 4 C–S–H patterns were recorded for the samples, 2 patterns in nano-zeolite 0.5%, and the remaining 2 patterns appeared in nano-zeolite 1% and 1.5% with integrated intensity. The formation of calcium silicate hydrate occurs due to the interaction of C3S or
C2S with water. The result material (C–S–H) is often called a gel rather than a crystalline substance due to the lack of a regular structure that can be seen using X-ray diffraction. Its composition can vary, but it usually contains about twice as much CaO as SiO2, as well as a small amount of water [24].
AFM analysis of the surface of nanostructures
Atomic force microscopy was used to study the topography and surface morphology of the samples under study at the nanoscale. A 3D image of the surface roughness of the samples is shown in Fig. 5.
THE STUDY OF THE PROPERTIES OF NANOMATERIALS
Nanoparticles affect the cement structures in the samples, causing the formation of multifaceted agglomerates. AFM topography spectra of the samples show the presence of mud cracks above a uniformly smooth and flat surface layer, which is covered by nano volume structures including nano zeolite particles. Upon closer inspection, these images show that the nanoparticles propagate along these cracks and appear to increase the surface layer’s resistance to deformation and stress relaxation in cementbased materials. In addition, they promote viscoelastic C–S–H behavior as evidenced by topography.
Figure 5 show that the surface roughness has the appearance of a complex structure with many peaks and valleys of different sizes and distances from each other. According to ISO 25178 and from the AFM surface roughness table data, the height parameters describing the surface morphology are; (Sq) RMS height; (Ssk) Surface asymmetry of limited scale; (Sku) Surface kurtosis of limited scale; (Sp) Maximum peak height of a limited scale surface; (Sv) Maximum height of a surface failure of a limited scale; (Sz) maximum height of a limited scale surface; And; (Sa) arithmetic mean of the surface height of a limited scale. Table 2 show the parameter values.
The distance between different texture components can be described using the parameters Sa and Sq, which are optimized to describe the peaks and valleys of the surface [25]. Similarly, the value of Ssk reflects the de- gree of displacement of the roughness shape. The Sku value of a roughness profile shows how sharp it is. Sp, Sv and Sz are parameters obtained by analyzing the absolute largest and smallest points found on the surface under study [25, 26]. From the table 2 it follows that with increasing values of Sa and Sq for the surface, the size of the cement grains will be high. This can be seen when using Z 1% nano zeolite by the surface peaks and valleys in Fig. 5 and height values in table 2. In addition, low values of Sa and Sq can help reduce matrix porosity and increase its strength. This manifestation in a matrix with 1.5% nano zeolite is clearly visible both in the figure and in the lowest values of Sa and Sq in the table [25, 27]. The symmetry of peaks and valleys is described by Ssk. If Ssk = 0, then the peaks and valleys are evenly distributed around the mean plane. If Ssk < 0, then valleys predominate on the surface (Ssk in Z0.5% nano zeolite is less than 0). On the contrary, if Ssk > 0, then the surface is dominated by peaks. Sku is a metric that quantitatively characterizes the degree of surface sharpness. In general, when Sku = 3, this indicates that the surface has a balanced distribution of both smooth and jagged peaks and valleys. If the Sku value is less than 3, then the surface consists mainly of flattened peaks and valleys with relatively significant curvature at the edges. This may indicate a lower probability of crack initiation under stress compared to surfaces with sharp peaks and
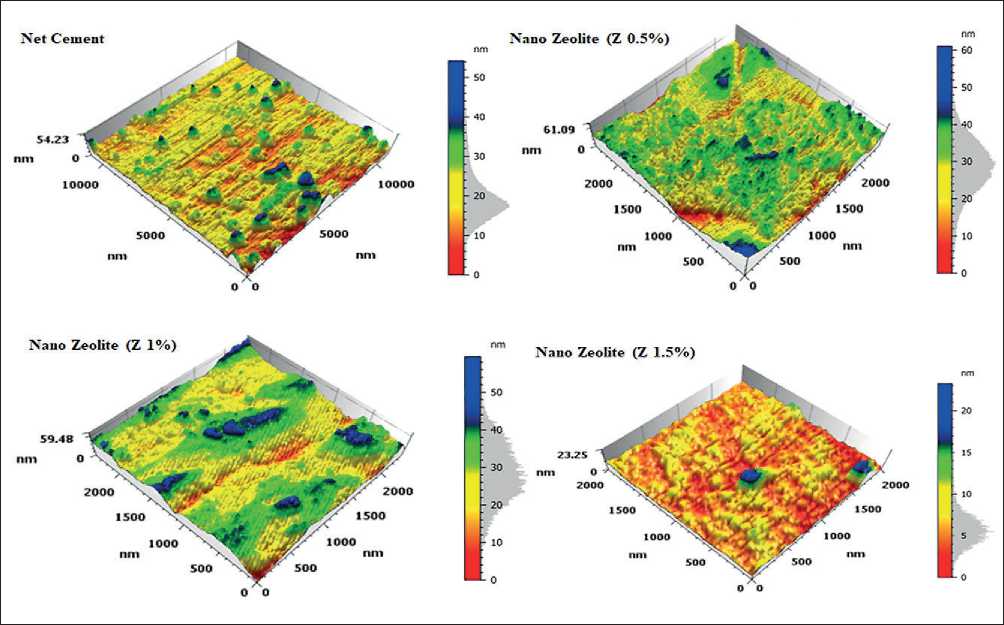
Fig. 5. AFM images of cement samples without nano zeolite (pure cement) and with nano zeolite (0.5%, 1%, 1.5%)
THE STUDY OF THE PROPERTIES OF NANOMATERIALS
Table 2
Surface roughness parameters for cement and additives
CONCLUSION
The results showed that when nano zeolite is added, the content of calcium hydroxide CH decreases. This phenomenon explains the pozzolanic behavior of nano zeolite, which reacts with precipitated calcium hydroxide upon hydration to form C–S–H, reduces the layered structure of calcium hydroxide and increases C–S–H. Thus, the addition of nano zeolite to Portland cement affects the process of early hydration of cement stone and increases its early strength. AFM analysis showed that when 1.5% nano zeolite is introduced into cement, many irregular peaks and valleys of low porosity filler are formed, which increases the strength of the cement.
References Study on the influence of zeolite nanoparticles on selected properties of portland cement
- A. Peled, J. Castro, W.J. Weiss. Atomic force and lateral force microscopy (AFM and LFM) examinations of cement and cement hydration products. Elsevier, Cement and Concrete Composites. 2013: 36: 48-55. https://doi.org/10.1016/j.cemconcomp.2012.08.021
- G. Bell, J. Bensted, F. P. Glasser. Characterization of hydrothermally treated calcium silicate and oilwell cement hydration products. Advances in Cement Research. 1989: 2(6): 61-72.
- E. Koohsaryan, Mansoor A. Nanosized and hierarchical zeolites: A short review. Chinese Journal of Catalysis. 2016: 37: 447-467. https://doi.org/10.1016/S1872-2067(15)61038-5
- Luke et al., Zeolite-containing cement composition. Patent, US 2004/0112600 A1.
- API specification 10A, Cements and Materials for Well Cementing. 25th edition, 2019.
- Jemimah C. Milton, Prince A. Gnanaraj Compressive Strength of Concrete with Nano Cement. IntechOpen; 2021.
- Suman L. Shrestha. Characterization of Some Cement Samples of Nepal Using FTIR Spectroscopy. IJARCS. 2018; 5(7): 19-23. DOI: http://dx.doi.org/10.20431/2349-0403.0507004
- H. Biricika, N. Sarierb. Comparative Study of the Characteristics of Nano Silica – Silica Fume – and Fly Ash – Incorporated Cement Mortars. Materials Research. 2014; 17(3). https://doi.org/10.1590/S1516-14392014005000054
- Victor H. J. M. dos Santos, D. Pontin, Gabriela G. D. Ponzi, A. Sofia de Guimaraes e Stepanha, R. B. Martel, Marta K. Schütz, Sandra Mara O. Einloft, F. D. Vecchia. Application of Fourier Transform infrared spectroscopy (FTIR) coupled with multivariate regression for calcium carbonate (CaCO3) quantification in cement. Construction and Building Materials. 2021; 3(13): 125413. https://doi.org/10.1016/j.conbuildmat.2021.125413
- Y. R. Zhang, X. M. Kong, Z. B. Lu, Zi C. Lu, S. S. Hou. Effects of the charge characteristics of polycarboxylate superplasticizers on the adsorption and the retardation in cement pastes. Cement and Concrete Research. 2015; 67: 184-196. https://doi.org/10.1016/j.cemconres.2014.10.004
- Ping Yu, R. J. Kirkpatrick, B. Poe, Paul F. McMillan, X. Cong. Structure of Calcium Silicate Hydrate (C-S-H): Near-, Mid-, and Far-Infrared Spectroscopy. Journal of the American Ceramic Society. 1999; 82(3): 742-748.
- Omotayo O., Himanshu M., Ramadan A., Subhash S., Samuel O., Shokrollah H., G. DeBruijn, Winton C., Dave S. Degradation of well cement in HPHT acidic environment: Effects of CO2 concentration and pressure. Cement and Concrete Composites. 2016: 74: 54-70. https://doi.org/10.1016/j.cemconcomp.2016.09.006
- D. Vaiciukyniene, G. Skipkiunas, M. Dauksys, V. Sasnauskas. Cement hydration with zeolite-based additive. chemija. 2013; 24(4): 271-278. https://www.researchgate.net/publication/259580412
- M.J. Varas, M. Alvarez de Buergo, R. Fort. Natural cement as the precursor of Portland cement: Methodology for its identification. Cement and Concrete Research. 2005; 35: 2055-2065.
- A. Mohammeda, S. Rafiq, W. Mahmood, R. Noaman, H. AL-Darkazali, K. Ghafor, W. Qadir. Microstructure characterizations, thermal properties, yield stress, plastic viscosity and compression strength of cement paste modified with nanosilica. Journal of Materials Research and Technology. 2020; 9(5): 10941-10956. https://doi.org/10.1016/j.jmrt.2020.07.083
- Z. Ou, B. Ma, Sh. Jian. Comparison of FT-IR, Thermal Analysis and XRD for Determination of Products of Cement Hydration. Advanced Materials Research. 2011; (168-170): 518-522. https://doi.org/10.4028/www.scientific.net/AMR.168-170.518
- R. Ma, L. Guo, W. Sun, Zh. Rong. Well-Dispersed Silica Fume by Surface Modification and the Control of Cement Hydration. Hindawi. 2018: Article ID 6184105. https://doi.org/10.1155/2018/6184105
- L. Fernández-Carrasco, D. Torrens-Martín, L. M. Morales, S. Martínez-Ramírez. Infrared Spectroscopy in the Analysis of Building and Construction Materials. Infrared Spectroscopy – Materials Science, Engineering and Technology. https://www.intechopen.com/
- ASTM C 1365 - 98, Standard Test Method for Determination of the Proportion of Phases in Portland cement and Portland-Cement Clinker Using X-Ray Powder Diffraction Analysis, 1998.
- Taylor H.F.W. Cement chemistry. Thomas Telford, 2nd edition; 1997.
- S. Grangeon, F. Claret, Y. Linard, Ch. Chiaberge. X-ray diffraction: a powerful tool to probe and understand the structure of nanocrystalline calcium silicate hydrates. Acta Cryst. 2013; B69: 465-473.
- K. Garbev, G. Beuchle, M. Bornefeld, L. Black, P. Stemmermann. Cell Dimensions and Composition of Nanocrystalline Calcium Silicate Hydrate Solid Solutions. Part 1: Synchrotron-Based X-Ray Diffraction. Journal of the American Ceramic Society. 2008; 91(9): 3005- 3014.
- K. Garbev, M. Bornefeld, G. Beuchle, P. Stemmermann. Cell Dimensions and Composition of Nanocrystalline Calcium Silicate Hydrate Solid Solutions. Part 2: X-Ray and Thermogravimetry Study. Journal of the American Ceramic Society. 2008: 91(9): 3015-3023.
- Peter C. Hewlett, Martin Liska, Lea’s Chemistry of Cement and Concrete. Elsevier, 5th Edition; 2019.
- L. Sadowski, S. Czarnecki, J. Hoła. Evaluation of the height 3D roughness parameters of concrete substrate and the adhesion to epoxy resin. International Journal of Adhesion and Adhesives. 2016: 67: 3-13. https://doi.org/10.1016/j.ijadhadh.2015.12.019
- Keyence Corporation of America, Introduction to Surface Roughness Measurement; 2012. https://www.keyence.com/
- Z. Zhu, Sh. Lou, C. Majewski. Characterisation and correlation of areal surface texture with processing parameters and porosity of High Speed Sintered parts. Additive Manufacturing. 2020; 36: 101402. https://doi.org/10.1016/j.addma.2020.101402
- Richard Leach. Characterisation of Areal Surface Texture. Springer-Verlag Berlin Heidelberg; 2013.
