Studying 630 nm atomic oxygen emission sources during strong magnetic storms in the night mid-latitude ionosphere
Автор: Leonovich L.A., Tashchilin A.V., Lunyushkin S.B., Karavaev Yu.A., Penskikh Yu.V.
Журнал: Солнечно-земная физика @solnechno-zemnaya-fizika
Статья в выпуске: 2 т.5, 2019 года.
Бесплатный доступ
We analyze significant increases in 630 nm atomic oxygen night emissions during very strong geomagnetic storms, using optical measurements, theoretical modeling, and magnetogram inversion technique (MIT) data. It is shown that during strong magnetic storms when electron precipitation equatorial boundary at the night sector expands up to ~40°, the interaction of energetic electron flux with thermospheric components may cause extreme increases in the 630 nm emission intensity. Model calculations of the red line intensity show good agreement with observational data. Using the November 20, 2003 magnetic storm as an example, we have found that oxygen atom collisions with thermal Maxwell and superthermal electrons make a major contribution to the integral emission intensity. Thermospheric density variations during the magnetic storm significantly affect the red line generation.
Modeling, ionospheric disturbance, airglow, magnetic storm
Короткий адрес: https://sciup.org/142220333
IDR: 142220333 | УДК: 550.338 | DOI: 10.12737/szf-52201905
Текст научной статьи Studying 630 nm atomic oxygen emission sources during strong magnetic storms in the night mid-latitude ionosphere
Strong magnetic storms usually lead to a significant equatorward shift in the southern boundary of the auroral oval, along with magnetospheric convection and magnetospheric energetic electron precipitation zone. High geomagnetic activity causes the thermosphere to heat in the auroral oval. This higher temperature region can cover a fairly large longitude interval (~100°) in the night sector. It is natural to assume that its further movement to low latitudes together with the equatorial boundary of electron precipitation may cause noticeable changes in the intensity of thermospheric emissions, in particular of the 630 nm atomic oxygen red line.
Extreme increases in the night atomic oxygen red line emission during severe magnetic storms were observed at the latitude of Irkutsk (52° N, 104° E) [Gorely et al., 2002; Mikhalev, 2002; Degtyarev et al., 2003; Mikhalev et al., 2004] .
In this work, we have used observations of 630 nm atomic oxygen emissions obtained at the ISTP SB RAS Geophysical Observatory (52° N, 103° E). Intensities of these emissions were measured with the four-channel zenith photometer Fenix. Emission lines were identified using tilting interference filters (AX1/2~ 1-2 nm). The angular field of view of the photometer channels was ~4°—5° [Mikhalev et al., 2004].
Figure 1 shows the red line intensity enhancements recorded at the ISTP SB RAS Geophysical Observatory during three strong magnetic storms: November 20, 2003 ( K p =9, Dst min =–472 nT), March 17, 2015 ( K p =9, Dst min = – 223 nT), and March 31, 2001 ( K p =9, Dst min = – 387 nT). The intensity of red line emission disturbance during these storms varied from 3 to 20 kR. The papers [Cole, 1970; Fishkova, Martsvaladze, 1985; Tinsley et al., 1986] have examined the possible mechanisms of emission excitation at midlatitudes during magnetic storms, associated with the influence of high-energy particles on the thermosphere. Rassoul [1993] has identified three main types of such energetic particles leading to the generation of thermospheric auroras at middle and low latitudes: energetic neutral hydrogen and oxygen atoms with an energy of several keV, arising from the charge exchange of protons with hydrogen atoms, energetic ions, and low-energy electrons in two energy ranges E ~10–1000 and E <10 eV.
Tashchilin, Leonovich [2016] have studied variations in the intensity of night red and green atomic oxygen emission lines for moderately disturbed geomagnetic conditions at midlatitudes, using optical measurements and modeling. It was shown that under these conditions dissociative recombination of molecular oxygen ions plays an important role in the generation of atomic oxygen emission.
Energetic electron precipitation causes an increase in the temperature and density of thermal Maxwell electrons, which, colliding with oxygen atoms, provide an additional excitation source for the 1D level.
In this paper, we report the study’s results of the disturbance mechanisms in the red atomic oxygen line intensity during strong magnetic storms by the example of the November 20, 2003 superstorm.
In a number of studies [Mikhalev et al., 2002; Ebihara et al., 2005; Alex et al., 2006; Pokhotelov et al., 2008; Mishin et al., 2018] , various manifestations of the November 20, 2003 superstorm in the magnetosphereionosphere system have been examined. Ebihara et al. [2005] , simulating the evolution of ring and field-aligned currents, have obtained that the equatorial boundary of the auroral oval expanded to the 40° geomagnetic latitude, i.e. the inner plasma sheet approached Earth to L ≤ 1.5. Pokhotelov et al. [2008] , using DMSP-F13, F15 measurements of drift velocities, have found that during the storm main phase the equatorial boundary of ionospheric convection at the midnight side was below the 30° geomagnetic latitude.
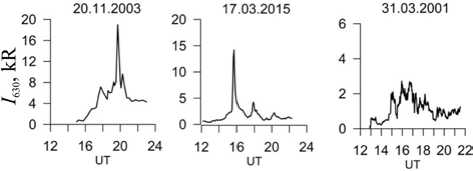
Figure 1. Variations in red-line emission intensity during three severe magnetic storms: November 20, 2003, March 17, 2015, and March 31, 2001
Mishin et al. [2018] have assumed that during this magnetic storm there were red auroras of two types, generated by low-energy particles precipitating from the auroral oval: diffuse aurora (16:00–19:40 UT), and type d aurora (19:50–23:30 UT). Moreover, an increase in the 630 nm emission intensity may be due to the heat inflow into the ionosphere, which is formed by the interaction of ring current hot particles with background electrons of cold ionospheric plasma.
MODELING
The behavior of the ionosphere during the November 20, 2003 magnetic storm was modeled by calculating variations of plasma parameters in a closed geomagnetic flux tube whose footpoint in the Northern Hemisphere was at a height of 110 km at a point with the geographic coordinates of the ionospheric station Irkutsk (52.5 ° N, 104.0 ° E; L =1.8).
The calculations were made using the numerical model of ionosphere-plasmasphere coupling [Krinberg, Tashchilin, 1984; Tashchilin, Romanova, 1995, 2002] , which describes properties of thermal plasma consisting of electrons, atomic ions Н+, N+, O+, He+, H+, and molecular ions N,O + , NO + . The cycle of the chemical reactions considered and respective coefficients of reaction rates are presented in [Tashchilin, Leonovich, 2016] . The model numerically solves the system of non-stationary equations for particle balance and thermal plasma energy along geomagnetic field lines. The ion density N + is calculated in the approximation of photochemical equilibrium, whereas densities of other ions are computed taking into account processes of photoionization, recombination, transfer along geomagnetic field lines under the ambipolar diffusion and drag of ions by the horizontal neutral wind. Rates of photoionization of thermospheric components and energy spectra of primary photoelectrons are calculated using the reference spectrum of UV solar radiation EUVAC [Richards et al., 1994] . To consistently determine electron and ion temperatures in the model heat-balance equations, we account for thermal conductivity processes along geomagnetic field lines and thermal energy exchange between electrons, ions, and neutral particles due to elastic and inelastic collisions.
Superthermal electron (STE) fluxes with energies E>1 eV heat thermal electrons and are the main source both of the secondary ionization and of excited atoms and molecules in the thermosphere. The model consistently calculates STE spectra in an energy range from 1 to 104 eV and a height range from 110 to 700 km by solving the kinetic equation for STE transfer in conjugate ionospheres with regard to energy losses during their passage through the plasmasphere [Krinberg, Tashchilin, 1984; Tashchilin, Leonovich, 2016]. The kinetic equation takes into account two sources of superthermal electrons — UV solar radiation photoionization, which produces photoelectrons, and the collisional (corpuscular) ionization of thermospheric components N2, O2, O, by energetic electrons precipitating from the magnetosphere. The beam of precipitating electrons is set at the upper boundary of the ionosphere (h=700 km) in the form of the pitchangle isotropic spectrum with Maxwellian energy distribution:
4Р
I ( E ) = -P- E exp E av
—
2 E
E av
cm –2 s –1 eV –1 ,
where E is the energy; P e is the integral precipitating electron energy flux; E av is the average electron energy in the beam. Variations in the precipitation parameters P e and E av during the storm are determined using the magnetogram inversion technique (MIT) [Bazarzhapov et al., 1979; Mishin, 1990] . Variations in the integral energy flux are shown in Figure 2, a , and the obtained average energy values E av~2–3 keV [Mishin et al., 2018] .
The spatio-temporal variations in temperature and densities of neutral components N, N 2 , O, O 2 , H, He are described using the global empirical model of the thermosphere NRLMSISE00 [Picone et al., 2002] . Horizontal thermospheric wind velocities are estimated by the HWM07 model [Drob et al., 2008; Emmert et al., 2008] . In the most disturbed interval from 16 to 20 UT, the NRLMSISE00 model gives very low (5–8 times compared to observations) thermospheric density values [Liu, Lühr, 2005] . Therefore, in this time interval the NRLMSISE00 model was corrected by the thermospheric density values measured near 400 km on board the CHAMP satellite [Liu, Lühr, 2005] .
The correction was conducted by varying the exosphere temperature and N 2 , O, O 2 densities at a height of 120 km, using an analytical thermospheric model [Prölss, 1980] .
The red-line volume emission is calculated from the following equation:
P (1D) –3 –
П 630 = A 630[O( D)] = A 630 photon^cm s ,
L 630
where A 630=0.0071 s– is the Einstein coefficient (probability of O( D) spontaneous emission); L 630 is the probability of D deactivation due to spontaneous emission and quenching by collisions with N 2 , O 2 , O neutrals and electrons; (P( D) is the production rate of the O( D) exited state, which under night mid-latitude conditions results from the following processes [Rees, Roble, 1986] :
-
1) O atom–thermal Maxwell electron collisions:
O ( 3P ) + eT ^ O ( 1 D ) + eT;
-
2) O + molecular ion dissociative recombination:
O + + eT ^ O ( 1 D ) + O ( 1 D ) ;
-
3) O atom–superthermal electron collisions:
O ( 3P ) + e * ^ O ( 1 D ) + e * .
The integral red line emission intensity (in Rayleigh) is determined by the expression
h *
-
— 6 1 diss Te STE
I 630 = 10 A 630 J [O( D)] dh = I 630 + I 630 + I 630 , h 0
DISCUSSION OF MODEL RESULTS
According to the model studies [Rees, Luckey, 1974; Rees, Roble, 1986; Tashchilin, Leonovich, 2016] , the generation of the atomic oxygen emission in the red line is most effective at low-energy energy ( E ≤ 1 keV) electron precipitation. For this reason, the red line intensity calculated from the above P e and E av variations, obtained from MIT data, is by an order of magnitude lower than measured values. We assume that the reason for the discrepancy is the incorrect application of MIT to the determination of characteristics of the low-energy part of the electron precipitation spectrum. The electrons cannot penetrate to h ~100–150 km and therefore do not contribute to integral conductivities, used to calculate the precipitating electron spectrum characteristics. We therefore make an assumption that the precipitation spectrum in the 16–20 UT period had soft (average energy E S v < 1 keV) and hard (average energy E a H > 2 + 3 keV ) components. In this case, the hard component was identified by MIT, whereas the soft precipitation appeared only in the red line emission above ~200 km.
To test this assumption, we calculate the temporal variation of the red line intensity in the 16–20 UT interval of substorm activation. This variation might have been caused by the soft precipitation component. Real values of the average energy of soft precipitation E aSv being unknown, at the time when the condition P e≥2 mW/m2 held the E aSv iteration was performed for the 16–20 UT interval until the best match was obtained between calculated and measured values of the red line intensity. In other moments of time, we set E a S v = 0.2 keV. In this case, throughout the model interval we assume that the integral energy flux is consistent with MIT data, which agrees with observations of energy fluxes in soft precipitation [Rees, Luckey, 1974; Rees, Roble, 1986] . According to the calculations, satisfactory agreement between model data and red line observations was obtained at
E’ » 0.3 - 0.- keV. av
The analysis of geomagnetic activity variations during the November 20, 2003 magnetic storm has shown that there were three active periods (substorm activations) of different intensities during the geomagnetic disturbance in the 16–22 UT interval [Mishin et al., 2018] . These periods are characterized by the appearance of energetic electron precipitation at midlatitudes, 630 nm emission intensity enhancement, and by an increase in the level of geomagnetic pulsations. The first, strongest activation occurred at the end of the main phase, at ~17:30–18:00 UT; and the two subsequent, less powerful activations occurred in the early recovery phase, at ~19:00–19:30 UT and ~21:30 UT.
Figure 2, b shows thermospheric temperature variations during the storm, obtained as a result of NRLMSISE00 model correction based on the thermospheric density values, measured near 400 km on board the CHAMP satellite [Liu, Lühr, 2005] . Figure 2, a depicts the time variation in the density of precipitating electron energy flux at the Irkutsk latitude, which was calculated by MIT [Mishin et al., 2018] .
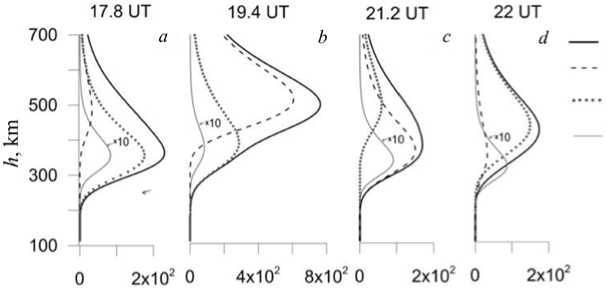
Consider vertical and temporal variations in characteristics of the red line emission in the ~16–22 UT interval, i.e. during substorm activations. Figure 3 shows vertical profiles of the red-line volume emission V O(1D) and its three main components caused by dissociative recombination of molecular oxygen ions (hereinafter denoted by V O(diss)), collisions of oxygen atoms with thermal Maxwell and superthermal electrons (designated as V O( T e ) and V O(STE) respectively) for four moments of universal time: 17.8, 19.4, 21.2, 22 UT.
These moments correspond to the above periods of substorm activations. Figure 3 indicates that the main processes of the O(1D) level excitation during the November 20, 2003 superstorm are collisions of oxygen atoms with superthermal electrons and thermal Maxwell electrons. The dissociative recombination contribution is insignificant. Vertical distributions of corresponding volume emissions have a layered structure with a pronounced maximum. Volume emission maxima and their heights change during the storm. Referring to Figure 3, these changes cause the main mechanism of red line generation at fixed heights to change.
Consider the temporal variations in ionospheric characteristics and volume emission maxima (Figure 4) obtained from the model calculations.
Parameters of the F2-layer maximum begin to change immediately after the start of precipitation, at ~16:30 UT (Figure 4, a , b ), in the form of increasing electron density N em to ~2.5·105cm–3. The height of the layer is set to ~400 km. In the time interval between the first two activations 18.2–19.0 UT, precipitating stops (see Figure 2, a ) and the F2 layer goes up rapidly to ~600 km.
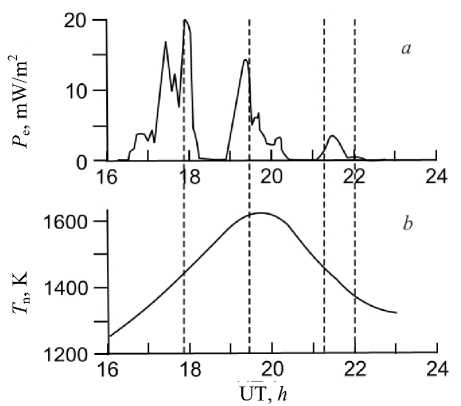
Figure 2. Precipitating electron energy flux density P e at a height of 700 km ( a ) and thermospheric temperature variations Tn at a height of 300 km ( b ) during the November 20, 2003 magnetic storm. Vertical dashed lines mark the moments in the intervals of substorm activations, presented in Figure 3
Then, at ~19.0 UT, the second activation starts, an ionization source appears, and the F2 layer goes down to ~470 km. The density N em varies little since the rate of electron-ion gas recombination at such large heights is rather low [Krinberg, Tashchilin, 1984] .
Variations in volume emission maxima V O(STE), generated by collisions of oxygen atoms with precipitating superthermal electrons, and heights of its maximum h m V O(STE) are shown in Figure 4, e , f respectively. As expected, the volume emission maxima correlate well with the density of precipitating electron energy flux P e (see Figure 2, a ) because its source is the excitation of the 1D level at collisions of oxygen atoms with all precipitating superthermal electrons passing through the thermosphere. The height of volume emission maxima h m V O(STE) gradually increases from 360 to 390 km in the first two activation intervals, i.e. till ~20.0 UT, and then gradually decreases to 370 km (see Figure 4, f ). This behavior of h m V O(STE) can be explained as follows. It is known that in the exponential atmosphere by analogy with photoionization the corpuscular ionization rate is maximum at a height where the flux of incoming electrons decreases 2.7 times. When the electron beam passes through matter, the electron absorption efficiency increases with increasing electron density of the matter. Thus, an increase in the atmospheric density should lead to an increase in the height of maxima of both corpuscular ionization and volume emission. Referring to Figure 2, b, during the storm the thermosphere heats reaching T n ≈ 1600 K at ~20.0 UT, thereby causing, due to thermal expansion, a marked increase in the thermospheric density at fixed heights and thus an increase in h m V O(STE) .
Variations in volume emission maxima V O( T e ), generated by collisions of oxygen atoms with thermal Maxwell electrons of ionospheric plasma, and height of its maximum h m V O( T e) are shown in Figure 4, g , h . It should be noted that in the isotropic distribution of thermal Maxwell electrons, the 1D atomic oxygen level can be excited only by electrons with E > 1.96 eV, the density of which increases as the electron temperature T e increases. The main role is therefore played by energetic electron isotropization converting directed beam energy into thermal Maxwell electron energy. This process is most effective when energies of precipitating and thermal Maxwell electrons become comparable. Accordingly, the faster the precipitating electrons lose their energy in collisions with neutral atoms and molecules and get into the spectral region with low energies, the higher is the probability of conversion of their energy into thermal one. Thus, from the above qualitative discussion we can conclude that the increase in the density of the thermosphere during its thermal expansion causes the electron temperature to increase. This is clearly seen in Figure 4, c , d , demonstrating a sharp increase in T e at heights of volume emission maxima h m V O(STE) and h m V O( T e ) during the second substorm activation (~19.4 UT) when increases in the density and heating of the thermosphere become maximum (Figure 2, b ). As a result, the volume emission maxima V O( T e ) increase rather sharply during the second activation (see Figure 4, g ).
volume emission total O(‘P)+eT-‘O('D)+et O('P)+c—O('D)+c' O2'+e,-4)(D)+O('D)
VO( D), photoncm 3-s"'
Figure 3. Vertical profiles of the red-line volume emission for 17.8 ( a ), 19.4 ( b ), 21.2 ( c ), 22 UT ( d ). The solid black line indicates the total volume emission V O( 1 D); the dashed line is the contribution made by collisions of O atoms with thermal Maxwell electrons V O( T e ); the dotted line is the contribution made by collisions of O atoms with superthermal electrons V O(STE); the solid gray line is the contribution of the ion dissociative recombination O 2 + V O(diss) multiplied by 10.
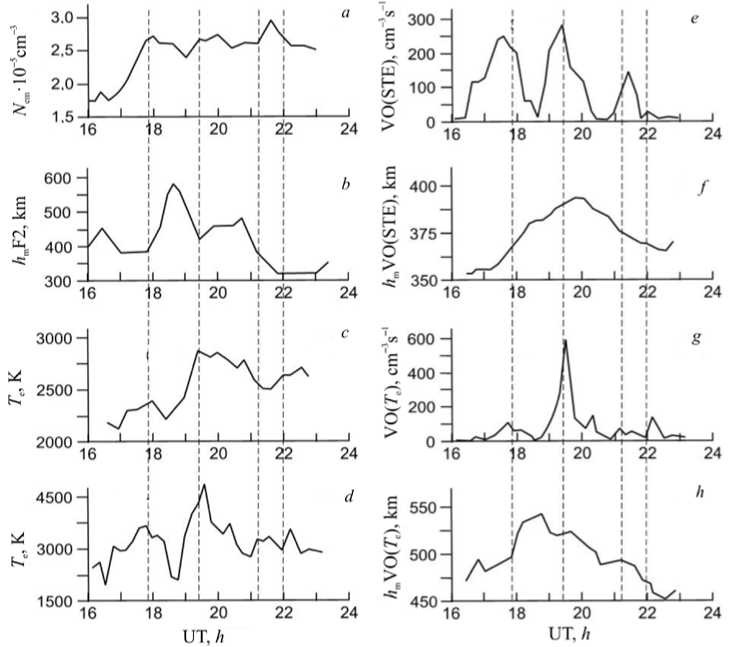
Figure 4. Temporal variations in ionospheric parameters and volume emission during the storm: density and height of maximum density of the F 2 layer ( a , b ); electron temperature at heights of volume emission maxima V O(STE) and V O( T e ) respectively ( c , d ); volume emission V O(STE) and height of its maxima hV O(STE) ( e , f ); volume emission V O( T e ) and height of its maxima ( g , h ). Vertical dashed lines mark the moments in the intervals of substorm activations (see Figure 3)
As a final result of the study of 630 nm atomic oxygen emission sources, in Figure 5 we compare the calculated integral red line emission intensity with that measured at the ISTP SB RAS Geophysical Observatory. The model results are seen to be in good agreement with observations.
CONCLUSION
The study of sources of the extreme increase in night 630 nm emission intensities at midlatitudes during strong magnetic storms, carried out with the aid of numerical simulation by the example of the November 20, 2003 storm, has allowed us to draw the following conclusions.
-
1. During strong magnetic storms when the equatorial boundary of electron precipitation in the night sector shifts to ~40° midlatitudes, extreme increases in the 630 nm red line emission intensity may occur due to the interaction between energetic electron beam and thermospheric components.
-
2. Model calculations of the red line intensity have shown good agreement with observations. Using the November 20, 2003 magnetic storm as an example, we have established that collisions of thermal Maxwell and superthermal electrons with oxygen atom make the main contribution to the integral emission intensity.
-
3. An essential role in the red line generation is played by an increase in the thermospheric density under its thermal expansion during the magnetic storm.
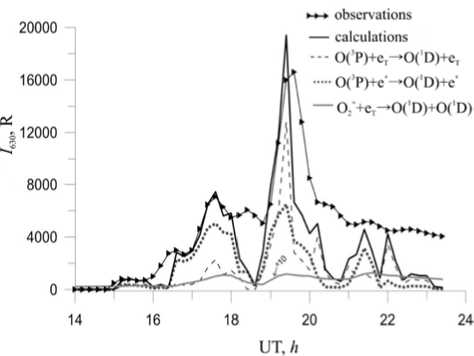
Figure 5. Variations in the integral 630 nm atomic oxygen emission and its components during the November 20, 2003 magnetic storm: the line with triangles indicates measurements; the solid line is the calculated total emission; the dashed line is the calculated contribution made by collisions of oxygen atoms with thermal Maxwell electrons; the dotted line is the calculated contribution made by collisions with superthermal electrons; the solid gray line is the calculated contribution made by dissociative recombination of molecular ions O 2
The work was supported by the Russian Foundation for Basic Research, Project No. 19-05-00665. In the paper, we used experimental data obtained using the optical equipment of Center for Common Use “Angara”, ISTP SB RAS.
Список литературы Studying 630 nm atomic oxygen emission sources during strong magnetic storms in the night mid-latitude ionosphere
- Alex S., Mukherjee S., Lakhina G.S. Geomagnetic signatures during the intense geomagnetic storms of 29 October and 20 November 2003. J. Atmos. Sol. Terr. Phys. 2006, vol. 68, no. 7, pp. 769-780 DOI: 10.1016/j.jastp.2006.01.003
- Bazarzhapov A.D., Matveev M.I., Mishin V.M. Geomagnetic Variations and Storms. Novosibirsk, Nauka Publ., 1979. 248 p..
- Cole K.D. Magnetospheric processes leading to mid-latitude aurora. Annales de Géophysique. 1970, vol. 26, no. 1, pp. 187-193.
- Degtyarev V.I., Mikhalev A.V., Jiyao Xu. Nightglow variations in East Siberia during March 31 -April 4 2001 magnetic storm. Optika atmosfery i okeana . 2003, vol. 16, no. 5-6, pp. 552-556..
- Drob D.P., Emmert J.T., Crowley G., Picone J.M., Shepherd G.G., Skinner W., et al. An empirical model of the Earth's horizontal wind fields: HWM07. J. Geophys. Res. 2008, vol. 113, iss. A12, CiteID A12304. DOI: 10.1029/2008 JA013668.
- Ebihara Y., Fok M.C., Sazykin S., Thomsen M.F., Hairston M.R., Evans D.S., et al. Ring current and the magnetosphere-ionosphere coupling during the superstorm of 20 November 2003. J. Geophys. Res. 2005, vol. 110, iss. A9, CiteID A09S22
- DOI: 10.1029/2004ja010924
- Emmert J.T., Drob D.P., Shepherd G.G., Hernandez G., Jarvis M.J., Meriwether J.W., et al. DWM07 global empirical model of upper thermospheric storm-induced disturbance winds. J. Geophys. Res.: Space Phys. 2008, vol. 113, iss. A11, CiteID A11319
- DOI: 10.1029/2008JA013541
- Fishkova L.M., Martsvaladze N.M. On dynamics of HI 656.3 and 630 nm in the upper atmosphere during magnetic storms with sudden commencement. Geomagnetizm i aeronomiya . 1985, vol. 25, no. 3, pp. 509-511..
- Gorely K.I., Karakchiyev V.D., Iyevenko I.B., Alekseyev V.N., Mikhalev A.V., Beletsky A.B. Simultaneous optical observations of the strong magnetic storm on March 31, 2001 in Moscow, East Siberia and Yakutia. Solnechno-zemnaya fizika . 2002, iss. 2, pp. 265-266..
- Krinberg I.A., Tashchilin A.V. Ionosfera i plazmosfera . Moscow, Nauka Publ., 1984, 177 p..
- Liu H., Lühr H. Strong disturbance of the upper thermospheric density due to magnetic storms: CHAMP observations. J. Geophys. Res.: Space Phys. 2005, vol. 110, iss. A9, CiteID A09S29
- DOI: 10.1029/2004JA010908
- Mikhalev A.V. Night behavior of the 630 nm emission in midlatitude auroras during severe magnetic storms. Solar-Terrestrial Magnetic Activity and Space Environment. COSPAR Colloquia Ser. 2002, iss. 14, pp. 295-297.
- Mikhalev A.V., Beletsky A.B., Kostyleva N.V., Черниговская M.A. Midlatitude airglows in the south of East Siberia during intense geomagnetic storms on October 29-31 and November 20-21, 2003. Kosmicheskie issledovaniya . 2004, vol. 42, no. 6, pp. 616-621..
- Mishin V.M. The magnetogram inversion technique and some applications. Space Sci. Rev. 1990, vol. 53, no. 1, pp. 83-163
- DOI: 10.1007/bf00217429
- Mishin V.V., Lunyushkin S.B., Mikhalev A.V., Klibanova Yu.Yu., Tsegmed B., Karavaev Yu.A., et al. Extreme geomagnetic and optical disturbances over Irkutsk during the 2003 November 20 superstorm. J. Atm. Solar-Terr. Phys. 2018, vol. 181, pp. 68-78
- DOI: 10.1016/j.jastp.2018.10.013
- Picone J.M., Hedin A.E., Drob D.P., Aikin A.C. NRLMSISE-00 empirical model of the atmosphere: Statistical comparisons and scientific issues. J. Geophys. Res.: Space. Phys. 2002, vol. 107, iss. A12, CiteID 1468. 10.1029/2002JA009430
- DOI: :10.1029/2002JA009430
- Pokhotelov D., Mitchell C.N., Spencer P.S.J., Hairston M. R., Heelis R. A. Ionospheric storm time dynamics as seen by GPS tomography and in situ spacecraft observations. J. Geophys. Res.: Space. Phys. 2008, vol. 113, iss. A3, CiteID A00A16
- DOI: 10.1029/2008ja013109
- Prölss G.W. Magnetic storm associated perturbations of the upper atmosphere: recent results obtained by satellite-borne gas analyzers. Rev. Geophys. 1980, vol. 18, no. 1, pp. 183-202
- DOI: 10.1029/RG018i001p00183
- Rassoul H.K., Rohrbaugh R.P., Tinsley B.A., Slater D.W. Spectrometric and photometric observations of low-latitude aurorae. J. Geophys. Res. 1993, vol. 98, iss. A5, pp. 7695-7710
- DOI: 10.1029/92JA02269
- Rees M.H., Luckey D. Auroral electron energy derived from ratio of spectroscopic emissions. 1. Model computations. J. Geophys. Res. 1974, vol. 79, no. 34, pp. 5181-5186
- DOI: 10.1029/JA079i034p05181
- Rees M.H., Roble R.G. Excitation of O(1D) atoms in aurorae and emission of the 6300 Å line. Canad J. Phys. 1986, vol. 64, no. 12, pp.1608-1613
- DOI: 10.1139/p86-284
- Richards P.G., Fennelly J.A., Torr D.G. EUVAC: A solar EUV flux model for aeronomic calculations. J. Geophys. Res. 1994, vol. 99, no. A5, pp. 8981-8992
- DOI: 10.1029/94ja00518
- Tashchilin A.V., Romanova E.B. UT-control effects in the latitudinal structure of the ion composition of the topside ionosphere. J. Atmos. Terr. Phys. 1995, vol. 57, no. 12, pp. 1497-1502
- DOI: 10.1016/0021-9169(94)00146-f
- Tashchilin A.V., Romanova E.B. Numerical modeling the high-latitude ionosphere. Proc. COSPAR Colloquia Ser. 2002, vol. 14, pp. 315-325.
- Tashchilin A.V., Leonovich L.A. Modeling nightglow in atomic oxygen red and green lines under moderate disturbed geomagnetic conditions at midlatitudes. Solar-Terr. Phys. 2016, vol. 2, iss. 4, pp. 94-106
- DOI: 10.12737/24276
- Tinsley B.A., Bohrbaugh R., Rassoul H., Sahai Y., Teixeira N.R., Slater D. Low-latitude aurorae and storm time current systems. J. Geophys. Res. 1986, vol. 91, no. A10, pp. 11257-11269
- DOI: 10.1029/JA091iA10p11257

