Survival Analysis of Computers at a University’s Computer Laboratory and Implication on Maintainability

Author: Timothy Simpson, Joseph Danso, John Awuah Addor, Stephen Graham Anaman
Journal: International Journal of Education and Management Engineering @ijeme
Article in issue: 2 vol.14, 2024.
Free access
Research has shown that, after extensive use, digital devices like computers often suffer performance declines, and some even experience sudden, complete breakdowns without warning. This phenomenon is particularly disturbing for individuals who heavily rely on these devices to carry out critical tasks. Although researchers have extensively probed the causes of computer breakdowns, detailed parameters influencing the lifespan of computers remain underexplored. This paper, therefore, aims to estimate the probability associated with the continuous functioning or failure of a computer system over a specified duration, and to examine risk factors associated with failure. Delving into the mysteries of computer longevity, data on 100 computers in a designated lab at an academic environment were examined. Data was drawn from maintenance records as well as in-depth hardware assessments. Analysis revealed that, after a 4-year period of active usage, 73 of the computers remained operational, while 27 had malfunctioned. Survival analysis methods were employed to determine the probability of computers failing at specific points in time and to identify various factors contributing to early computer failure. The findings disclosed that at the two-year mark, the probability of computers remaining operational is 80%, decreasing to 62% at the three-year juncture. The median survival time was established at 3 years and 4 months. Furthermore, an analysis of causative factors revealed that computers with faulty motherboards and power supply units associates with a lower rate of survival, while computers with issues of hard drives, operating systems, and miscellaneous components has a higher rate of survival. This study provides comprehensive data-driven evidence that offers insights on the need to implement maintenance strategies to proactively extend the lifespan of computers.
Survival Analysis, reliability, computers, failure, lab, Cox Proportional Hazard Model
Short address: https://sciup.org/15019304
IDR: 15019304 | DOI: 10.5815/ijeme.2024.02.02
Text of the scientific article Survival Analysis of Computers at a University’s Computer Laboratory and Implication on Maintainability
In this era of digitalization, computers have permeated into every facet of our lives. Computers can be found at home, schools, offices and factory floors [1, 2]. They are applied to perform basic functions such as typing documents, basic computations, conduct online communication, research to complex function such as programming and computer- assisted operations. Almost every workplace utilizes computers for one task or the other. For instance, banks use it to maintain accounts, manage securities and transactions; hospitals use computers to keep patient and aid in surgeries; factories use it to control modern machines and equipment; government agencies use computers to provide government service to the citizenry; office secretaries use computers to prepare memos, and reports. Educational institutions use computers as tool for academic work [1]. Its ability to store large amount of data as well as process millions of complex instructions within a short period of time makes computers extremely useful [1, 2]. When connected to the internet, computers become a great worth of knowledge resource for research and lifelong learning.
Computers are very useful, but they are also unreliable and can break down at any time. Researchers have attributed this phenomenon to software hardware and software problems [3]. Error messages on the screen can be early warning signs of a system crash. Sometimes systems fail without any visible warning signs. The dependence on unstable technologies, like computers, continues to be a major cause for worry, especially for people who depend on them to carry out both routine and critical work. It impedes business operations causing significant interruption during restorations efforts. The impact of computer system failure ranges from mild to severe. Cascading effects include unavailability of computer resources, data loss, and loss of control, cost implications and reputation damage. Businesses which rely on centralized computer operations are likely to experience total halt in operations should the unexpected happens.
Experts have attempted to put in measures aimed at mitigating the impact of computer malfunction or failure. This includes investing in software or hardware fault tolerance mechanisms to reduce impact of computer system loss. Other efforts include installation of antivirus, employment of in-house IT personnel to perform timely backup and recovery procedures as well as investing in additional redundant hardware [4].
Despite adjustments done by IT experts and suggestions from researchers to prolong availability of computer systems like any other useful electrical device, computers tend to malfunction without any indication or event warning [5].
The reasons for computer system failure have been studied for decades by researchers. Research reviews have identified causative factors and patters which cause computers to malfunction or fail [3]. For instance, the authors of the study in [4] examined the interaction between hardware and software in relation to system reliability. They discovered that the probability of computer system failing is three times attributable to both software and hardware errors combined than that of software errors only. The discovery by the authors had since become a template for intelligent prediction and system recovery. The study in [5] also attributed computer failure and malfunction to operating system (OS) errors and hardware defects. It was revealed that software errors are more common than hardware errors but hardware errors are devastating and are harder to diagnose. In the article [6], Nussbaumer catalogued the causes of computer failure to failed hardware parts, faulty software, faulty user input or environmental causes. Other research studies attribute computer failure causes to hardware ageing, software glitches, power supply problems, excessive heat-up of devices such as RAM and CPU, short-circuit due to accumulation of dust on motherboard, corrupted hardware devices, unstable operating systems, thrashing, inability of application/software to write and access memory addresses [4, 5, 6].
The numerous instances of computer malfunction that hamper with its use for academic work at the university served as the inspiration for this study. The University community use computers as a tool do research, teach student and perform academic work in general. The impact of online learning became even more evident when schools closed during the COVID-19 pandemic. Students and teachers had to rely on computers to deliver and receive lessons [7].
Takoradi Technical University (TTU), a university in the Western Region of Ghana, was used as a case study in this research. TTU offers specialized courses in engineering, applied sciences, art technology, and business [8]. These courses prepare students for careers in the productive sectors of industries in the Western Region, which is known for its natural mineral extraction operations.
For students in the tertiary institutions to fit into the world of work in this current global technological era, it is imperative that they gain quality training in the use and application of computers. The university therefore has computer laboratories for use by students for computer lessons. Observation at the university revealed that computer resources were overstretched due to increase in the number of students. To compound already exacerbating situating, computers at the lab develop faulty components and eventually break down after few years of active use. This results in large number of students unable to access computers for lessons. Management is therefore compelled to channel scarce competing financial resources to purchase computers to replace broken down ones. This therefore puts a cost burden on both the management and students of the university. Repair measure to restore computers puts a lot of workload on the limited in-house IT technicians. Much time is spent on recovery efforts in bringing back computers to normal state for use.
Decades of research findings have already identified a number of factors which leads to this phenomenon. Patterns attributable to hardware errors, software errors and environmental condition have been observed as the leading causes of computer malfunction or failure. Although the causes of computers failure and malfunction have been studied, identified and catalogued by past researchers, there is limited information in the literature in respect of appropriate statistical method to reveal the duration and exact period within which failure event occurs. Although researchers have extensively probed the causes of computer breakdowns, detailed parameters influencing the lifespan of computers remain underexplored.
This research study therefore adds to the body of knowledge on causes of computer breakdown. It goes further to conduct a time-to-events analysis which seeks to assess the lifespan of computers in a computer lab and factors leading to early failures of computers. By identifying the risk factors, it is possible to propose mitigating measures that can be taken to prevent frequent breakdown. This will extend the lifespan of computers to improve their performances in academic and other institutions.
The paper is structured into five sections namely Introduction, Literature Review, Materials and Methods, Results and Discussion and Conclusion. The literature review next examines scholarly research works relating computer systems faults and survival analysis.
2. Literature Review 2.1. Computer system fault and failure diagnosis
This literature review is divided into two parts. They include computer system fault and failure diagnosis and survival analysis associated applications.
The computer system is made of components that work together as a unit in order for it to function. Smooth interoperability between computer hardware and software components makes computer systems usable and fit for purpose. However, just like any electrical device, computers are susceptible to malfunctioning of parts, faults, as well as total failure or breakdown in the course of operation. A failure in one part may affect other parts. Hardware failure may result in software glitches whiles software errors also cause anomalies in hardware performance [9]. A faulty computer system tends to have rippling effect on persons who depend on its operations to carry out tasks. It hampers productivity, leads to data loss and cost implications. A number of research studies have been conducted to explore issues surrounding computer system failure/breakdown.
The study [10] researched into the causes of failure and breakdown of computers in Nigeria. They observed that breakdown of computers could be attributed to hardware component malfunction, software errors, user negligence and poor handling by unskilled maintenance personnel. In order to pinpoint the exact major cause of computer breakdown, they conducted a survey to elicit information from computer users. It came to light from the analysis that virus infections, unskilled maintenance technicians as well as local socio-economic /environmental factors are major causes of computer breakdown. Miscellaneous causes were also identified as being inconsistent power supply, and tropical temperate weather conditions, dust, heat environment that computers operate under. The authors therefore proposed a number of remedies to address these. They proposed skilling up of personnel who handle computers via training workshops, establishment of servicing centers with qualified maintenance personnel, regular scanning of pc for virus infections. They advocated that manufactures should consider environmental conditions prevalent in various countries where they market their computer products. This study highlighted the major cause of computer breakdown in African region which is similar to that observed in this current study.
The study [9] considered the overall interactions that exist between hardware and software components which lead to either a proper functioning or failure of a computerized system. The authors used design specification of a system yet to be built-in to predict the possibility of a computer system malfunctioning when the entire system is eventually built. They used the specification to build a model and performed simulations on it. They were able to eventually come out with an early reliability and availability prediction model. They acknowledged that hardware operations impact on software operations and vice versa. Their findings again revealed that degradation of hardware components due to fatigue, temperature, electrical stress; design susceptibility configurations have an impact on software operations. Statistic presented in that study showed that 35% of software glitches may be attributed to hardware faults. On the other hand, software bugs may lead to hardware/device failure. Although their research appeared theoretical, in reality, enlightened users to appreciate interactivity conditions that computers are likely to be faced with in a live environment, so that developer can incorporate measures to forestall such when it eventually occurs in the future.
The study [11] researched into causes of system-level hardware failure at data centers. It was discovered that sudden server failure rarely happens, but when it does, the downtime it causes can lead to disastrous effects leading to losses running into thousands of US dollars. There are a number of components which causes server-breakdown according to the study. Components that cause server breakdown were categorized as HDD, Miscellaneous, Memory, Power and Raid Card. With failure rate of 81.84%, Hard disk was identified to be the leading cause of serverbreakdown whiles the other components scaled down with a failure rate of less than 10%. At system level, it was possible to read, monitor and measure safety-critical attributes of server components using the Self-Monitoring Analysis and Reporting Standard (SMART) provided by manufacturers to evaluate the risk of potential future failure. However, these vendor-specific threshold measurements found on devices tend to show some level of inaccuracy, because it was incapable of combining attributes with time series data to effectively predict potential system failure. The authors therefore proposed and experimented with a novel deep-learning prediction model on data of two leading causes of server breakdown that is disks and memories. Real world dataset from Black blaze data center was used for the experiment. Outcome was compared with widely used random-forest and long short-term memory (LSTM) models. Results showed that the proposed model was effective in practice and was able predict potential system failure with accuracy better than random-forest and LSTM by 28%. The model was able to predict HDD failures in time for system administrators to take precautionary measures. To avoid catastrophic system failures, the authors recommended that potential hardware at risk of failure can then be isolated, and data backed up. The findings of this study identified HDD failure as having a catastrophic impact on users especially when they in computer servers, which is in sharp contrast to the findings of this current study which reveals HDD as having a less impact on users when they are in computers at a computer laboratory.
2.2. Survival Analysis Applications
3. Materials and Methodology
3.1. Conceptual framework
Literature abounds with research studies involving the use of Survival Analysis. Survival analysis examines the effect of different risk factors and uses them to predict the duration of time between one event and another. The most popular SA models are Kaplan Meier Estimates and Cox proportional regression. It was first applied to investigate important occurrences in the domains of biology and medicine, but it has since been proven to be helpful in time-to-event and reliability studies in engineering and other social life events [12]. This review explores scholarly articles on application of in the area of medicine, finance and engineering.
Significant number of studies on biomedical health research relied on Survival Analysis models to analyze and report health related findings [13]. It has enabled the assessment of clinical outcomes for disease progression and treatment efficiency [14]. The authors of the study in [15] focused on survival analysis of heart failure patients who were admitted to Institute of Cardiology and Allied hospital in Pakistan. Using Cox regression on factors that possibly contributed to mortality, he discovered that age, renal dysfunction, blood pressure, ejection fraction and anemia were significant risk factors for mortality among heart failure patients. The author used Kaplan Meier plot to study the general pattern of survival which showed high intensity of mortality in the initial days and then a gradual increase up to the end of study.
In the area of finance, the study in [16] utilized survival analysis in the study the risk of loan defaults. The authors compared loans guaranteed by bank and loan guaranteed by Mutual Guarantee Institutions (MGI). Using the Survival Analysis’Cox proportional hazards model, the authors discovered that loans given out to firms and individuals using MGI are more likely to be in default than banks. The authors therefore concluded that banks are better positioned to screen applicants thoroughly and monitor loans requested by firms till recovery better than that of MGIs.
In the area of engineering, [14] applied Survival Analysis to investigate failure associated with power cables. The researcher adopted Cox Proportional Hazard model and Weibull distribution model as their methodology to identify and analyze significant factors that lead to cable failure. The authors were able to discover a case of poor manufacturing quality cable against poor installation procedure.
The study [17] investigated the factors contributing to the failure of IT system of the banking industry. Using in Bangladesh as a case study, the authors adopted set theory to produce a unique framework to identify and prioritize the factors responsible for the failure of IT systems. Among the eleven failure factors which were identified, their research revealed that cyber-attack, database hack risks, server failure, network interruption, broadcast data error, and virus effect were the most significant factors responsible for the failure of the IT system. The framework developed in the research was recommended to be useful for managers in facilitating in crucial decision-making efforts. It could also be adopted to assist decision-making efforts in other service industries where IT systems play a vital role. This study also applies the use of survival analysis for non-biological subjects, that is, computers.
This study adopts a framework inferred from review of scholarly articles on Survival Analysis. Failure is referred to in this study as the inability of the entire computer system to serve its purpose. Malfunction refers to computer crash with likely repairable, replaceable (hardware parts) or reinstall-able (software issues) component. Below is a diagram that represents the conceptual framework adopted for this study.
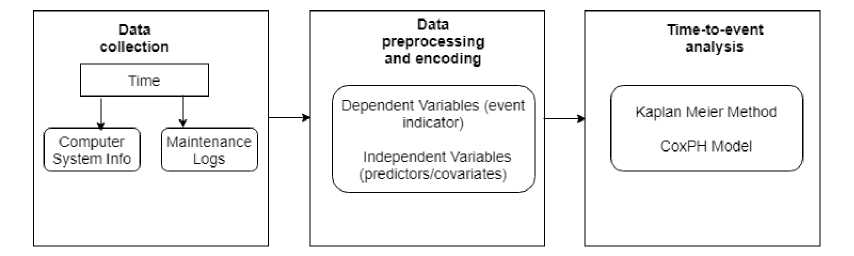
Fig. 1. Conceptual framework on Survival analysis
Unlike other statistical analysis methodologies, survival analysis enables incomplete or missing data to be treated as subjects that remained event-free during the period of study and it is unknown whether an event has or has not occurred after the study ended. Partially observed events are therefore classified as censored data [18].
Fig. 2. Censoring
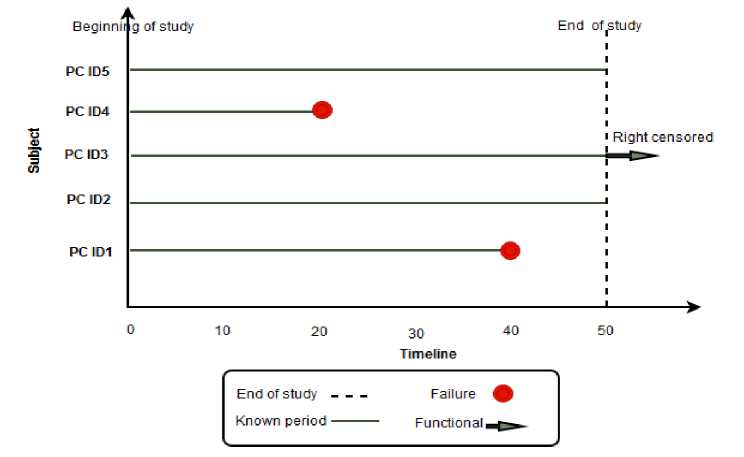
Figure 2 is an illustration of censorship in survival analysis data. Five subjects, in this case, computers (PC) with ID numbers 1 to 5 entered the study at the same time. Computers with ID1 and ID4 experienced the event before the end of study. All subjects began at the same time. No subject was taken out from the study before the event. Subjects with ID2, ID3 and ID5 did not experience events before the end of the study hence are right censored.
-
3.2. Data
The major focus of this study is to study the probability of a computer system breakdown and the various factors that lead to the early failure of computers. Information regarding event occurrences was therefore gathered. Data was gathered from maintenance log files kept and expert diagnosis of computers at lab within a 4 -year period (2017-2020). The period was dissected into months. Some estimation consistent was done to fill in missingness of data element. Computers which were identified as working were classified as censored observations. All the computers at the lab did have the same specifications. Every computer set was connected to UPS of 1000VA capacity. All the computers at the two major computer labs have processor speed of 3.7 Gigahertz with a 500 Gigabyte hard disk storage space and a 4GB of memory. The back of the system unit was designed to accommodate peripherals such as ports for mouse, network, speaker’s keyboard and extra USBs. The computer system came with a detached peripheral input and output devices; specifically, a 15 inch LCD display monitor, keyboard and mouse. These computers were connected to the main power via UPS. The UPS was to provide stable power related problems as surges, spikes, and brownouts. It was also to sustain power loss temporarily to the system unit when mains go off.
-
3.2.1 Data preprocessing
Table 1. Computer System Specification at the computer lab
|
Device |
Element |
Specification |
|
System Unit |
Processor (CPU) |
Core i3 3.7GHz |
|
Memory (RAM) |
4 GB |
|
|
Hard Disk |
500 GB |
|
|
Peripheral |
Mouse |
USB |
|
Keyboard |
Qwerty Keyboard |
|
|
Monitor |
15 inch LCD |
|
|
UPS |
UPS |
1000 VA |
Duration indicates the length of study period. The duration is for a 4-year period and the unit of measurement is in month. The event indicator tells whether a computer breakdown/failure occurred or not. Risk factors considered as predictors to failure were the statuses of repair, HDD, motherboard, power supply unit, miscellaneous components, and operating system.
Table 2 shows the representation of variables used in this study.
Table 2. Variable definitions and interpretation
|
Variable |
Explanation |
|
Survival Time |
Duration of study until an event occurs. Unit of measurement is in months. |
|
Event |
Event of interest. 1 represent failure event has occurred while 0 represent censored event. |
|
Repair |
Repairs. Major maintenance is represented by 1 and regular maintenance is represented by 0. |
|
HDD |
Storage drive. 1 represent faulty HDD, 0 represent functional HDD. |
|
Motherboard |
Motherboard. 1 represent faulty motherboard, 0 represent functional motherboard. |
|
Power Supply |
Power supply. 1 represent faulty power supply unit, 0 represent functional power supply unit. |
|
miscellaneous |
Miscellaneous. 1 represent faulty miscellaneous components, 0 represent functional miscellaneous components. |
|
OS |
Operating System. 1 represent faulty operating system, 0 represent functional operating system. |
Table 2, shows variables and explanation of how the variables are represented in the study. Survival time is in months. In summary, predictor variables repair, HDD, Motherboard, Power supply, Miscellaneous and OS are represented with binary values 1 and 0. 1 indicate functional component whiles 0 represents non-functional component.
Table 3. First 10 dataset elements
|
Survival time(months) |
event |
repair |
HDD |
motherboar d |
Power supply |
miscellaneo us |
OS |
|
|
1 |
43 |
1 |
1 |
1 |
1 |
1 |
1 |
1 |
|
2 |
42 |
1 |
0 |
1 |
1 |
1 |
0 |
1 |
|
3 |
48 |
0 |
1 |
0 |
1 |
0 |
1 |
1 |
|
4 |
37 |
1 |
0 |
0 |
0 |
1 |
0 |
1 |
|
5 |
32 |
1 |
0 |
0 |
1 |
1 |
0 |
1 |
|
6 |
32 |
0 |
1 |
0 |
0 |
0 |
0 |
0 |
|
7 |
30 |
0 |
1 |
0 |
1 |
1 |
0 |
1 |
|
8 |
22 |
0 |
0 |
0 |
0 |
0 |
0 |
1 |
|
9 |
16 |
1 |
0 |
0 |
1 |
1 |
0 |
0 |
|
10 |
18 |
1 |
1 |
0 |
1 |
1 |
0 |
1 |
Table 3 shows first 10 records of dataset used for this study. A copy of entire dataset can be obtained from GitHub repository via the address The fields of interest are, survival times, event of interest as well as risk factors HDD, motherboard, power supply unit, miscellaneous components, and operating system. The first computer experienced an event after 43 months of observation. The third computer did not experience an event after 48 months (4 years).
In summary, 27% of computers at the lab experienced an event. 22 major repairs and 78 routine maintenance were done. 5 HDDs experienced a breakdown, 29 motherboards suffered a malfunction. 5 computers diagnosed had issues with miscellaneous hardware parts. 56 computers had operating system software errors with 42 experiencing no issues with the operating system.
-
3.3. Method
In order to meet the objective of the study with detailed interpretation of observed and partially observed events, Survival analysis’ Kaplan Meier estimator function and Cox Proportional Hazard model (CoxPH) were used. Kaplan-Meier estimator method is a non-parametric model that takes the ratios of computers that are at risk of failure and multiplies that over time. It is a formula that estimates the survival function. The survival function at any particular time t is the probability of survival beyond t. It is denoted as S ( t ) = pr[ r > t ] . It is a non-increasing step function with steps only at times of at least one failure. The Kaplan Meier and Cox Proportional Hazard techniques have been widely used to study the survival of recurrent events [15, 16, 19]
At any specific time interval [t), the survival probability is calculated as the number of computers surviving ( nj - dj )divided by the computers at risk П} a tj . The total probability of survival S ( t )until that time interval is calculated by multiplying all probabilities at all-time intervals preceding that time. It is written mathematically as
S (t} ) = n ', where nj
S(tj)= Survival Function n = number of computers at the start or number of computers at risk prior to time t d =number of computers that failed.
Kaplan- Meier product limit estimator is used in this study to make comparisons between survival rates at different levels by predictor variables.
Cox proportional Hazard model is a semi-parametric survival analysis model that has been widely used by most researchers in recent past due to its versatility and simplicity in nature of interpreting data results. It has gained popularity in medical research to examine joint effects of multiple factors such as patient’s health information on survival. In other words, it is a model that attempt to estimate the time it takes a hazard to occur. A hazard is an unwanted event such as a machine breaking down, bankruptcy or a death event in actuarial modeling.
The Cox proportional hazard model has two components. The first part is the baseline hazard, and the other is the exponential term used to produce different hazard rates for each independent factor based on which covariate groups they belong to. It can be expressed mathematically as
( h i( t ) = h o ( t ).exp I Е р л I
V i = 1 J
This can be interpreted as follows: The hazard at point t is equal to the product of the baseline hazard h ( t ) and the exponent of the linear predictor (p. л ) . The linear predictor is the sum of the product of the regression coefficients ( p ) and the predictor or covariate values ( x ) .
In this study x i is the ith covariate or predictor that can have an influence on computers failing, whiles ( p ) is the regression parameter that represent the weighting of the ith covariate on the failures. When ( p ) is positive, it means that the ith covariate has positive correlation with failures. However, when ( p ) is negative it means the ith covariate has a negative correlation with failure. If ((в) is equal to 0, it means that the covariate has no correlation with failures.
3.3.1 Tools Used
4. Results and Discussion
4.1. Result
Python programming language was exclusively used to process and analyze data used in this study. Python library packages used were Numpy, Pandas, Matplotlib and Lifelines. Lifelines package invented by Cam Davidson-Pilon contained Survival models that were fit to the dataset [20].
This section presents analysis and interpretation of results. Table 4 below shows the output of survival function when dataset was fitted.
Table 4. Survival function output values
|
timeline |
survival function |
timeline |
survival function |
|
0 |
1.00 |
22 |
0.80 |
|
4 |
1.00 |
24 |
0.80 |
|
5 |
0.99 |
25 |
0.80 |
|
6 |
0.99 |
26 |
0.80 |
|
7 |
0.98 |
28 |
0.80 |
|
8 |
0.98 |
30 |
0.80 |
|
9 |
0.97 |
32 |
0.73 |
|
10 |
0.97 |
35 |
0.70 |
|
11 |
0.97 |
37 |
0.62 |
|
12 |
0.94 |
38 |
0.62 |
|
14 |
0.94 |
39 |
0.62 |
|
15 |
0.94 |
40 |
0.52 |
|
16 |
0.93 |
41 |
0.42 |
|
17 |
0.93 |
42 |
0.31 |
|
18 |
0.88 |
43 |
0.21 |
|
19 |
0.88 |
46 |
0.16 |
|
20 |
0.84 |
47 |
0.16 |
|
21 |
0.80 |
48 |
0.16 |
The table above shows the output of survival function when the dataset was fitted to Kaplan Meier function . At timeline 0 the survival function shows 1.00 indicating that all the computers were functioning at the start of the study. The survival function decreased steadily as the timeline finally increased to 48 months.
The diagram above represents the Kaplan-Meier survival plotted curve of laboratory computers, showing the probability that a computer will survive beyond a specific time point. The x-axis represents time, while the y-axis represents the probability of survival. The horizontal axis represents time in 48 months (4-years) and vertical axis shows the probability of survival beyond time t. The shape and steepness provide insights into the failure rate and durability of the computers over time. At time zero, the probability of surviving beyond t0 is 1. (or 100% of the computers are alive). At 12 months (1 year), the probability of survival is approximately 0.94 or 94%. At 24 months (2 years), the probability of survival is approximately 0.80 or 80%. At 36 months (3 years), the probability of survival is approximately .062 or 62%. The median survival is approximately 40months (3 years 4 months). The median survival means50% of the computers continued to function in 3years 4 months. This result resonates with the proposition that computers are expected to retire after 3 years as established by Limonchelli et al. [21]. Kaplan Meier curves were used to study the survival rate at different levels and how each predictive factor influences survival.
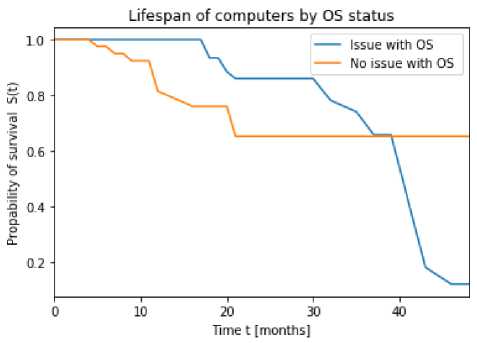
Fig. 3. Survival curve for OS variable
Figure 3 above indicates a comparatively better survival rate for computers which had no issues with the operating system than those with no issues with Operating system. Blue indicates major issues with OS whiles the orange indicates minor issues with OS. Major issues include OS corruption and virus infections. Minor issues include update of OS and installation of patches. OS had a positive prognosis on survival. This was mainly as a result of virus infections. They were cured via installation of antivirus, and re-installation of Operating system.
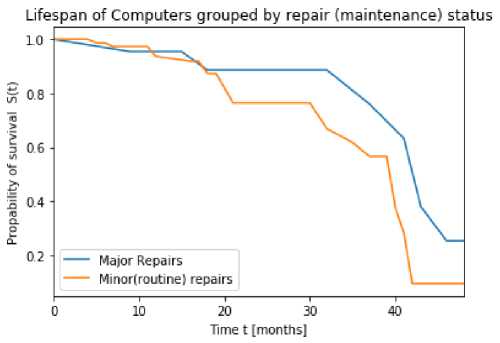
Fig. 4. Survival curve for repair group
Figure 4 shows survival curve for Repair variable. The diagram shows the impact of major and routine maintenance on computers. Blue indicates major repair whiles the orange indicates routine repairs. The diagram shows the impact of major and routine maintenance on computers. Based on the survival curve, the expected lifespan of laboratory computers and plan for their replacement accordingly can be estimated. For example, if the curve shows a steep decline in survival probability after a certain time point, it may be advisable to replace the computers before that point to avoid downtime and data loss. The survival curve also informs the maintenance schedule for laboratory computers. For instance, if the curve shows a gradual decline in survival probability over time, it may be more effective to perform regular maintenance and repairs to extend the lifespan of the computers. The diagram provides useful insight that can help the university to make informed decisions about maintenance, replacement, and resource allocation of computers and associated parts, thereby ultimately improving the reliability and efficiency of their operations .
Table 5. Output of Cox Proportional Regression of Risk factors
|
Risk Factors/Predictive variables/covariates |
Coef P -coefficent |
exp(coef) Hazard Ratio (HR) |
z |
p |
-log2(p) |
|
repair |
-0.98 |
0.38 |
-1.77 |
0.08 |
3.69 |
|
HDD |
-1.2 |
0.3 |
-1.5 |
0.13 |
2.9 |
|
motherboard |
1.54 |
4.68 |
2.27 |
0.02 |
5.42 |
|
Power supply |
1.96 |
7.1 |
2.83 |
<0.005 |
7.75 |
|
miscellaneous |
-0.31 |
0.73 |
-0.48 |
0.63 |
0.67 |
|
OS |
-1.44 |
0.24 |
-2.62 |
0.01 |
6.81 |
|
Concordance |
0.89 |
|
Partial AIC |
141.01 |
|
log-likelihood ratio test |
44.50 on 6 df |
|
-log2(p) of ll-ratio test |
24.02 |
|
Partial AIC |
141.01 |
The data was successfully fitted to the Cox Proportional Regression model. Table 5 provides a comprehensive overview of the Cox proportional hazards model, offering valuable insights into the significance and impact of each explanatory variable on the hazard rate. It includes essential statistical measures such as coefficients, standard errors, confidence intervals, z-scores, p-values, and log2-transformed p-values for each variable. Additionally, the table presents key information about the model, such as the concordance statistic, the number of observations, the number of events observed, and the partial log-likelihood.
The coefficients in the CoxPH model represent the log hazard ratios for the corresponding variables. Here's the interpretation for the coefficients: 1. Repairs: For a one-unit increase in the number of repairs, the hazard (risk of event) decreases by a factor of exp (-0.98) = 0.38. 2. HDD: For a one-unit increase in HDD (assuming it's a continuous variable), the hazard decreases by a factor of exp (-1.20) = 0.30. 3. Motherboard: For the presence of motherboard (assuming it's a binary variable), the hazard increases by a factor of exp (1.54) = 4.68. 4. Power supply: For the presence of power supply (assuming it's a binary variable), the hazard increases by a factor of exp (1.96) = 7.10. 5. Miscellaneous: For a one-unit increase in the miscellaneous factor, the hazard decreases by a factor of exp (-0.31) = 0.73. 6. OS: For the presence of OS (assuming it's a binary variable), the hazard increases by a factor of exp (1.44) = 4.22. The concordance statistic (c-index) measures the discriminatory power of the model, indicating the probability that, given a pair of observations, the model can predict which one will fail first. A value of 0.89 suggests that the model has a strong ability to discriminate between different survival times, with a higher predictive survival time corresponding to a longer actual survival time. Subsequent metrics collectively indicate the model's predictive accuracy and overall goodness of fit in capturing the relationship between the explanatory variables and survival time.
The p-values in the diagram are related to the statistical significance of the coefficients for each explanatory variable in the Cox proportional hazards model. These p-values indicate the likelihood of observing the estimated coefficient for each variable if the true coefficient were zero (i.e., if the variable had no effect on the hazard rate). By comparing the p-values to a chosen significance level (e.g., 0.05), assessment can be made whether each variable makes a statistically significant contribution to the model. Variables with p-values less than the chosen significance level are considered statistically significant, indicating that their coefficients are unlikely to be zero and that the variables have a significant impact on the hazard rate. Therefore, the p-values provide a crucial insight into the significance of each variable's contribution to the model and its ability to predict survival times.
For example, from the table, the explanatory variable "motherboard" has a p-value of 0.02, which is less than the significance level of 0.05. This indicates that the coefficient for "motherboard" is statistically significant, and the variable has a significant impact on the hazard rate. In contrast, the explanatory variable "miscellaneous" has a p-value of 0.63, which is greater than the significance level of 0.05. This suggests that the coefficient for "miscellaneous" is not statistically significant, and the variable may not have a significant impact on the hazard rate. Therefore, by examining the p-values associated with each explanatory variable, determination can be made as to which variables are statistically significant in the model and which variables may not be significant predictors of survival time . In summary, from the output table, motherboard and power supply remained significant while’s risk factors repair, HDD, OS and miscellaneous failed to be significant.
t:
Factors affected the most power_supply • motherboard ■ miscellaneous • repair -
HDD ■
-3
-2
-1 0 1
log(HR) (95% Cl)
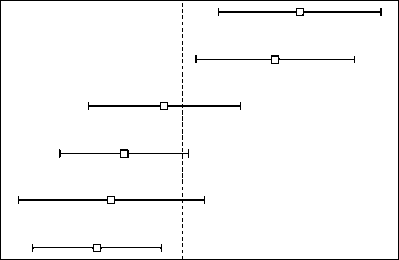
Fig. 5. Forest plot of survival.
Figure 5 shows the forest plot, which provides a summary of the hazard ratios for risk factors derived from the Cox Proportional Hazard model. It indicates the effect of significant factors on survival.
Positive coefficient (HR>1) indicates lower duration, but higher hazard rate, hence event is more likely to happen. A non-positive coefficient (HR = (0,1)) indicates a higher duration, but lower hazard rates, hence event is less likely to happen.
Overall, faulty motherboard and power supply unit increase the hazard of computers failing/breaking down early. On the other hand, OS and repair decreases the hazard of computers, hence continue to function for a longer duration.
5. Conclusion and Recommendations 5.1 Conclusion
The aim of this paper is to utilize survival analysis, to estimate the probability associated with the continuous functioning or failure of a computer system over a specified duration, and to examine risk factors associated with failure. Achieving these objectives forms an essential attempt to mitigate contributory factors of computer failures. Based on data on 100 computers observed within a period of four (4) years, 73% continued to remain operational whiles the rest ceased to function.
Among the risk variables under consideration, computers with faulty motherboard and power supply unit have a lower rate of survival. The functions of these two hardware parts remain very critical to the functioning of the entire system. Therefore, a faulty power supply exposes all the other components to power-related problems such as under voltage, over-voltage, spikes and surges. The motherboard holds all the internal components of the system unit, including the CPU. The CPU is the brain of the computer system. A breakdown of the motherboard invariably may affect the CPU. Another outcome worthy to note is that major repairs ten to prolong the lifespan of computers.
This study is significant, particularly in a university environment where computer functionality and usage is essential for ensuring smooth academic work. It is also useful in upgrading the functionality of computer systems to build resilient computer systems to handle online or virtual teaching during events that warrant virtual learning in the likes of major pandemics such as COVID-19.
-
5.2 Recommendation
From analysis done in this study, it can be observed that computers systems are machines which do not last perpetually; however, it depreciates or malfunctions over time. It is therefore recommended that policies be made to trigger strategies associated with retiring of computer systems, replacement of parts as well as replacement of new computers over time.
Although the computers were supplied jointly with the uninterrupted supply units (UPS), it could not sustain power for long due to fast falling batteries. Following this, it is recommended that an improved power-sustaining mechanism be put in place to sustain power to the computers.
Again, manufacturing factory faults could not be ruled out, thus, it is recommended that technicians perform major repairs at regular intervals on the computers. Essentially, technicians must undergo workshops and training sessions to enhance their skills in computer maintenance.
References Survival Analysis of Computers at a University’s Computer Laboratory and Implication on Maintainability
- Haidar, A. (2021). Computers in our daily lives. International Journal of Computer Science and Information Technology Research, 9 (2), pp11-17.
- Veemat M, E., Sebok S. L., Freund S. M..(2018) Discovering Computers, Digital Technology,Data and Devices. 16th Edition. Shelly and Cashman Series.
- Iyer, R. K., &Velardi, P. (1985). Hardware-Related Software Errors: Measurement and Analysis. IEEE Transactions on Software Engineering, 11(2) , pp 223-231.
- Wang, G., Xu, W., & Zhang, L. (2017). What Can We Learn from Four Years of Data Center Hardware Failures? 47th Annual IEEE/IFIP International Conference on Dependable Systems and Networks,2017
- Sheilds, C. (2004). Technology: Scientific American. Retrieved January 10, 2023, from Scientifi American: https://www.scientificamerican.com/article/why-do-computers-crash/
- Nussbaumer, R. (2019). Computers: use 'em, think about 'em, fix 'em, break 'em, program 'em, love 'em. Quora.
- Hosen, M., Uddin M, N., Hossain, S., Islam, M. A, Ahmad, A (2022). The impact of COVID-19 on tertiary educational institutions and students in Bangladesh. Cell Press Heliyon , 8, https://doi.org/10.1016/j.heliyon.2022.e0880
- Takoradi Technical University, About Us. [Online] Available at: https://www.ttu.edu.gh/about-us/
- Sinha, S., Goal, N. K., & Mall, R. (2019). Early prediction of reliability and availability of combined hardware-software systems based on functional failures. Journal of Systems Architecture ,92, pp 23-38.
- Imouokhome, Desmond, M., &Osubor, V. (2018). Causes of Failure and Breakdown of Personal Computers in Nigeria. University of Sindh Journal of Information and Communication Technology USJICT), 2 (2).
- Sun, X., Chakrabarty, K., Huang, R., Chen, Y., Zhao, B., Cao, H., et al. (2019). System-level hardware failure prediction using deep learning. 56th ACM/IEEE Design Automation Conference (DAC), pp. 1-6.
- Kleinbaum, David G.; Klein, Mitchel (2012), Survival analysis: A Self-learning text (Third ed.), Springer, ISBN 978-1441966452
- Lánczky, A., &Győrffy, B. (2021). Web-Based Survival Analysis Tool Tailored for Medical Research (KMplot): Development and Implementation. Journal of Medical Internet Research, 23.
- Tang, Z., Zhou, C., Jiang, W., & Zhou, W. (2014). Analysis of Significant Factors on Cable Failure Using the Cox Proportional Hazard Model. IEEE Transactions on Power Delivery, 29 (2), pp 951-956.
- Ahmad T, Munir A, Bhatti SH, Aftab M, Raza MA. (2017). Survival analysis of heart failure patients: A case study. PLoSOne.doi: 10.1371/journal.pone.0181001.
- Caselli, S., Corbetta, G., Cucinelli, D., &Rossolini, M. (2021). A survival analysis of public guaranteed loans: Does financial intermediary matter? Journal of Financial Stability.
- Ali, S. M., Hoq, S. M., Bari, A. B., Kabir, G., & Paul, S. K. (2022). Evaluating factors contributing to the failure. 17 (3), 17.
- Katchova, A. (2013). Survival Analysis.
- Turkson A. J, Simpson T., Addor J. A. (2021). An Introspective Overview of the Dynamics of Recurrent Events Data Analysis. Asian Journal of Probability and Statistics. AJPAS. doi:10.9734/ajpas/2021/v15i430371
- Davidson-Pilon, C. (2019). Survival analysis in Python. Journal of Open Source Software, 4 (40), 1317.
- Limoncelli, T, A., Hogan, C. J., Chalup, S, R. (2016) Practice of System and Network Administration, The: DevOps and other Best Practices for Enterprise IT, Volume 1, 3rd Edition, Addison-Wesley Professional Publishers.
- Allan, R. A. (2011). A history of personal computer: the people and the technology. Allan Publications, London
