Sustainability as the basic principle of responsible budgetary policy

Author: Galukhin Anton Viktorovich
Journal: Economic and Social Changes: Facts, Trends, Forecast @volnc-esc-en
Section: Young researchers
Article in issue: 2 (32) т.7, 2014.
Free access
The author touches upon rather critical issues of management of the regional budget system sustainability. The prospect to studying this issue is confirmed at the highest level - by the RF President. The article indicates that the main components of the budgets financial sustainability concept are the following: the territory's self-sufficiency (independence), its solvency, income and expenditure balance. The swot analysis of the public finances state in the Northwestern Federal District regions has revealed lowering independence of the territories, debt burden deterioration in the post-crisis period and the unsolved problem of income and expenses imbalance. The study shows the territories' capacity constraints to find additional financial resources, although the anti-crisis instruments of the budget process (regional reserve funds) are not used in full measure. The analysis has resulted in the development of directions to stimulate the regional budget system sustainability, such as the modernization model of fiscal federalism, strengthening and development of tax potential, improving the budget expenditures efficiency and encouraging the use of regional reserve funds potential. According to the author, the timeliness of these measures is to be achieved through continuous financial situation monitoring in the RF subjects.
Public finance, consolidated budget of the region, balance, financial sustainability, directions and methods to enhance the budgets' financial sustainability
Short address: https://sciup.org/147223577
IDR: 147223577 | UDC: 336.143(470.12) | DOI: 10.15838/esc/2014.2.32.17
Text of the scientific article Sustainability as the basic principle of responsible budgetary policy
In modern conditions, characterized by high volatility of global commodity markets and increasing influence of globalization processes on the regional economy, the issues of management of territorial budgets’ financial sustainability are becoming critical. Their limited revenue opportunities, the state’s increased social obligations, including the execution of the RF President’s decrees of May 7, 2012, make this problem even more acute.
The interest of domestic and foreign scientists has increased substantially in the context of the 2008–2009 world crisis, which limited the enterprises’ access to capital market. The result was a reduction in volumes of industrial production, while the budgets of all levels lost a considerable part of tax revenues.
In this regard, in the 2014–2016 Budget Policy Address to the RF Federal Assembly V.V. Putin identified the country’s key challenge as “to ensure long-term sustainability and stability of the budget system as basic principles for unconditional fulfilment of all state obligations even in the conditions of weak external environment” [1].
Financial sustainability of the budget system is well studied, especially in the sphere of microeconomics. The financial and economic state of an economic entity indicates its efficiency and investment attractiveness.
Meso-and macroeconomics are characterized by a significant number of different approaches to define the concept, due to the growing interest in the study of financial budgets sustainability and the relatively small amount of time to develop a common approach.
So, the researchers B.A. Raizberg, A.G. Lobko, L.S. Lozovskaya and E.B. Starodubtsev equal categories “financial sustainability of the budget” to “financial sustainability of the economic entity”.
The scientists A.V. Grachev, L.V. Davydova, L. Pikman and A.S. Gromov consider this category from the point of view of balance sustainability and development sustainability. However, it must be seen in the dynamics, that is, by dividing by the time aspect. This approach is shared by such Russian scientists as T.V. Doronina, R.R. Akhmetov, S.M. Karataev, N.I Yashina and others [15].
Systematization of the theoretical foundations of financial sustainability indicates the following components:
-
• territory’s self-sufficiency (independence) to implement the full range of authorities;
-
• solvency, i.e. the ability to fulfil commitments at the expense of resources, available in current and long-term periods;
-
• revenue and expenditure balance under the influence of external and internal factors.
The methodological basis of this issue is rather vast, that is why the researchers can agree on the parameters number to determine the financial sustainability level and on the information base for their calculation. The following questions are in focus: Should a researcher be limited only to budget system indicators? Should the analysis be supplemented with the indicators of financial sustainability of individual enterprises or single industries branches or with the indicators of socioeconomic development of the territory?
In our opinion, the calculation of the coefficients, used in budget analysis, is enough to determine the level of the territorial budget’s financial sustainability. At the same time, the indicators of socio-economic development are useful for factor analysis of the changes in the development of administrative decisions to minimize risks to the budget’s financial stability and to find ways of its improvement. It is worthwhile to consider the indicators of financial state of individual companies or industries, if the territorial budget system is heavily dependent on one source of budget revenue.
In the framework of formation of fiscal policy and budget indicators principles the researchers V.B. Iyashvili and M.E. Chichelev [5] point out to the fact that a good budget is not the one that provides the maximum amount of budget expenditures, but the one that contributes to improving living standards (comfortable life environment) of the community members by creating conditions to achieve the best possible result, as the citizens’ financial security depends on the product volume, they produce [5]. Therefore, the amount of GRP can be an indicator of the territory’s socio-economic development.
Due to objective and subjective conditions of economic environment the Russian regions have different levels of economic development. At the end of 2011, the differentiation of the Northwestern Federal district regions by GRP per capita was more than by 3 times (the maximum value was in the Komi Republic, the minimum – in the Pskov Oblast). This indicator was below the national average by 1.2–2.1 times in half of the regions, while in the Vologda Oblast it only amounted to 103.8% of the 2006 level in real terms for the analyzed period. This indicates stagnation of the regional economy and, consequently, its revenue opportunities (tab. 1).
The RF subjects’ economic development, being a key factor of budgets’ independence, has a significant impact on their financial sustainability. The analysis has showed that the territories’ financial independence is reducing everywhere. It is reflected in the declining share of their tax and non-tax revenues. The most critical situation in the Pskov Oblast: its budget is set by half at the expense of uncompensated receipts. The development strategies of the Komi Republic and the Novgorod Oblast are also of concern, as the share of own revenues has decreased by more than 20% in these regions for 2006–2012 (tab. 2) .
At the same time, one of the indicators of fiscal sustainability is annual revenue increase. Among the subjects of the Northwestern Federal district such growth has been reported in the Pskov and Leningrad oblasts for the analyzed period. In other regions the growth of own revenues has been unstable due to 2008–2009 crisis.
However, the most dynamically developing area of the Northwestern Federal district, the city of Saint Petersburg, has not increased its revenue in real terms for the same period. However, in the Murmansk Oblast, with the economic growth of 111%, the ratio of own revenues has increased by 23.8%. This discrepancy is partly due to the population growth in Saint Petersburg (109.8% to the 2006 level) and decline in the Murmansk Oblast (90.3% to the 2006 level). But the problem is that for 2006–2012 the capital of the Northwestern Federal district has created conditions for tax revenues which, in accordance with existing legislation, are to be transferred to the Federal budget (mainly, VAT and excise duties). The similar situation is observed also in the Kaliningrad, Leningrad, Arkhangelsk oblasts and the Republic of Karelia, where tax revenues, received into the Federal budget, have increased in real terms (tab. 3) .
Table 1. Gross regional product per capita in the NWFD regions (in the 2011 prices, thousand rubles)
NWFD region 2006 2007 2008 2009 2010 2011 Change 2011 to 2006., % Komi Republic 355.3 365.1 394.7 380.8 414.6 484.9 136.5 Saint-Petersburg 270.5 335.0 376.1 353.6 370.6 420.6 155.4 Arkhangelsk Oblast 262.8 303.0 290.8 300.7 321.3 361.0 137.4 Murmansk Oblast 294.9 332.6 331.3 290.8 310.8 329.0 111.6 Leningrad Oblast 243.7 259.9 283.9 291.8 303.9 326.5 134.0 Vologda Oblast 254.6 281.2 300.4 215.3 235.1 264.2 103.8 Kaliningrad Oblast 171.0 219.1 240.6 208.6 220.9 243.8 142.6 Novgorod Oblast 175.6 188.3 222.9 211.4 212.5 236.0 134.4 Republic Of Karelia 194.8 224.8 220.4 187.7 198.0 223.0 114.4 Pskov Oblast 111.7 124.5 132.4 125.6 136.5 152.9 136.8 NWFD 249.1 288.8 312.4 289.7 307.3 345.3 138.6 RF 243.9 278.7 298.4 258.7 279.9 316.6 129.8 Source: data of the Federal state statistics service .
Table 2. Own revenues of the consolidated budgets of the NWFD regions (per capita)
|
NWFD region |
2006 |
2008 |
2010 |
2012 |
Change 2011 to 2006, % |
||||||
|
Thousand rubles |
Share, %* |
Thousand rubles |
Share, %* |
Thousand rubles |
Share, %* |
Thousand rubles |
Share, %* |
Thousand rubles |
Growth rate, % |
Share, p.p. |
|
|
Saint-Petersburg |
67.0 |
87 |
81.8 |
88 |
66.7 |
85 |
67.6 |
82 |
0.6 |
100.9 |
-5.0 |
|
Komi Republic |
50.0 |
97 |
55.0 |
91 |
51.2 |
88 |
64.5 |
76 |
14.5 |
128.9 |
-21.0 |
|
Murmansk Oblast |
46.1 |
89 |
55.4 |
74 |
58.7 |
83 |
57.1 |
74 |
11.0 |
123.8 |
-15.0 |
|
Leningrad Oblast |
31.4 |
87 |
40.8 |
85 |
40.8 |
91 |
45.8 |
82 |
14.4 |
145.9 |
-5.0 |
|
Arkhangelsk Oblast |
26.5 |
77 |
38.1 |
72 |
35.7 |
71 |
43.5 |
71 |
17.0 |
164.5 |
-6.0 |
|
Republic Of Karelia |
29.1 |
80 |
36.2 |
70 |
38.3 |
78 |
37.7 |
63 |
8.6 |
129.3 |
-17.0 |
|
Vologda Oblast |
38.1 |
87 |
50.3 |
93 |
33.6 |
88 |
36.6 |
72 |
-1.5 |
96.1 |
-15.0 |
|
Novgorod Oblast |
24.0 |
82 |
33.1 |
78 |
30.7 |
85 |
36.0 |
60 |
12.0 |
150.4 |
-22.0 |
|
Kaliningrad Oblast |
28.5 |
77 |
34.8 |
67 |
32.0 |
73 |
35.6 |
62 |
7.1 |
125.0 |
-15.0 |
|
Pskov Oblast |
17.7 |
70 |
22.0 |
67 |
22.4 |
68 |
24.9 |
55 |
7.2 |
141.0 |
-15.0 |
|
NWFD |
45.5 |
86 |
56.2 |
83 |
49.3 |
83 |
52.9 |
76 |
7.4 |
116.3 |
-10.0 |
|
RF |
36.9 |
82 |
46.1 |
79 |
39.4 |
76 |
44.9 |
73 |
8.0 |
121.6 |
-9.0 |
* The share of own revenues in total revenues of the RF subjects.
Source: calculated on the basis of the reports on execution of RF subjects’ budgets and local budgets. Available at: http://www.roskazna. ru/reports/
Table 3. Dynamics of taxes, duties and other mandatory payments, received into the Federal budget, on the territory of NWFD regions (in the 2012 prices)
|
NWFD region |
2006 |
2008 |
2010 |
2012 |
Change, 2012 to 2006 |
||||||
|
Billion rubles |
Share, % |
Billion rubles |
Share, % |
Billion rubles |
Share, % |
Billion rubles |
Share, % |
Billion rubles |
Growth rate, % |
Share, p.p |
|
|
Kaliningrad Oblast |
18.5 |
44 |
26.8 |
49 |
22.6 |
53 |
48.5 |
63 |
30.0 |
262.2 |
19.0 |
|
Komi Republic |
86.7 |
67 |
90.2 |
65 |
76.2 |
53 |
64.9 |
56 |
-21.8 |
74.8 |
-11.0 |
|
Leningrad Oblast |
39.4 |
44 |
42.6 |
41 |
36.0 |
13 |
59.2 |
43 |
19.8 |
150.4 |
-1.0 |
|
Saint-Petersburg |
141.7 |
36 |
131.5 |
29 |
111.1 |
29 |
167.0 |
37 |
25.3 |
117.9 |
1.0 |
|
Arkhangelsk Oblast |
5.8 |
18 |
2.9 |
9 |
2.5 |
17 |
7.5 |
19 |
1.7 |
130.0 |
0.9 |
|
Vologda Oblast |
15.6 |
27 |
29.1 |
34 |
24.5 |
14 |
6.7 |
15 |
-8.9 |
42.9 |
-12.0 |
|
Republic Of Karelia |
3.1 |
15 |
3.3 |
14 |
2.8 |
9 |
3.3 |
15 |
0.2 |
108.0 |
0.0 |
|
Pskov Oblast |
2.4 |
19 |
1.5 |
11 |
1.2 |
18 |
1.9 |
13 |
-0.5 |
80.0 |
-6.0 |
|
Murmansk Oblast |
13.2 |
28 |
12.3 |
23 |
10.4 |
42 |
5.7 |
13 |
-7.5 |
43.1 |
-15.0 |
|
Novgorod Oblast |
3.2 |
19 |
5.6 |
23 |
4.8 |
19 |
2.8 |
13 |
-0.4 |
86.8 |
-6.0 |
|
NWFD |
329.2 |
32 |
345.9 |
30 |
292.1 |
33 |
406.0 |
39 |
76.8 |
123.3 |
7.0 |
Source: calculated on the basis of the report on accrue taxes, duties and other obligatory payments to the budget system of the Russian Federation, no.1-NM of Russian federal tax service.
The reduction in the share of the regions’ own financial capacity, the policy of revenues centralization in the budget system at the federal level, accompanied by a regular review of expenditure obligations of lower management levels (an increase of delegated expenditures) [3, 10], has led to that the country’s average real deficit has not fall below 30% after the crisis. Moreover, this indicator was above the 80% level in Arkhangelsk (2009), Pskov (2009, 2011 and 2012) and Kaliningrad (2009). The level of more than 15% is already evident of budget systems’ instability [15], in
2012 it was recorded in Murmansk, Vologda, Arkhangelsk, Novgorod, Kaliningrad, Pskov oblasts, republics of Komi and Karelia ( tab. 4 ).
What is more, the problem of imbalanced consolidated budget is not solved in half of the Northwestern Federal district regions: the revenue growth rates are lagging behind expenditures growth rates. Expenditure obligations are not supported by corresponding revenues. In 2006–2012 this situation was indicated in Murmansk, Pskov, Leningrad, Kaliningrad oblasts, republics of Karelia and Komi ( tab. 5 ).
Table 4. Real deficit of consolidated budgets in the NWFD regions (in % of own revenue)
NWFD region 2006 2007 2008 2009 2010 2011 2012 Change 2012 to 2006, p.p. Saint-Petersburg -0.1 -8.2 -23.8 -31.1 -27.1 -25.0 -14.7 -14.7 Leningrad Oblast -10.8 -14.3 -20.8 -27.6 -12.5 -14.9 -14.8 -3.9 Komi Republic -3.6 -11.7 -15.4 -32.0 -17.5 -22.9 -20.9 -17.3 Murmansk Oblast -26.9 -23.4 -40.5 -47.0 -19.5 -21.5 -32.1 -5.3 Vologda Oblast -16.3 -18.8 -10.3 -67.1 -47.5 -45.2 -32.4 -16.1 Arkhangelsk Oblast -35.8 -28.5 -56.7 -88.1 -56.5 -64.8 -34.7 1.1 Novgorod Oblast -31.8 -31.3 -41.5 -57.1 -53.0 -36.7 -46.7 -15.0 Republic of Karelia -39.5 -51.9 -53.8 -72.6 -46.8 -38.5 -47.6 -8.2 Kaliningrad Oblast -33.4 86.7 -49.6 -79.9 -56.6 -64.5 -48.8 -15.4 Pskov Oblast -33.8 -41.4 -52.4 -80.5 -72.3 -82.9 -84.7 -50.9 NWFD -10.0 -15.6 -28.4 -43.2 -31.4 -30.7 -24.2 -14.2 RF -7.9 -17.5 -27.2 -47.4 -33.3 -31.8 -30.7 -22.8 Source: calculated on the basis of the reports on execution of RF subjects’ budgets and local budgets. Available at: http://www.roskazna. ru/reports/
Table 5. Ratio of revenues and expenditures growth rates of consolidated budgets in the NWFD regions
NWFD region 2007 2008 2009 2010 2011 2012 Murmansk Oblast 1.03 1.23 0.95 1.11 0.97 0.89 Pskov Oblast 0.95 1.45 0.94 1.01 1.01 0.91 Republic of Karelia 0.92 1.50 0.90 1.11 1.01 0.94 Leningrad Oblast 0.97 1.16 0.92 1.11 1.00 0.97 Komi Republic 0.93 1.11 0.99 1.04 0.96 0.99 Kaliningrad Oblast 1.00 1.37 1.04 0.87 1.08 0.99 Saint-Petersburg 0.92 1.03 1.03 0.99 1.02 1.00 Arkhangelsk Oblast 1.06 1.19 0.96 1.13 0.92 1.01 Novgorod Oblast 1.00 1.25 0.98 0.93 1.16 1.04 Vologda Oblast 0.98 1.19 0.86 1.01 1.00 1.08 Source: calculated on the basis of the reports on execution of RF subjects’ budgets and local budgets. Available at: http://www.roskazna. ru/reports/
However, in the mid-term the situation can not only retain, but also worsen due to the necessity to execute the RF President’s decrees of May 7, 2012 [11]. Only in the Vologda Oblast the lack of funds for their implementation in 2013–2016 is 17.7 billion rubles (9.2% of own revenues), with the planned annual deficit being 3.9–10.3% of tax and non-tax revenues into the consolidated budget of the region.
The execution of adverse budgets has led to covering the missing amount of the resources at the expense of borrowed funds [13]. As a result, the entire post-crisis period is characterized by the growth of the NWFD subjects’ debt load. In relative terms, it has grown in Saint Petersburg (by 62 times), Pskov (by almost 40 times), Vologda (by 17 times) and Murmansk (by 12 times) oblasts most noticeably In relation to the consolidated budgets’ own revenues the debt load has exceeded 50% in Vologda, Kaliningrad, Novgorod oblasts and the Republic of Karelia (tab. 6).
The value, greater than 100% is critical for financial sustainability and it indicates the territory’s insolvency [16]. So, as of October 2013, the public debt of the Vologda Oblast has exceeded a threshold level. It is obvious that the trend of its debt burden growth will be reversed neither in 2014, nor in 2015. However, the cost of public debt management, which in 2012 reached 2% of the region’s total expenditures, presupposes spending cuts in other budget items, including those of social orientation. It is the factor of social tensions growth and the reason of the failure to achieve the targets and indicators of socio-economic development.
The trends, observed in the development of the NWFD regions, determine less sustainable budgets in Vologda, Murmansk, Pskov oblasts, Republic of Karelia. In other subjects of the district the financial situation also deteriorated in the post-crisis period.
However, the significant obstacle to solve this problem is legislation. It, regulating the budget process of subjects and municipal entities in the Russian Federation, limits the regional authorities to increase financial resources in the territory.
According to the RF Budget Code, the regional socio-economic system can accumulate additional funds to finance its own authorities due to variations in the federal established rates of property tax at the regional (corporate property tax, transport tax) and
Table 6. Debt load of the NWFD regions
|
NWFD region |
2008 |
2009 |
2010 |
2011 |
2012 |
Change 2012 to 2008, p.p. |
|||||
|
Billion rubles |
%* |
Billion rubles |
%* |
Billion rubles |
%* |
Billion rubles |
%* |
Billion rubles |
%* |
||
|
Vologda Oblast |
1.8 |
3.7 |
11.0 |
37.5 |
19.0 |
50.6 |
26.9 |
63.9 |
30.9 |
70.5 |
66.8 |
|
Kaliningrad Oblast |
7.5 |
29.5 |
12.0 |
52.6 |
17.9 |
64.9 |
21.6 |
69.7 |
21.5 |
63.8 |
34.2 |
|
Republic of Karelia |
4.1 |
22.2 |
7.4 |
42.1 |
10.2 |
44.8 |
9.7 |
35.6 |
12.5 |
51.9 |
29.6 |
|
Novgorod Oblast |
2.8 |
16.4 |
4.7 |
28.2 |
8.9 |
49.2 |
10.0 |
46.4 |
11.5 |
50.9 |
34.5 |
|
Pskov Oblast |
0.2 |
1.7 |
0.4 |
3.5 |
1.8 |
12.6 |
5.3 |
32.8 |
8.0 |
48.3 |
46.7 |
|
Arkhangelsk Oblast |
5.4 |
14.7 |
11.1 |
35.7 |
15.6 |
38.4 |
20.6 |
47.2 |
24.7 |
46.9 |
32.2 |
|
Murmansk Oblast |
0.8 |
2.4 |
7.3 |
21.0 |
9.6 |
22.2 |
6.0 |
12.6 |
10.2 |
22.6 |
20.2 |
|
Komi Republic |
3.2 |
8.0 |
7.1 |
19.4 |
6.8 |
15.8 |
9.3 |
18.4 |
12.4 |
21.6 |
13.6 |
|
Leningrad Oblast |
5.8 |
10.7 |
6.3 |
11.5 |
6.5 |
10.2 |
6.6 |
9.1 |
8.0 |
10.0 |
-0.7 |
|
Saint-Petersburg |
0.3 |
0.1 |
1.8 |
0.7 |
6.6 |
2.2 |
8.5 |
2.5 |
21.3 |
6.4 |
6.2 |
|
NWFD , billion rubles |
31.5 |
5.3 |
69.2 |
13.3 |
102.7 |
16.6 |
124.6 |
17.6 |
161.0 |
22.3 |
17 |
|
RF , billion rubles |
599.6 |
11.8 |
1024.5 |
23.2 |
1265.5 |
24.4 |
1387.3 |
22.8 |
1596.8 |
24.9 |
13.1 |
* Ratio of the volume of state and municipal debts to the own revenues of the RF subject’s consolidated budget.
Source: calculated according to the data of the Ministry of Finance of the Russian Federation. Available at: local (property tax, land tax) levels, as well as due to the change of the taxation elements of special tax regimes. However, the share of the mentioned taxes in the consolidated budgets of the Northwestern Federal district subjects was not higher than 19% in 2006– 2012. While the share of sub-federal taxes decreased in Kaliningrad, Pskov, Murmansk and Arkhangelsk oblasts, republics of Komi and Karelia (tab. 7).
Moreover, to accumulate additional financial resources in the territorial budget systems is possible by increasing the federal taxes base (excise duties and mineral extraction tax, personal income tax) and changing single items of taxation (income tax). The regional authorities can boost the budget revenue by raising the use efficiency of state and municipal property.
The uncompensated receipts from the Federal budget (grants and subsidies), from physical and legal persons, international organizations and governments of foreign states are only indirectly influenced by the public authorities, except for interbudgetary transfers, evaluating results of their activities (figure).
However, the experience of budget federalism construction in developed countries, such as Germany and the USA, shows that the distribution of revenues from the key income producing taxes (total taxes in Germany account for 70% of the tax revenues of the country’s consolidated budget, in USA – about 75%) among all budget system levels is a more progressive mechanism, ensuring the revenue sustainability at all levels of authorities [6]. Such an approach is typical of other federal states, such as Australia and Austria. The distribution of tax payments stimulates each government level to create conditions, ensuring economic growth by means of additional production factors that results in tax potential development and additional financial resources for the authorities [14].
The analysis of the RF budgetary legislation has led to systematization of the used and actively implemented methods, aimed at improving the financial sustainability of territorial budget systems (tab. 8) .
In conditions of increasing globalization, special attention should be given to such tool of increasing budgets’ financial sustainability as the use of regional reserve funds [8].
Table 7. Share of regional and local taxes in the consolidated budgets of the NWFD regions, %
NWFD region 2006 2007 2008 2009 2010 2011 2012 Change 2012 to 2006, p.p. Vologda Oblast 7.5 8.6 7.0 16.4 11.8 13.5 18.6 11.1 Leningrad Oblast 16.8 14.8 14.4 17.1 15.7 16.3 17.3 0.5 Kaliningrad Oblast 18.8 19.1 19.7 23.9 19.8 16.3 17.1 -1.7 Novgorod Oblast 13.7 13.3 12.5 14.5 15.4 12.2 14.0 0.3 Saint-Petersburg 11.9 11.2 10.8 13.4 11.8 10.6 12.6 0.7 Pskov Oblast 13.9 11.2 12.1 13.3 12.1 9.9 11.5 -2.4 Komi Republic 13.5 14.3 14.0 18.2 16.2 11.0 11.2 -2.3 Republic of Karelia 16.4 15.3 14.2 19.6 13.8 9.3 10.9 -5.5 Murmansk Oblast 9.8 8.2 9.7 10.8 8.4 7.5 9.1 -0.7 Arkhangelsk Oblast 10.4 7.0 5.1 8.4 6.4 8.9 7.7 -2.7 NWFD 12.1 11.9 11.5 15.4 13.3 12.0 13.6 1.5 RF 11.1 10.9 10.8 14.4 13.0 12.3 13.5 2.4 Source: calculated on the basis of the reports on execution of RF subjects’ budgets and local budgets. Available at: http://www.
Classification of revenues of the RF subjects’ consolidated budgets by the degree of regional authorities’ influence on the amount of financial resources
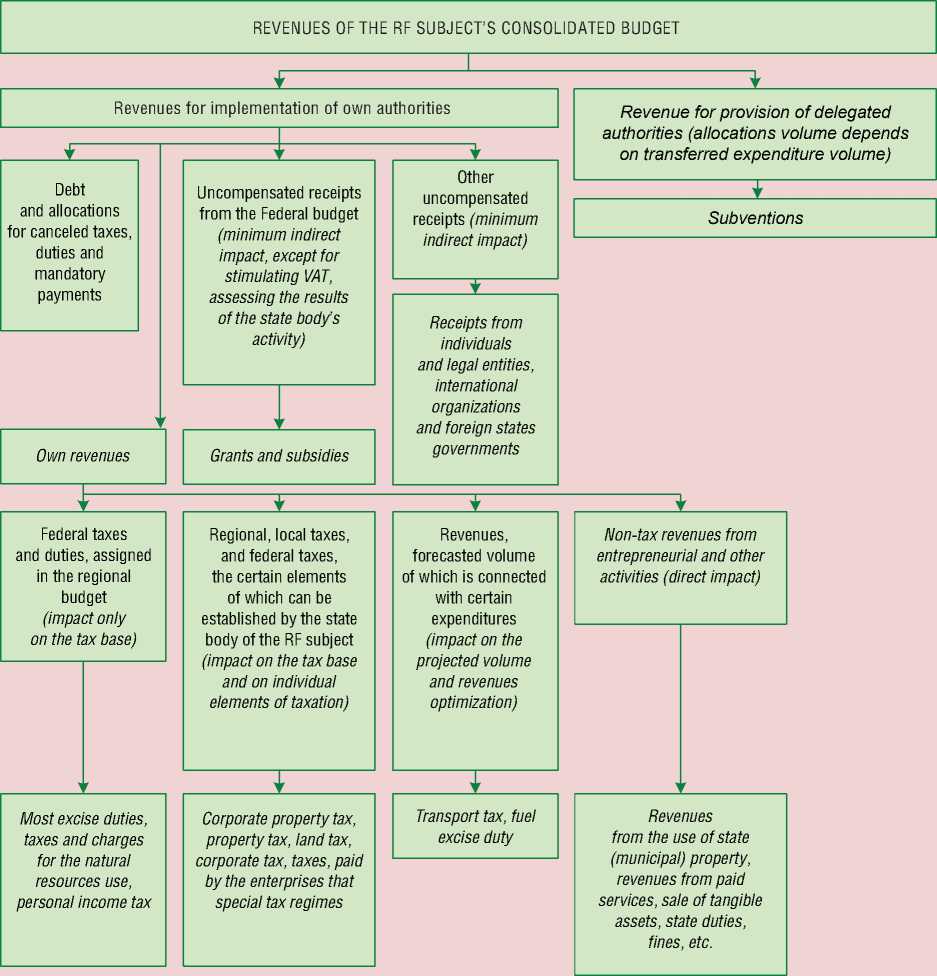
Source: compiled by the author.
In fact, these funds should serve as a tool for financial and economic policy of the region, promote its balance, smooth adverse fluctuations in budget revenues, retain and redistribute them in time, i.e. maintain the budget’s financial stability in an acceptable range.
The reserve funds functioning in a separate administrative-territorial unit is widespread in world practice, for example, Alaska Permanent Fund (USA), the Permanent Wyoming Mineral Trust Fund (USA), Alberta Heritage Savings Trust Fund (Canada) [8].
Table 8. Methods to increase the financial sustainability level of territorial budget systems
|
Directions |
Methods |
|
Boosting management efficiency of sub-national budgets revenues |
Implementation of scenario approach when developing budgets. Assessment of revenues shortages due to tax benefits provision. Variation of single items of taxation, leading to accumulation of additional revenues. Tax collection from defaulters, reduction and liquidation of the debt by its restructuring. Accumulation of non-tax revenues. |
|
Management of medium-and-short-term budget planning |
Extending strategic planning. Monitoring requirements of specific types and volumes of state and municipal services. Introduction of medium-term contracts. |
|
Implementation of countercyclical fiscal policy |
When drawing up the budget, it would be better to follow conservative scenarios of a revenue base and to use additional revenues in two directions:
|
|
Optimization of sub-federal budgets’ expenditures |
Management of the budget result-oriented process:
Improving the management system of state-financed investment projects. Improving the targeting of measures of social support, provided to the population. Tightening the regime of budgetary funds’ economy in the period of worsening economic conditions. |
|
Management of public (municipal) debt |
Annual analysis of the volume and composition of the debt, the impact on overall solvency. Evaluation of the budget’s debt capacity. Refinancing of the current debt in order to optimize the debt portfolio structure. Ensuring regular payments on servicing and repayment of the debt. Restructuring of overdue accounts payable. Providing guarantees in the case of corresponding provision. |
Source: compiled by the author
However, until now this tool is not fully used in the RF regions. The reason for this is the lack of profitable opportunities to finance expenditure obligations, resulting in scarcity of territorial budget systems, which, even with uncompensated receipts from the federal center, reached 23% (in the Vologda Oblast in 2009) against its own revenues in crisis and post-crisis years.
According to statistics, in 2012 the reserve funds were established in 56 regions of the Russian Federation. Thus, in accordance with the Decree of the Ministry of Finance of the Russian Federation “On the Order of Monitoring and Quality Assessment of Regional Finances Management”, one of the indicators, characterizing the quality of budget execution, is “the share of the reserve fund of the RF subject in the volume of budget expenditure of the RF subject” [10]. According to the analysis, this indicator in any of the RF subjects has not exceeded 0.07% for 2006–2012. Moreover, in Leningrad and Murmansk oblasts the share of reserved funds in the total volume of budget expenditures has decreased, which indicates a reduction in the role of regional reserve funds to maintain the balance and sustainability of territorial budget systems.
The analysis has identified the following key directions to ensure budgets’ balance, enhance their sustainability and reduce RF subjects’ differentiation by their budget sufficiency:
-
1) modernizing a fiscal federalism model in order to ensure the growth of regional budgets’ own revenues on the basis of enhancing tax and non-tax sources;
-
2) strengthening and developing the tax potential, based on the GRP stable growth;
-
3) increasing the effectiveness and level of budget expenditures planning;
-
4) maintaining the “excess profit”.
The continuous monitoring of financial situation in the regions and municipalities will contribute to timely adoption of measures to manage sub-federal budgets sustainability. The sustainable budget replenishment will eventually create conditions for solving both current and long-term state tasks at the expense of full resource provision of long-term programs of social-economic development of territories.
References Sustainability as the basic principle of responsible budgetary policy
- Byudzhetnoe Poslanie Prezidenta Rossiiskoi Federatsii Federal'nomu Sobraniyu ot 13.06.2013 “O byudzhetnoi politike v 2014-2016 godakh” . Spravochnaya pravovaya sistema “Konsul'tantPlyus” .
- Vorob'eva N.N. Pravovye problemy sozdaniya i funktsionirovaniya rezervnogo fonda sub”ekta Rossiiskoi Federatsii , Problemy ucheta i finansov , 2011, no.1, pp. 77-80.
- Galukhin A.V. Byudzhetnaya obespechennost' regionov SZFO . Voprosy territorial'nogo razvitiya , 2013, no.8(8). Available at: http://vtr.isert-ran.ru/?module=Articles&action=view&aid=3166.
- Davydova L.V., Rassolova T.L. Transformatsiya byudzhetnoi sistemy v sovremennykh usloviyakh: monografiya . Orel: Izd-vo ORAGS, 2009, 216 p.
- Iyashvili V.B., Chichelev M.E. O printsipakh formirovaniya byudzhetnoi politiki i byudzhetnykh pokazatelei . Sait kontrol'no-schetnoi palaty Moskvy . Available at: http://ksp.dev.armd.ru/common/upload/news/docs/Principles_formation.pdf
- Kazakov V.V. Zarubezhnyi opyt regional'nogo vyravnivaniya . Vestnik Tomskogo gosudarstvennogo universiteta , 2008, no.313, pp. 170-176.
- Kontseptsiya dolgosrochnogo sotsial'no-ekonomicheskogo razvitiya Rossiiskoi Federatsii na period do 2020 goda: Rasporyazhenie Pravitel'stva Rossiiskoi Federatsii ot 17.11.2008 goda № 1662-r . Available at: http://strategy2020.ru/.
- Kudrin A. Stabilizatsionnyi fond: zarubezhnyi i rossiiskii opyt . Voprosy ekonomiki , 2006, no.2, pp.28-45.
- O poryadke osushchestvleniya monitoringa i otsenki kachestva upravleniya regional'nymi finansami: Prikaz Ministerstva finansov Rossiiskoi Federatsii ot 03.12.2012 goda № 552 . Spravochnaya pravovaya sistema “Konsul'tantPlyus” .
- Ob osnovnykh napravleniyakh byudzhetnoi i nalogovoi politiki Vologodskoi oblasti na 2014 god i planovyi period 2015 i 2016 godov: Postanovlenie Pravitel'stva Vologodskoi oblasti ot 23.09.2013 goda № 957 . Spravochnaya pravovaya sistema “Konsul'tantPlyus” .
- Povarova A.I. Regional'nyi byudzhet 2013-2015: stabil'nost' ili vyzhivanie? . Ekonomicheskie i sotsial'nye peremeny: fakty, tendentsii, prognoz , 2013, no.1, pp. 36-55.
- Programma povysheniya effektivnosti upravleniya obshchestvennymi (gosudarstvennymi i munitsipal'nymi) finansami na period do 2018 goda: proekt Ministerstva finansov RF ot 22.02.2010 g.. Available at: http://www.minfin.ru/
- Pushkova N.E. K voprosu ob upravlenii gosudarstvennym dolgom regiona . Problemy razvitiya territorii , 2012, no.5(61), pp. 53-62.
- Uskova T.V., Povarova A.I., Orlova V.S. Obshchestvennye finansy regionov: prioritety modernizatsii . Supervised by Ph.D. in Economics T.V. Uskova. Vologda: ISERT RAN, 2010. 168 p.
- Shimshirt N.D. Analiz teoreticheskikh aspektov finansovoi ustoichivosti regionov . Vestnik Tomskogo gosudarstvennogo universiteta , 2011, no.3(15), pp. 171-178.
- Shimshirt N.D. Povyshenie finansovoi ustoichivosti byudzhetov sub”ektov Federatsii kak strategicheskaya zadacha povysheniya effektivnosti publichnykh finansov . Vestnik Tomskogo gosudarstvennogo universiteta , 2013, no.2(22), pp. 147-158.
- Yashina N.I., Grishunina I.A. Upravlenie raskhodami byudzhetov administrativno-territorial'nykh obrazovanii: monografiya . N. Novgorod: NGTU, 2004. 324 p.
- Jan Werner. The German Fiscal Federalism: in a State of Flux. Available at: http://www/worldbank.org/wbiep/decentralization/ecalib/werner.pdf
