Суточные, сезонные, годовые и полугодовые вариации ионосферных параметров на разных широтах в восточно-азиатском секторе на фазе роста солнечной активности

Автор: Ван Чжэн, Ши Цзянькуй, Ван Гоцзюнь, Ван Сяо, Жеребцов Г.А., Романова Е.Б., Ратовский К.Г., Полех Н.М.
Журнал: Солнечно-земная физика @solnechno-zemnaya-fizika
Статья в выпуске: 2 т.3, 2017 года.
Бесплатный доступ
Мы проанализировали ионосферные параметры, в том числе критическую частоту слоя F2 ( f оF2), высоту максимума слоя F2 ( h mF2), и шкалу высот на h mF2 ( H T) в период с 2006 по 2012 г. (восходящая фаза солнечной активности) на о. Хайнань (19.5° N, 109.1° E, маг. шир. 9.7° N), в Иркутске (52.4° N, 104.3° E, 42.2° N) и Норильске (69.2° N, 88.0° E, маг. шир. 59.8° N) (низкие, средние и высокие широты). Использовались обработанные вручную данные ионограмм дигизонда. Исследования суточно-сезонных колебаний f оF2 и h mF2 являются продолжением серии исследований, ранее проведенных для Восточной Азии. Особенности, характерные для восходящей и нисходящей фаз солнечной активности, в основном подобны, за исключением изменений h mF2 на закате и в ночное время. Особенности годовых и полугодовых вариаций, полученных дигизондом, подтверждаются данными, полученными с помощью спутников и карты полного электронного содержания. Мы также получили сезонные, суточные, годовые и полугодовые вариации ионосферного параметра H T (шкала высот на h mF2), используя данные дигизонда, которые отличаются от вариаций f оF2 и h mF2.
Ионосфера на разных широтах, суточно-сезонные вариации, годовые и полугодовые вариации, солнечная активность, ионосферные параметры, восточно-азиатский сектор
Короткий адрес: https://sciup.org/142103642
IDR: 142103642 | УДК: 550.385, | DOI: 10.12737/22594
Diurnal, seasonal, annual, and semi-annual variations of ionospheric parameters at different latitudes in east asian sector during ascending phase of solar activity
We analyzed ionospheric parameters including the critical frequency of the F2 layer ( f oF2), the peak height of the F2 layer ( h mF2), and the scale height at h mF2 ( H T) from 2006 to 2012 (ascending phase of solar activity) at Hainan (19.5° N, 109.1° E, MLat. 9.7° N), Irkutsk (52.4° N, 104.3° E, MLat. 42.5° N), and Norilsk (69.2° N, 88.0° E, MLat. 59.8° N) stations (low, middle and high latitudes). We have used manual scaled digisonde ionogram data. Studies of f oF2 and h mF2 diurnal-seasonal variations continue those made earlier for East Asia. Features peculiar for the ascending phase of solar activity are mostly consistent to those for descending phase, except for the features of sunset and nighttime h mF2 variations. Features of annual and semi-annual variations recorded by a digisonde agree with those obtained by a satellite occultation and TEC map. We also obtained seasonal, diurnal, annual, and semi-annual variations of the ionospheric parameter H T (scale height at h mF2) from digisonde data, which differ from f oF2 variations and h mF2 features.
Текст научной статьи Суточные, сезонные, годовые и полугодовые вариации ионосферных параметров на разных широтах в восточно-азиатском секторе на фазе роста солнечной активности
Ionospheric parameters such as the critical frequency of the F2 layer ( f о F2) and the peak height of the F2 layer ( h m F2) have been proved to have regional variations [Givishvili et al., 1982; Limberger et al., 2013]. Considering the features of the parameters associated with their geomagnetic latitude ϕ, the ionosphere can be divided into three latitude zones: low-latitude (ϕ<30°), mid-latitude (30°<ϕ<60°), and high-latitude (ϕ>60°) [Hunsucker, Hargreaves, 2003].
The ionospheric parameters also reveal diurnal-seasonal variations. Using electron density (Ne) data from the Indian SROSS C2 satellite for 1994–1997 at low and equatorial latitudes, Bhuyan et al. [2003] found that the electron density had a minimum before sunrise, a diurnal maximum during afternoon hours, a secondary enhancement in sunset hours of the June solstice, as well as seasonal and latitudinal variations. Basing on ionogram data acquired at American latitudes (-65.2°^-18.5°), Ezquer et al. [2004] analyzed the diurnal, seasonal and latitudinal behavior of fоF2 and parameter M(3000)F2 and established that the fоF2 varia- bility is high at low solar activity, larger at night than during a day, and depends on latitude. In the East Asian sector, with digisonde data from the high-latitude station Norilsk (69.2° N, 88.0° E, MLat. 59.8° N), Ratovsky et al. [2013] compared diurnal, seasonal, and solar cycle dynamics of the ionospheric F2 peak density, the peak height, and the thickness of the bottomside ionosphere with the IRI-2007 model and analyzed the winter anomaly manifestation at Norilsk and the peculiar diurnal-seasonal hmF2 behavior under low solar activity (called “polar day effect”). Using digisonde ionogram data from Hainan (19.5° N, 109.1° E, MLat. 9.7° N) for 2002, Zhang et al. [2004] analyzed diurnal and seasonal variations of ionospheric parameters fоF2, hmF2, B0, and B1, and found that in spring fоF2 remained high and at almost constant value between local noon and midnight time, while in summer it had two peaks in the afternoon and around midnight. Using digisonde observation data from low, middle, and high-latitude stations in East Asian sector, Ratovsky et al. [2014] obtained Local Empirical Model (LEM) results on fоF2 and hmF2 dy- namics from December 2002 to December 2008 and compared their regular (diurnal, seasonal, and solar cycle) variations. They found that the main variation features given by the local models agreed with previous studies, while the parameters at different latitudes also had some specific features [Ratovsky et al., 2014]. As for the diurnal-seasonal variations of the scale height at hmF2, using the 2002–2004 Hainan ionogram data, Zhang et al. [2006] showed that the scale heights had a noontime peak and pre-sunrise peak, most pronounced in winter. Also they had a clear annual variation with the largest daytime values in summer and the smallest values in winter, and revealed strong solar activity dependence, with daytime values decreasing with solar activity. These results show that the diurnal-seasonal variations of the ionospheric parameters have regional properties.
On the other hand, the ionospheric parameters have also annual and semi-annual variations. For example, for the peak density of the F2 layer N m F2, the winter anomaly or seasonal variation is that at mid-latitudes noontime N m F2 values are larger in winter than in summer. The semi-annual variation is that N m F2 is greater at equinox than at solstice, and the annual or non-seasonal variation is that N m F2 is greater around December solstice than around the June solstice by day as well as by night for both the Northern and Southern hemispheres [Appleton, Naismith, 1935; Zhao et al., 2007]. With TEC or ionosonde data, some authors reported that N m F2 annual variations were more significant at high latitudes than at low latitudes, were most pronounced at magnetic latitudes 40–60° with the winter anomaly occurring [Yonezawa, 1971; Yu et al., 2004; Zhao et al., 2007]. Analyzing TEC or ionosonde data, some authors indicated that amplitudes of the N m F2 semi-annual variation were larger at low latitudes than at high ones, larger at noon than at midnight, and larger in solar maxima than in minima [Yonezawa, Arima, 1959; Yonezawa, 1971; Yu et al., 2004]. These results show that annual and semi-annual variations of the ionospheric parameters also have regional properties.
To learn more about variation features at different latitudes, we statically analyze and compare digisonde observation data from Hainan (19.5° N, 109.1° E, MLat. 9.7° N), Irkutsk (52.4° N, 104.3° E, MLat. 42.5° N) and Norilsk (69.2° N, 88.0° E, MLat. 59.8° N) for 2006–2012, acquired at low to high latitudes in East Asian sector. The ionospheric parameters such as the critical frequency of the F2 layer ( f о F2), the peak height of the F2 layer ( h m F2), and the scale height at h m F2 ( H T ) were obtained from manually scaled ionogram data. We also discuss common and specific features of diurnal-seasonal variations of these parameters measured at different latitudes during ascending phase of solar activity.
DATA AND METHOD
The ionospheric parameters have been obtained by the Norilsk, Irkutsk and Hainan digisondes (a kind of ionosonde) at 15-minute cadence. Here we use fоF2, hmF2, and HT from manually scaled ionogram data, which were edited using the program SAO Explorer [Reinisch et al., 2004; Khmyrov et al., 2008]. Information about the three stations is given in Table. Magnetic field parameters are calculated with the IGRF-12 model. Ranges of the ionogram data acquired under the joint Chinese-Russian project are also shown in Table. The Norilsk, Irkutsk and Hainan stations have similar longitudes and magnetic longitudes despite being located at high, middle and low latitudes respectively. We employ a manually scaled ionogram since noises in digisonde echoes are strong in the low- or high-latitude ionosphere. In this study, we use data for January 2006 – December 2012, which correspond to the ascending phase of a solar cycle. Daily solar F10.7 indices from 2006 to 2012 are presented in 1. It shows that the solar activity slightly decreased and then obviously increased in 2011 and 2012.
To study annual and semi-annual variations, we have selected the 12:00 LT parameters.
The ionospheric electron density profile is similar to a parabola and has a peak in the F2 layer. The ionospheric parameter f o F2 is the critical frequency of the F2 layer in the digisonde echo, and its square value has a linear correlation with the peak electron density of the F2 layer ( N m F2). Therefore, the variation features of f o F2 are similar to those of N m F2. The ionospheric parameter h m F2 is the height of the F2 layer peak. The ionospheric parameter H T is the scale height at h m F2 derived from the electron density variation ratio near the peak and can be obtained using the program SAO Explorer. The parameter H T represents conditions near the F2 layer peak.
We should notice that there are LT/UT errors in the original data from Hainan for winter 2012. In this paper, all Figures are drawn with the corrected data.
RESULTS
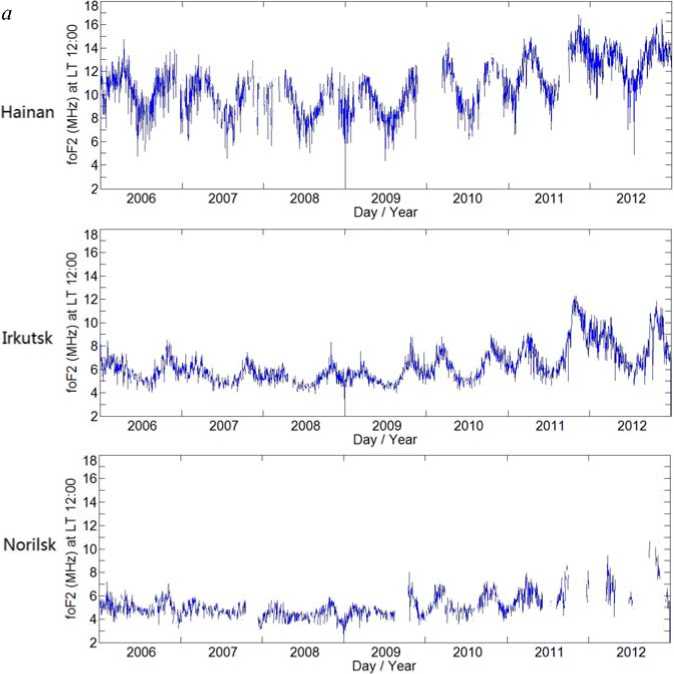
Diurnal-seasonal variations of f o F2, h m F2, and H T at the three stations from 2006 to 2012 are given in Figure 2, a – c respectively. The X-axis is a day of year, the Y-axis is local time, and colors indicate values of these parameters. These Figures enable us to estimate common features of ionopsheric parameters at the three stations, specific features at different latitudes, and specific features in different years. The white color means no parameter values, but it does not mean no observation data
Data on the three stations (calculated by the IGRF model)
|
Station |
Lat. (°N) |
Lon. (°E) |
M.-Lat. (°N) |
M.-Lon. (°E) |
Period |
|
Hainan |
19.5 |
109.1 |
9.7 |
181.7 |
2002–2015 |
|
Irkutsk |
52.4 |
104.3 |
42.5 |
177.4 |
2004, 2006–2014 |
|
Norilsk |
69.2 |
88.0 |
59.8 |
166.4 |
2004, 2006–2012 |
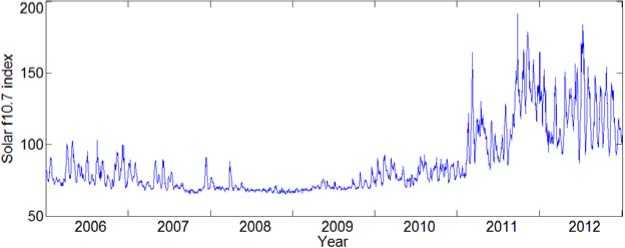
Figure 1. Daily solar F10.7 index from 2006 to 2012
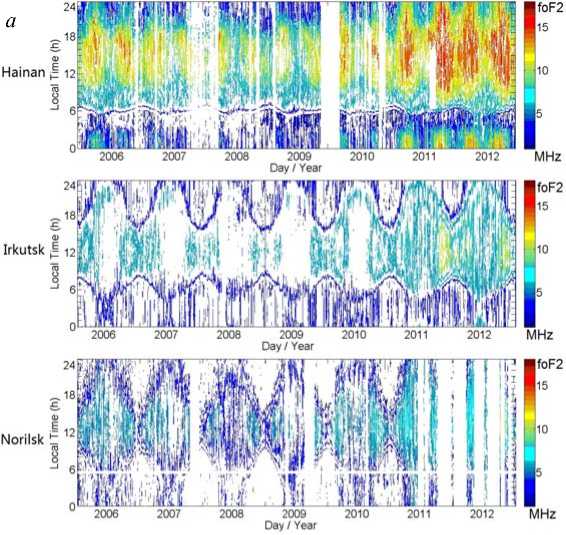
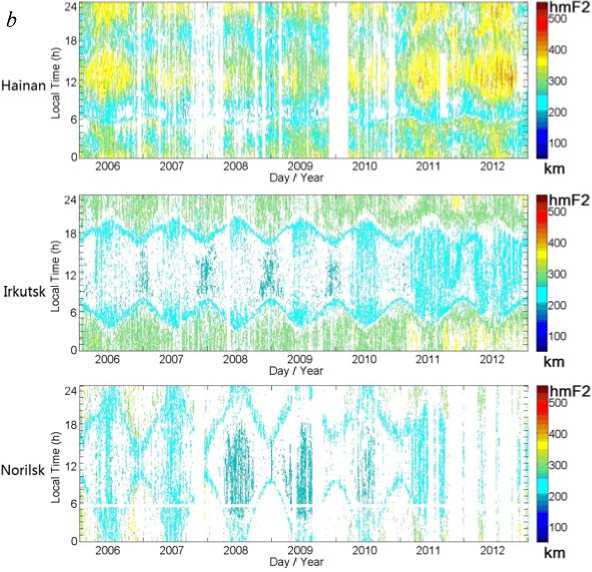
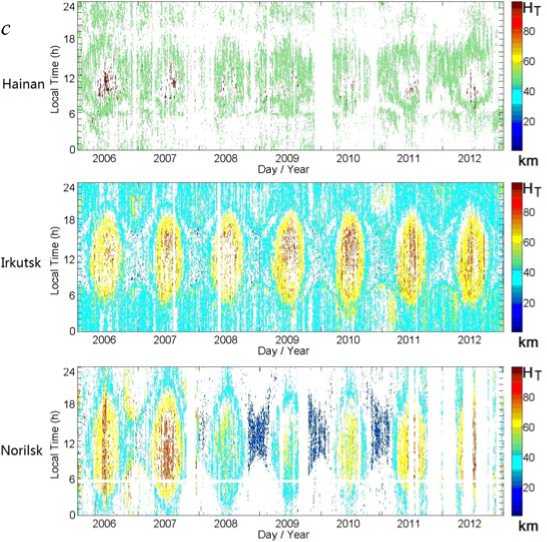
Figure 2. Diurnal-seasonal variations of f o F2 ( a ), h m F2 ( b ), and H T ( c ) at three stations from 2006 to 2012
for that period. If the ionospheric trace is not clear and complete, f o F2/ h m F2/ H T cannot be calculated by the SAO explorer. For example, sometimes spread F occurs so that f o F2 cannot be determined, but h m F2/ H T can be estimated by the program based on the high-frequency part of the F region trace. Sometimes, we can get an approximate f o F2 value from the trace, but the shape of the trace near h m F2 is not clear, so the program cannot give a credible h m F2/ H T.
Figure 2, a illustrates the diurnal-seasonal dynamics of f o F2 from Hainan station, which show semi-annual variation, i.e. the values are higher in spring and autumn, but those from Irkutsk and Norilsk are more likely to have annual variations under the effect of polar day and night. Variation amplitudes are the highest at the low-latitude Hainan station. The winter anomaly ( N m F2/ f o F2 is larger in winter than in summer [Rishbeth, 1998]) can be observed at Hainan and Irkutsk, but does not manifest itself at Norilsk that is a specific feature of the high-latitude ionosphere. The f o F2 values are higher near noon and the lowest before sunrise. During high solar activity, f o F2 is continually high after sunset. They exhibit sunset peaks at Hainan in spring and autumn and at Irkutsk in summer. Also, we can see the patterns and values varied weakly from low to high solar activity years at Irkutsk and Norilsk, while the duration of the high daytime f o F2 is obviously larger at increasing solar activity at Hainan.
Similarly, Figure 2, b illustrates the diurnal-seasonal dynamics of hmF2 that shows annual variations at all the three stations. The maximum values are much larger at daytime and nighttime at Hainan than at other two stations during high solar activity. For the diurnal variation, hmF2 values are higher at daytime at Hainan with multi-peak diurnal behavior, but the values are higher at nighttime at Irkutsk and Norilsk, so they have obviously different dynamics. At nighttime, the hmF2 values slightly change with solar activity, especially at the mid-latitude Irkutsk station. Although in winter the values are lower than in summer, there are also sunset peaks in winter at Irkutsk in 2011 and 2012. At Norilsk, hmF2 also has a polar day effect, i.e. low hmF2 values are observed during the polar day in summer [Ratovsky et al., 2013].
There are no enough studies of H T characteristics at different latitudes. Figure 2, c illustrates a diurnal-seasonal H T variation. The H T dynamics from the three stations shows annual variations. As for the diurnal variation at each of the stations, it is high at daytime, maximum near noon, and slightly changes at nighttime.
There are also low sunset peaks in winter at Irkutsk and Norilsk. However, for the seasonal variation, we should note that although the noon maxima at Hainan are higher than those at Irkutsk and Norilsk, the daytime values around the maximum are conversely higher at Irkutsk and Norilsk. The H T variations with solar activity are more obvious at high-latitude Norilsk and have almost no changes with solar activity at mid-latitude Irkutsk. All these features for H T at different latitudes have not been reported before.
To analyze amplitudes of annual and semi-annual variations at different stations during different solar activity, we take noon values of the parameters as in previous studies [Yu et al., 2004]; the results are shown in Figure 3.
Figure 3, a illustrates annual and semi-annual variations of noon f o F2. The noon f o F2 dynamics from the three stations exhibits semi-annual variations, i.e. the values are higher in spring and autumn. The noon f o F2 variations at Hainan have larger amplitudes. The annual
b
is:—
816Е i^A/ifV £ 6r 1 I I
S 4
2 2006i ' 2007
2008 2009
Day / Year
2010 2011 2012
а
Hainan
Norilsk
'M**^^ д»м^
18 8 16 N 14 5 12 5 ю
I 8 £ 6
2006 2007 2008 2009 2010 2011 2012
Day / Year
Irkutsk
N>V'^^
2008 2009 2010
Day / Year
2 2006
Hainan
500“ 450
400 •
350№ 300 If
£ 200
100---------
2008 2009
Day / Year
Irkutsk
Norilsk
350-
jX 300 E
ш 200"
£ 150-
1001---——
2008 2009
Day / Year
Si 400
5 3505.300-E
£ 200
2006 2007
V. 4^
2008 2009 2010 2011 2012
Day / Year
с
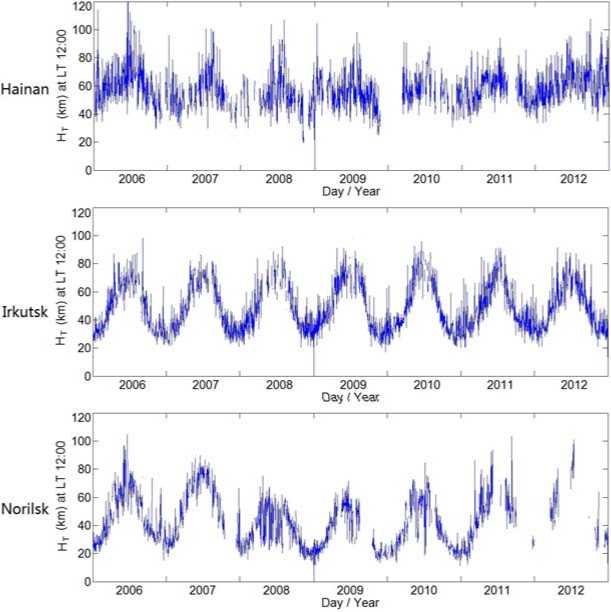
Figure 3. Annual and semi-annual variations of f o F2 ( a ), h m F2 ( b ), and H T ( c ) at three stations from 2006 to 2012
and semiannual variations are stronger at high solar activity, and their amplitudes have the largest enhancements from low to high solar activity at Irkutsk. The winter anomalies occurred every year at Irkutsk; at Hainan, they exist only during high solar activity and are absent at high latitudes.
Figure 3, b shows annual and semi-annual variations of noon h m F2 from the three stations, which reveal annual variations with almost no winter anomalies, i.e. the values are always higher in summer than in winter. The noon h m F2 behavior at Hainan is much disturbed. The annual and semiannual variations differ only slightly during high and low solar activity; at Norilsk in summer at low solar activity they have some disturbances.
The noon H T characteristics at different latitudes have been little studied. Figure 3, c depicts annual and semi-annual H T variations. Noon H T from the three stations reveals annual variations with no winter anomalies, i.e. the values are always higher in summer than in winter. The noon H T behavior at Hainan is much disturbed but also has the smallest amplitudes. Amplitudes of annual and semiannual variations differ only slightly during high and low solar activity at Irkutsk, but at Hainan and Norilsk the amplitudes are smaller during low solar activity.
DISCUSSION
At all latitudes, the diurnal-seasonal variations of ionospheric parameters corresponding to features of the electron density [Rishbeth, 1998] are considered to be caused by a change of the ion production rate controlled by the solar zenith angle, the neutral composition affected by global thermospheric circulation and temper- ature, and by plasma transport related to the neutral wind. The common features of the variations of ionospheric parameters shown in this study can be explained by these factors. As for the features at different latitudes, they might be affected by other factors [Ratovsky et al., 2014]. The low-latitude features can be explained by the influence of the vertical and zonal plasma drifts associated with the low-latitude system of electric fields. The high-latitude features can be attributed to the influence of neutral winds due to high magnetic inclination. The effect of particles and electric fields controlled by the magnetosphere could be taken into consideration.
In this study, as compared with the diurnal-seasonal variation characteristics in East Asian sector, the common features of the f o F2 ( N m F2) and h m F2 variations during the ascending phase (2006–2012) and descending phase (2002–2008) of solar activity are similar, but specific features at different latitudes show some differences [Ratovsky et al., 2014]: (1) there are sunset peaks of f o F2 in summer at midlatitudes and in spring and autumn at low latitude during the ascending phase, but only sunset peaks in summer at midlatitudes during the descending phase; (2) there are sunset peaks of h m F2 in winter at midlatitudes during the ascending phase, and no sunset peaks during the descending phase; (3) during the ascending phase, the h m F2 values have little changes with solar activity at nighttime especially at midlatitudes, but during the descending phase they have nighttime enhancements with solar activity, which are the largest at midlatitudes.
The differences can show some features concerning this mechanism. The evening peaks of foF2 (NmF2) are explained by the equatorward wind induced by the vertical plasma drift at the time near sunset when there is still electron production at F-region heights [Kohl et al., 1968]. The peaks at low latitudes exhibit the wind variation with solar activity. The post-sunset peaks of hmF2 in winter in our statical results are not shown in the results obtained during the descending phase of solar activity [Ratovsky et al., 2014], and the IRI model even does not predict the observed pre-sunrise and post-sunset peaks in hmF2 diurnal behavior [Bilitza, Reinisch, 2007]. The nighttime enhancements with solar activity are not obvious during the ascending phase. Especially at midlatitudes they demonstrate opposite features, therefore they are possibly affected by other factors as well.
The noon and midnight values of ionospheric parameters also have annual and semi-annual variations [Yonezawa, 1971; Rishbeth, 1998], caused by the chemical composition determined by the ratio [O/N2], the temperature variation in the upper atmosphere, and the neutral composition variations in the lower atmosphere.
According to the previous studies [Yonezawa, 1971; Zhao et al., 2007], the annual variations of N mF2 ( f oF2) are larger at high latitudes than at low ones, most pronounced at magnetic latitudes 40°~60°, and usually manifest themselves as a winter anomaly in these regions. The semi-annual variations of N mF2 ( f oF2) are larger at low latitudes than at high ones, and are larger in solar maxima than in minima [Yonezawa, 1967, 1971; Yu et al., 2004]. Most of the features of the noon f oF2 variation are consistent to the previous results. However, it usually shows weak winter anomalies at low latitudes [Yu et al., 2004], but the winter anomalies under study were very strong at low latitudes in 2011 and 2012. The h mF2 value mainly exhibits annual variations which are larger at low latitudes than at high ones, and are larger in summer than in winter [Qian et al., 2013]. The h mF2 variations are consistent to the previous results, but at Norilsk in summer at low solar activity the dynamics show some obvious disturbances, which can be associated with particles and electric fields in polar regions.
At middle and high latitudes, the summer evening time parameters exceed the daytime values (see Figure 2) Klimenko et al. [2015] studied this phenomenon in N mF2 and TEC at two mid-latitude stations and found the phenomenon was a purely summer feature. According to their study, the later sunset and the upward field aligned plasma transport by thermospheric winds might be the drivers and sources for the formation of f oF2 sunset maximum (Figure 2).
The diurnal-seasonal HT variations have common features similar to those obtained in the previous studies at Hainan [Zhang et al., 2006]. They had a noontime peak and a pre-sunrise peak that is most obvious for winter, as well as a clear annual variation with the largest daytime values in summer and the smallest ones in winter. They also showed strong solar activity dependence with the daytime values decreasing with solar ac- tivity. However, the winter sunset peaks are more pronounced at middle and high latitudes, have almost no changes with solar activity at middle latitudes, and show different features of the values around the noontime maximum at different latitudes. These differences from previous studies demonstrate the latitude dependence of HT.
The diurnal-seasonal H T variations and the annual and semi-annual variations of the noon H T show different features for f oF2 and h mF2. This can be helpful for our understanding of different mechanisms in the ionosphere at different latitudes. There is a balance between electron production and loss at the F2 peak height. This balance shows the annual variation like h m F2, but its diurnal behavior is opposite to h mF2. It also exhibits sunset peaks in winter like h m F2. However, the values around the noon maxima are of interest and have an obvious latitude difference. For the noon H T , the maximum values from the three stations in the same year are similar, but variation amplitudes are the lowest at low latitudes, so the yearly difference is mainly attributed to the processes occurring in winter. At low and high latitudes, the noon H T values are more likely to be affected by solar activity than those at midlatitudes.
Список литературы Суточные, сезонные, годовые и полугодовые вариации ионосферных параметров на разных широтах в восточно-азиатском секторе на фазе роста солнечной активности
- Appleton E.V., Naismith R. Some further measurements of upper atmospheric ionization. Proc.e Royal Society of London. Ser. A: Mathematical and Physical Sciences. 1935, vol. 150, iss. 871, pp. 685-708.
- Bhuyan P.K., Chamua M., Bhuyan K., Subrahmanyam P., Garg S.C. Diurnal, seasonal and latitudinal variation of electron density in the topside F-region of the Indian zone ionosphere at solar minimum and comparison with the IRI. J. Atmos. Solar-Terr. Phys. 2003, vol. 65, pp. 359-368.
- Bilitza D., Reinisch B.W. International Reference Ionosphere 2007: Improvements and new parameters. Adv. Space Res. 2008, vol. 42, pp. 599-609.
- Ezquer R.G., Mosert M., Corbella R., Erazu M., Radicella S.M., Cabrera M., de la Zerda L. Day-to-day variability of ionospheric characteristics in the American sector. Adv. Space Res. 2004, vol. 34, pp. 1887-1893.
- Givishvili G.V., Afinogenov Y.A., Garbatsevich V.A., Leshchenko L.N. Stationary large-scale irregularities of the ionosphere. J. Atmos. Terr. Phys. 1982, vol. 44, no. 11, pp. 923-924.
- Hunsucker R.D., Hargreaves J. K. The high-latitude ionosphere and its effects on radio propagation. New York: Cambridge University Press, 2003, 613 p.
- Khmyrov G.M., Galkin I.A., Kozlov A.V., Reinisch B.W., McElroy J., Dozois C. Exploring digisonde ionogram data with SAO-X and DIDBase. 2008, Radio Sounding and Plasma Phys. AIP Conf. Proc. vol. 974, pp. 175-185. DOI: 10.1063/1.2885027, 974.
- Klimenko M.V., Klimenko V.V., Ratovsky K.G., Zakharenkova I.E., Yasyukevich Yu.V., Korenkova N.A., Cherniak Iu.V., Mylnikova A.A. Mid-latitude summer evening anomaly (MSEA) in F2 layer electron density and total electron content at solar minimum. Adv. Space Res. 2015, vol. 56, no. 9, pp. 1951-1960. DOI: 10.1016/j.asr.2015.07.019.
- Kohl H, King J.W., Eccles D. Some effects of neutral air winds on the ionospheric F-layer. J. Atmos. Terr. Phys. 1968, vol. 30, no. 10, pp. 1733-1744.
- Limberger M., Liang W., Schmidt M., Dettmering D., Hugentobler U. Regional representation of F2 Chapman parameters based on electron density profiles. Ann. Geophys. 2013, vol. 31, pp. 2215-2227. 31-2215-2013 DOI: 10.5194/angeo-
- Qian L.Y., Burns A.G., Solomon S.C., Wang W.B. Annual/semiannual variation of the ionosphere. Geophys. Res. Lett. 2013, vol. 40, no. 10, pp. 1928-1933.
- Ratovsky K.G., Oinats A.V., Medvedev A.V. Regular features of the polar ionosphere characteristics from digisonde measurements over Norilsk. Adv. Space Res. 2013, vol. 51, no. 4, pp. 545-553.
- Ratovsky K.G., Shi J.K., Oinats A.V., Romanova E.B. Comparison of diurnal, seasonal and solar cycle variations of high-latitude, mid-latitude and low-latitude ionosphere. Chin. J. Space Sci. 2014, vol. 34, no. 2, pp. 143-153. DOI: 10.11728/cjss2014.02.143.
- Reinisch B.W., Galkin I.A., Khmyrov G., Kozlov A., Kitrosser D.F. Automated collection and dissemination of ionospheric data from the digisonde network. Adv. Radio Sci. 2004, vol. 2, pp. 241-247.
- Rishbeth H. How the thermospheric circulation affects the ionospheric F2-layer. J. Atmos. Solar-Terr. Phys. 1998, vol. 60, no. 14, pp. 1385-1402.
- Yonezawa T. On the seasonal, non-seasonal and semi-annual variations in the peak electron density of the F2 layer at noon in the equatorial zone. J. Radio Res. Laboratories. 1967, vol. 14, no. 71, pp. 1-25.
- Yonezawa T. The solar-activity and latitudinal characteristics of the seasonal, non-seasonal and semi-annual variations in the peak electron densities of the F2-layer at noon and at midnight in middle and low latitudes. J. Atmos. Terr. Phys. 1971, vol. 33, pp. 889-907.
- Yonezawa T., Arima Y. On the seasonal and non-seasonal annual variations and the semi-annual variation in the noon and midnight electron densities of the F2 layer in the middle latitudes. J. Radio Res. Laboratories. 1959, vol. 6, pp. 293-309.
- Yu T., Wan W., Liu L., Zhao B. Global scale annual and semi-annual variations of daytime NmF2 in the high solar activity years. J. Atmos. Solar-Terr. Phys. 2004, vol. 66, pp. 1691-1701.
- Zhang M.L., Reinisch B.W, Shi J.K., Wu S.Z., Wang X. Diurnal and seasonal variation of the ionogram-derived scale height at the F2 peak. Adv. Space Res. 2006, vol. 37, no. 5, pp. 967-971.
- Zhang M.L., Shi J.K., Wang X., Wu S.Z., Zhang S.R. Comparative study of ionospheric characteristic parameters obtained by DPS-4 digisonde with IRI2000 for low latitude station in China. Adv. Space Res. 2004, vol. 33, pp. 869-873.
- Zhao B., Wan W., Liu L., Mao T., Ren Z., Wang M., Christensen A.B. Features of annual and semiannual variations derived from the global ionospheric maps of total electron content. Ann. Geophys. 2007, vol. 25, pp. 2513-2527.
