Symptomatic and Climatic Based Malaria Threat Detection Using Multilevel Thresholding Feed-Forward Neural Network

Author: Abisoye Opeyemi A., Jimoh Gbenga R.
Journal: International Journal of Information Technology and Computer Science(IJITCS) @ijitcs
Article in issue: 8, 2017.
Free access
Recent worldwide medical research is focusing on new intelligence approaches for diagnosis of various infections. The sporadic occurrence of malaria diseases in human has pushed the need to develop computational approaches for its diagnoses. Most existing conventional malaria models for classification problems examine the dynamics of asymptomatic and morphological characteristics of malaria parasite in the thick blood smear, but this study examine the symptomatic characteristics of malaria parasite combined with effects of climatic factor which is a great determinant of malaria severity. The need to predict the occurrence of malaria disease and its outbreak will be helpful to take appropriate actions by individuals, World Health Organizations and Government Agencies and its devastating impact will be reduced. This paper proposed Feed-Forward Back-Propagation (FF_BP) Neural Network model to determine the rate of malaria transmission. Monthly averages of climatic factors; rainfall, temperature and relative humidity with monthly malaria incidences were used as input variables. An optimum threshold value of 0.7100 with classification accuracy 87.56%, sensitivity 96.67% and specificity 76.67% and mean square error of 0.100 were achieved. While, the model malaria threat detection rate was 87.56%, positive predictive value was 89.23%, negative predictive value was 92.00% and the standard deviation is 2.533. The statistical analysis of Feed-Forward Back-Propagation Neural Network model was conducted and its results were compared with other existing models to check its robustness and viability.
Malaria, Feed-Forward Back-Propagation Neural Network (FF_BP), Classification, Symptomatic, Climatic, Multiclass, Multilevel Thresholding
Short address: https://sciup.org/15012672
IDR: 15012672
Text of the scientific article Symptomatic and Climatic Based Malaria Threat Detection Using Multilevel Thresholding Feed-Forward Neural Network
Published Online August 2017 in MECS
-
I. Introduction
Several diseases affects the proper functioning of human‘s health and poor health condition affects one’s life span and achievements. One of such common disease is malaria. According to World Health Organization (WHO) Report in 2015, there are 95 countries and territories with ongoing malaria transmission, and only 6 countries have eliminated malaria(WHO,2015). Globally, an estimated 3.4 billion people are at risk of malaria. WHO estimates that 214 million new cases of malaria occurred globally in 2015 (range 149 -303 million) and an estimated death of 438,000, 000. Most cases (88%) and deaths (90%) occurred in Africa , and most deaths (71%) were in children under 5 years of age (WHO, 2014). WHO has made malaria reduction a chief priority. The idea is to disable the disease by combining virtually every known malaria-fighting technique. Bill Gates, who has called malaria “the worst thing on the planet,” has donated hundreds of millions of dollars to the effort through the Bill and Melinda Gates Foundation. The Bush Administration has pledged 1.2 billion dollars (WHO, 2015). Funds devoted to malaria have doubled since 2003. The idea is to disable the disease by combining virtually every known malaria-fighting technique, from the ancient (Chinese herbal medicines) to the old (bed nets) to the ultramodern (multidrug cocktails). But, the rate at which malaria prevails in the concerned areas seems exponential despite thefact that all hands are on desk to combat the spread and even eradicate the disease (Owoseni and Ogundahunsi, 2016). At the same time, malaria researchers are pursuing a long-sought, elusive goal: a vaccine and methods that would curb the disease for good (WHO, 2014;2015).
Malaria transmission is site specific due to different climatic change of a region. There are three main climatic factors that directly affect malaria transmission. They are temperature, rainfall and relative humidity (Depinay et al , 2004). Several non-climatic factors, such as human or behavioural factors can also affect the pattern of malaria transmission and the severity of the problem. Malaria parasite develops more quickly at higher temperatures. Higher temperatures increase the number of blood meals taken and the number of eggs laid by the mosquitoes, which increases the number of mosquitoes in a given area. The minimum temperature for mosquito development is between 8–10°C; the optimum temperature is 25–27°C, and the maximum temperature is 40°C. Altitude influences the distribution and transmission of malaria indirectly, through its effect on temperature. As altitude increases, temperature decreases, so highlands are colder and lowlands are warmer.
Data mining has great potential for the healthcare systems to use medical data for analysis and to offer improved healthcare at reduced cost. These in health care play a significant role in prediction and diagnosis of various health problems like heart disease, diabetes, malaria, cancer, skin disease and many more(Shetty and Joshi, 2016). Recent researches world widely is focusing on the new applications in the medical field and particularly in diagnosis (Depinay et al 2004).
The healthcare sector is showing inclination towards restructuring of healthcare systems to harmonize with technological innovations and adopting decision support system in routine clinical practices(Alqahtani et al, 2016). Medical experts are now demanding for knowledge intensive Computational Intelligence (CI) and Knowledge Based System(KBS) in finding solutions to medical problems (Adetumbi, Oguntimilehin and Falaki, 2012).
Dynamics of Malaria parasite transmission is complex and been widely studied. Research is needed to understand how the risk of asymptomatic and symptomatic malaria infection changes. Diagnosing asymptomatic malaria transmission is not straightforward due to the obvious lack of clinical manifestations and often sub-patient levels of parasites are undetectable by microscopy (Bottius et al., 1996). The extent of the prevalence of asymptomatic parasitemia in a given population is inversely related to the population’s susceptibility to clinical disease (Bereczky et al . 2007, Mwangi et al., 2008). Asymptomatic malaria infection cases are prevalent in malaria endemic regions and have become a serious cause for concern as efforts are increasing towards eliminating the parasite (Trape, Zoulani & Quinet, (1987).
Consequently, most existing conventional malaria models for classification problems examine the dynamics of asymptomatic and morphological characteristics of malaria parasite. Malaria diagnosis may be asymptomatically or symptomatically low, mild and high. Many symptoms of different patient may even overlap. A malaria patient may even have characteristics of other diseases. Medical problems, therefore, cannot be generalized and analyzed using imagination. An analytical program is desperately required to integrate this complex network of problems and devise individualized solutions (Onuwa, 2014). The need to predict the multiclass symptomatic characteristics of malaria parasite combined with effects of climatic factor which is a great great determinant of malaria severity is of great importance. A huge amount of malaria incidences are captured every year and there are difficulties in predicting its future occurrence and analysis of its possible threats. So the need for a machine learning method arises. Such a machine processes the data and automatically finds structures in the data, i.e. learns. The knowledge about the extracted structure can be used to solve the problem at hand.
-
II. Statement of the Problem
Malaria is still a major public health problem as 109 countries are declared endemic to the diseases (Hay, Gething & Snow, 2010). Virtually all humans are being diagnosed of malaria infections at one time or the other especially in tropical area in Africa and its negative effects increases drastically and cause great harm to human life (Mendis, Sina, Marchesini & Carter (2001). The presence of both symptomatic and asymptomatic diagnostic measure is very vital in detecting the transmission dynamics of malaria infection. To avoid the occurrence of new malaria outbreaks in both endemic and non endemic areas, an improve methods are needed to decrease the parasite sources of infection by active search and treatment of symptomatic and asymptomatic parasite carriers. The aim of this paper is to explore threats and factors that contributes to having malaria and developed Malaria Symptomatic Predicting model to diagnose the severity of malaria parasite.
-
III. Choice of Predicting Model
Conceptualized, data mining and knowledge discovery on the unstructured data is needed to be carried out(Goswami and Chakrabarti, 2014). But the choice of machine learning algorithm to solve a problem always depends on the size, quality, and nature of the data (Djam et al., 2011).
Table 1. Strength and Weaknesses of Various CI tools
|
Characteristics Model |
FL |
ANN |
SVM |
GA |
|
Function Approximate Reasoning |
Mild |
High |
High |
High |
|
Learning Abilities |
Low |
High |
High |
High |
|
Handling of Uncertainties |
High |
High |
High |
High |
|
Fault Tolerance |
Low |
High |
High |
High |
|
Massive Parallelism |
Low |
High |
High |
High |
|
Capability to solve Multiclass Problem |
Low |
High |
Low |
Mild |
|
Threshold Metrics(accuracy) |
Mild |
High |
High |
Mild |
|
Probability Metrics(MSE) |
Low |
Low |
Low |
Low |
|
Rank Metrics(ROC) |
Low |
High |
Mild |
Mild |
|
Training Time |
High |
Low |
Low |
High |
|
Number of Features |
Low |
High |
Mild |
High |
|
Number of Training Data |
Low |
Mild |
Mild |
Mild |
Sources: [Sharma, V., Rai, S., & Dev, A.(2012); Castillo et al., 2001a,b). Karnik and
To produce powerful computing systems, artificial intelligence technologies have a natural effectiveness that can be exploited (Niksaz and Mohammad , 2014).
In this study after consideration of strength and weaknesses of various Computational/Artificial Intelligence (CI) Tools; Fuzzy Logic(FL), Artificial Neural Network(ANN), Support Vector machine(SVM) and Genetic Algorithm(GA), shown in Table 1above is based on the nature, size and quality of the data. The choice of ANN having underlining Feed-Forward Neural Network (FFN) and Back Propagation algo (BPa) was made.
-
IV. Feed- Forward Neural Network(Ffn) and Back Propagation Algorithm(Bpa) Model
A network of perceptrons with a differentiable squashing function, usually the sigmoid (logsig) function is called feed-forward neural network. The back propagation algorithm (BPa) adjusts the weights based on the idea of minimizing the squared error. The differentiable squashing function of feed-forward neural network enables the back propagation algorithm to adjust the weights across multiple hidden layers.
By having multiple nodes on each layer, the Exclusive-OR, or the XOR problem and n-separable problems can be solved by FF_BP- NN could not be solved with only the perceptron. Fig.1 shows a fully connected feedforward neural network; from input to output, each node is connected to every node on the adjacent layers. In this research, a malaria severity analysis based on feed forward-error back-propagation algorithm is proposed. The required parameters are:
-
a. Squashing Function ( Sr )
-
b. I nput vector of the network( ̅ )
-
c. Weight Vector of the network( ̅)
-
d. Neuron Activation function( Фг )
-
e. Error Function(E г )
-
f. Desired Target ( Тт )
-
g. Weight Adjustment(Δ W )
-
h. Learning rate ( ц )
By using the log-sigmoid transfer function the Output function of this FNN Multilayer network is sr ( ̅, ̅) = 1+еФг ( ̅, ̅) (1)
And the error function for the output of each neuron is thus:
E г ( ̅, ̅,T) = ( Sr ( ̅, ̅) - Ту )2 (2)
We take the square of the difference between the output sr ( ̅, ̅) and the desired target Тг because it will be always positive, and because it will be greater if the difference is big, and lesser if the difference is small.
The error of the network will simply be the sum of the errors of all the neurons in the output layer:
E г ( ̅, ̅, ̅) =∑ г ( sr ( ̅, ̅) - ^т ) 2 (3)
Since, the error function for the output of each neuron in equation (1) above is :
E г ( ̅, ̅,T) = ( ST ( ̅, ̅) - Тг ) 2
The back propagation algorithm now calculates how the error depends on the output, inputs, and weights by using the gradient descent method:
л ЭЕ
∆ WT] =- ^ (4)
Thus adjustment of each weight denoted by ∆Wrj is the negative of constant mew (ц) multiplied by derivative of the previous weight dependence on the error of the network. This means that the size of the adjustment depends on mew (ц) and contribution of the weight to the error function. The goal of backpropagation algorithm is to find the derivative of E in respect to Wrj
Firstly we need to calculate how much erro r depends on the output which is:
ар
=2( sr - Tr )
Secondly, how much of the output depends on the activation function which in turn depends on the weight from equation (1) and (2)
Equation (8) above is for training with two layers.
For training with one more layer we need to adjust the y weights say Z j k of previous layer. Firstly we will calculate how the error depends on the input from previous layer rather than on the weight. We only need to change x j in equation (6), (7), (8) above with weight Z j k. Also we can see how the error of the network depends on the adjustment of Z jk in equation (9) and (1.9) below:
Д „ dE dE dxj
∆ ^jk = - = -
Where, asT _ as,. Эфт
dwrj дфг dwrj
= (1- sr ) Xj
=2( sr - Ту ) sr (1- sr ) wTj (10)
UWyj J
Then from (3.48) and (3.49) above
= = 2( sr - Ту ) sr (1- sr ) (7)
О vV yj О vV у j
So the adjustment to each weight from gradient descent function in (4) above is
Consequently, to add another layer to the network, we can calculate how the error depends on the weights and inputs of the previous layers.
Pratically, implementing back propagation algorithm in FNN should not have too many layers since the time for training grows exponentially.
∆ wrj =-2 Ц ( Sr - Tr ) Sr (1- Sr ) Xj (8)
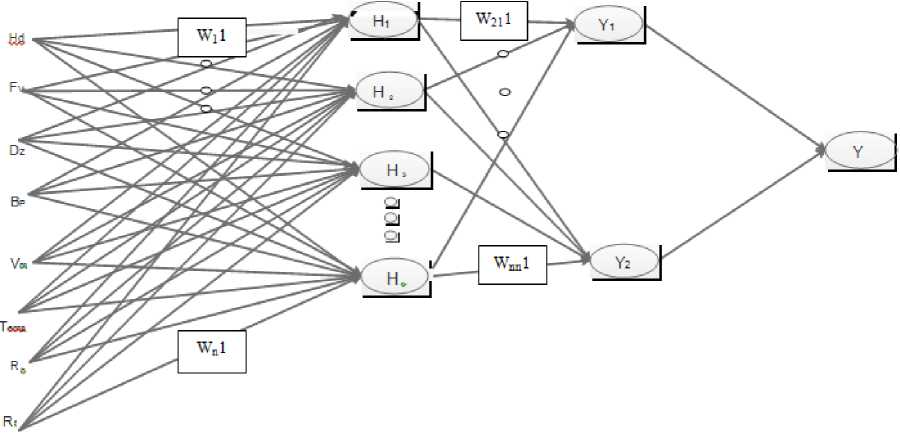
Fig.1. A fully connected Schematic Description of Malaria Feed-Forward Back-Propagation (FF_BP) Neural Network.
-
V. Binary Encoding and Normalization of Dataset Features
Given a number of features, wrapper method was used to select subset of features that have the greatest predictive power and still carry their class discriminatory properties. This research features is thus restricted to five (5) predominant malarial symptoms Headache(H d ), Fever(F v ), Dizziness(D z ), Body Pain(B p ) and Vomiting and three(3) significant climatic factors that contributes to having malaria; Temperature (T emp ), Relative humidity (Rh) and Rainfall.
Table 2. Binary Encoding Threat Classes
|
Malaria parasite Count Multiclass Output(class) |
Malaria parasite Count Binary-class Output |
Output for Qualitative Computation (OPT1 |
Output for Qualitative Computatio n (OPT2) |
|
Insignificant (0) |
Insignificant |
0 |
0 |
|
{ } |
(0) { } |
||
|
Significant(1 |
1 |
||
|
Significant(1) + |
and above ) ≥ + |
0 |
|
|
Highly |
1 |
0 |
|
|
Significant(2)++ |
In this research features with missing data are assigned zero. A typical example is the rainfall data features. In order to standardize the range of independent variables or features of data feature scaling and unitary method were used and the binary encoding threat classes are represented in Table 2.
-
VI. Adaptive Static Thresholding
The Feed-Forward Back-Propagation(FF_BP) Neural Network Model was thresholded to get the optimum threshold value that will yield best result for the model using the adaptive thresholding algorithm in Table 3 below. At training section of the model the thresholding ranges from 0.4 to 1.0 to search for the optimal threshold that gives highest accuracy with low error rate and low standard deviation. At the testing stage, the thresholding algorithm gave the best trade off search of the threshold optimal parameters of accuracy, sensitivity, specificity, false negative and false positive rate.
Table 3. Adaptive Thresholding Algorithm
Input: Training Malaria Datasets
Output: Thresholds Values, Accuracy, Mean and Standard
Deviation
-
1. Begin
-
2. Supply the Malaria Data Features
-
3. Divide the data into Training Malaria Datasets and Testing Malaria Datasets in ratio 70:30
-
4. While Threshold_Value > =0.575 Step 0.05 Do
-
5. While Accuracy_Instances<= No_of _Runs
-
6. Perform ANN Training
-
7. Get Error and Performance Computation
-
8. Simulate with Transposed Testing Malaria Datasets
-
9. Get Simulation Results thresholding
-
10. Get Optimun Threshold_Value
-
11. Compute Threat rate and Classiffication Accuracy
-
12. EndWhile
-
13. Tabulation of Threshold_Value, Accuracy, Mean and Standard Deviation
-
14. EndWhile Threshold_Value = 0.750
-
15. End
-
VII. Result
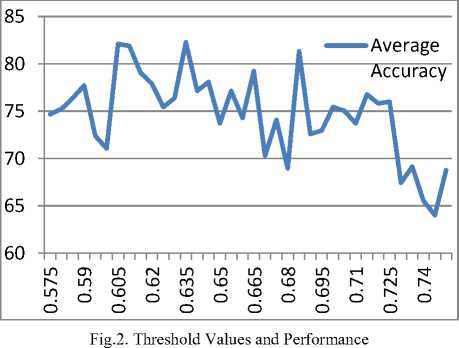
After several iterations of the symptomatic malaria model with (8 X 10 X 2) NN Simulation Structure of the classification algorithm a step size of 0.005 was stabilized to get the local and global maxima concentrated within the region 0.575 to 0.750 output ranges. Figure 3 depict the optimum training threshold Values and Performance on the Training dataset. Table 4. depicts the definition of terms used in taking records of the model. At overall training, the best threshold value of 84.57 at 0.58 was obtained as shown in Fig.3 and Table 5.
Best Training
100 > ro
<

Accuracy
0.655 0.62 0.605 0.58 Threshold
Fig.3. Best Threshold Values and Performance for the developed FeedForward Back-Propagation (FF_BP) Neural Network Modelon Training Dataset
A step size of 0.005 was taken to get the local and global maxima concentrated within the region 0.575 to 0.750, output ranges. Several threshold values were searched to get the best threshold values. The optimal threshold value is then used to test the FeedForward Neural Network Model using the Malaria Threat and Classification Algorithm.
Table 5. Optimum Threshold Values and Performance for the developed Feed-Forward Back-Propagation Neural Network Model on Training Dataset
|
Th |
AC1 |
AC2 |
AC3 |
AC4 |
AC5 |
Avg AC |
STD |
|
0.655 |
77.14286 |
75.2381 |
78.09524 |
78.09524 |
77.14286 |
77.14286 |
1.166424 |
|
0.62 |
82.85714286 |
81.90476 |
80 |
81.90476 |
78.09524 |
80.95238 |
1.904762 |
|
0.605 |
82.85714 |
82.85714 |
80 |
82.85714 |
81.90476 |
82.09524 |
1.241753 |
|
0.58 |
85.71428571 |
85.71429 |
85.71429 |
81.90476 |
83.80952 |
84.57143 |
1.703671 |
Table 4. Definition of terms
|
Acronymns |
Full Meaning |
|
AC1 --- AC5 |
Accuracy for 5 runs from 0.575 to 0.7500 |
|
Avg AC |
Average Accuracy |
|
STD |
Standard Deviation |
|
Th |
Threshold |
|
Thus the best accuracy for Feed-Forward Back- |
threshold frequency 0.58 and 0.715 this was confirmed in |
|
Propagation(FF_BP) Neural Network Model is between |
the testing phase in the Table 6(a) below |
|
Table 6 (a). Optimum Threshold Values and Performance for the developed Feed-Forward Back-Propagation(FF_BP) |
|
|
Neural Network Model on Testing Dataset |
|
|
Th AC1 AC2 AC3 |
AC4 AC5 Avg AC STD |
|
0.64 80 75.55556 82.22222 |
77.77778 82.22222 79.55556 2.897423 |
|
0.685 80 84.44444 82.22222 |
86.66667 80 82.66667 2.897423 |
|
0.715 80 84.44444 86.66667 |
86.66667 86.66667 84.88889 2.897423 |
|
Table 5(a) the least MSE value obtained was 0.1333 |
Standard Deviation of 2.897423 and MSE 0.1333 should |
|
and there is consistency of 2.897423 the least standard |
not be exceeded. This was confirmed in the overall Best |
|
deviation in the iterations. This consistency indicates that |
threshold value and performance depicted in Table 6(b) |
|
to obtain the best accuracy of the model a benchmark of |
|
|
Table 6 (b). Best Threshold Values and Performance for the developed Feed-Forward Back-Propagation |
|
|
(FF_BP) Neural Network Model on Testing Dataset |
|
|
Th AC1 AC2 AC3 |
AC4 AC5 Avg AC STD |
|
0.71 86.66667 86.66667 88.88889 |
84.44444 91.11111 87.55556 2.533723 |
T he ANN Training Performance was evaluated with the use of Mean Square Error (MSE). The MSE value obtained was 0.1000 and the best validation performance is 0.10563 which converges at 2nd Iteration of 8 iterations.
The graph of average accuracy was plotted against threshold values as shown in Fig.4. About twelve (12) local maximum values were obtained and ten (10) local minimum values within 0.575 and 0.7500 threshold ranges. A global maximum is at 0.710 and the highest local minimum is at 0.600.
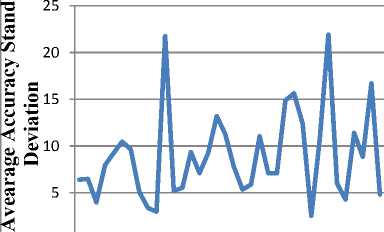
Fig.5. depicts the graph of average standard deviation against threshold values. The least standard deviation of 2.53 was obtained at threshold value 0.710. The highest average accuracy of the model, 87.56% was obtained at threshold value 0.710 with the standard deviation 2.53. The least deviation with the best accuracy was achieved at threshold 0.710 shows the highest reliability and consistency of the threshold.
^ Standard Deviation Vs Threshold Values
Threshold Values
Fig.5. Graph of Average Accuracy Standard Deviation against Threshold Values
у^
и 90
и 80
ы70
Accuracy Vs
Threshold
шсптгмтттсотнт^ ^lЛOЦ)mUDЦ)UDCn^<^l^
.0.0. о о о . о о о о о о о
Threshold Values
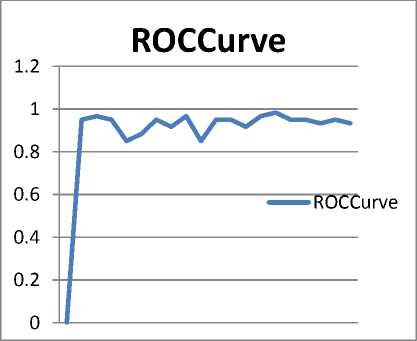
Fig.6. The ROC Representing Malaria Feed Forward Neural Network Detector Performance
Fig.4. Graph of Average Accuracy against against Threshold Values
Receiver Operating Curve (ROC ) curves represent graphical summaries of a detector's performance. Here is the ROC Curve of Malaria Feed Forward Neural network in Fig.6. The Area Under the Curve(AUC) is 0.8667. The maximum AUC is 1, which corresponds to perfect classifier. Larger AUC values indicate better classifier performance.
-
VIII. Result Discussion
Multilevel thresholding was conducted to get the optimum thresholds with the best accuracy at lowest standard deviation and mean square error. The best accuracy of 87.56% was achieved at the threshold level 0.710 with ability of test to identify the infected cases of 96.67 and ability to separate the infected cases from non infected cases is 76.67%. From the Feed-Forward Back-Propagation(FF_BP) Neural Network Malaria Model, 0.710 threshold values indicates that only 71% of the female Anopheles mosquitoes that go for a blood meal survive to lay their eggs at the end of that cycle as they subjected to monthly average daily temperature, rainfall and relative humidity. Temperature is a key factor, once the temperature falls to the sporogonic cycle threshold (18°C) the mosquito’s lifespan may be reduced for the sporogonic cycle to be completed. Most agricultural models use 10-20 mm of rainfall as the threshold meaning no malaria would occur below this level, so 10 mm is used as the threshold amount in these model runs. The effect of rainfall and Temperature is the resulting factor of relative humidity on the model. From the developed ANN model to detect symptomatic and climatic based malaria disease, specificity 76.67% achieved shows that the ability to separate the non infected cases (Class 0) of malaria disease is higher than infected cases. Thus, this research should be improved on by developing an enhanced model that can accurately separate the classes of infected cases. So a hybrid method that complements the weaknesses of one algorithm with the strengths of other and combines the cooperative and competitive characteristics of the individual techniques to produce more accurate results than the individual techniques is proposed.
-
IX. Conclusion
This study has developed a machine learning approach to classify malaria cases according to its severity using Artificial Neural Network in MATLAB Environment. Vector threat and transmission threat are the major threat of symptomatic malaria infections. Factors that contributes to having malaria such as climatic factors; temperature, rainfall and relative humidity were all explored. These factors combined with the symptomatic clinical features were all considered as input features to the machine learning models. This Malaria Feed-Forward Back-Propagation (FF_BP) Neural Network Model proposed can handle dynamics of symptomatic characteristics of malaria parasite with effects of climatic factor which is a great determinant of malaria severity. The model will stand as an alternative cheap and fast healthcare solution and will benefit patient, medical personnel and any individual to perform malaria diagnosis severity in unreachable or underdeveloped areas. Taking effective decision like appropriate medication to prescribe will be guarded by the model. Also this research will benefit the patient by reducing the waiting response time being spent in the hospital.
Acknowledgement
This research was sponsored by Local TETFUND Grant offered by Federal University of Technology, Minna, Niger State, Nigeria.
References Symptomatic and Climatic Based Malaria Threat Detection Using Multilevel Thresholding Feed-Forward Neural Network
- Adetunmbi, A. O., Oguntimilehin, A., & Falaki, S. O. (2012). Web-based medical assistant system for malaria diagnosis and therapy. GESJ: Computer Science and Telecommunications, 1(33), 42-53.
- Alqahtani, S. S., Alshahri, S., Almaleh, A. I., & Nadeem, F. (2016). The Implementation of Clinical Decision Support System: A Case Study in Saudi Arabia.
- Anifowose, F., & Abdulraheem, A. (2011). Fuzzy logic-driven and SVM-driven hybrid computational intelligence models applied to oil and gas reservoir characterization. Journal of Natural Gas Science and Engineering, 3(3), 505-517.
- Bereczky, S., Liljander, A., Rooth, I., Faraja, L., Granath, F., Montgomery, S. M., & Färnert, A. (2007). Multiclonal asymptomatic Plasmodium falciparum infections predict a reduced risk of malaria disease in a Tanzanian population. Microbes and infection, 9(1), 103-110.
- Bottius, E., Guanzirolli, A., Trape, J. F., Rogier, C., Konate, L., & Druilhe, P. (1996). Malaria: even more chronic in nature than previously thought; evidence for subpatent parasitaemia detectable by the polymerase chain reaction. Transactions of the Royal Society of Tropical Medicine and Hygiene, 90(1), 15-19.
- Brauer, F., Castillo-Chavez, C., & Castillo-Chavez, C. (2001). Mathematical models in population biology and epidemiology (Vol. 1). New York: Springer.
- Cherkassky, V., & Mulier, F. M. (2007). Learning from data: concepts, theory, and methods. John Wiley & Sons.
- Depinay, C.M. Mbogo., G. Killeen, B. Knols, J. Beier, J. Carlson, J. Dushoff, P. Billingsley, H. Mwambi, J. Githure, et al.(2004). A simulation model of African anopheles ecology and population dynamics for the analysis of malaria transmission, Malaria J. 3 (1) (29), 2004.
- Djam, X. Y., Wajiga, G. M., Kimbi, Y. H., & Blamah, N. V. (2011). A fuzzy expert system for the management of Malaria. International Journal of Pure and Applied Sciences and Technology,.84-108, ISSN 2229-610.
- Goswami, S., & Chakrabarti, A. (2014). Feature selection: A practitioner view. International Journal of Information Technology and Computer Science (IJITCS), 6(11), 66.
- Hay, S. I., Gething, P. W., & Snow, R. W. (2010).India’s invisible malaria burden. Lancet, 376(9754), 1716.
- Jian, H., & Wenfen, H. (2006). Novel approach to predict potentiality of enhanced oil recovery. In Proc. Soc. Petrol. Engineers Intelligent Energy Conf. Exhibition.
- Karnik, N. N., Mendel, J. M., & Liang, Q. (1999). Type-2 fuzzy logic systems. IEEE transactions on Fuzzy Systems, 7(6), 643-658.
- Mendel, J. M. (2003). Type-2 fuzzy sets: some questions and answers. IEEE Connections, Newsletter of the IEEE Neural Networks Society, 1, 10-13.
- Mendis, K., Sina, B. J., Marchesini, P., & Carter, R. (2001). The neglected burden of Plasmodium vivax malaria. The American journal of tropical medicine and hygiene, 64(1 suppl), 97-106.
- Mwangi, T. W., Fegan, G., Williams, T. N., Kinyanjui, S. M., & Snow, R. W. (2008). Evidence for Over-Dispersion in the Distribution of Clinical Malaria Episodes.
- National Geographic Society, In the Malaria report titled “Malaria—Bedlam in the Blood”, , 2015.
- Niksaz, P., & Mohammad Latif, A. (2014). Rainfall Events Evaluation Using Adaptive Neural-Fuzzy Inference System. International Journal of Information Technology and Computer Science (IJITCS), 6(9), 46.
- Onuwa, O. B. (2014). Fuzzy Expert System for Malaria Diagnosis.
- Owoseni, A. T., & Ogundahunsi, I. O. (2016). Mobile-Based Fuzzy Expert System for Diagnosing Malaria (MFES). International Journal of Information Engineering and Electronic Business, 8(2), 14.
- Shetty, S. P., & Joshi, S. (2016). A Tool for Diabetes Prediction and Monitoring Using Data Mining Technique. International Journal of Information Technology and Computer Science (IJITCS), 8(11), 26.
- Sharma, V., Rai, S., & Dev, A. (2012). A comprehensive study of artificial neural networks. India (International Journal of Advanced Research in Computer Science and Software Engineering, Volume 2, Issue 10).
- Trape, J. F., Zoulani, A., & Quinet, M. C. (1987). Assessment of the incidence and prevalence of clinical malaria in semi-immune children exposed to intense and perennial transmission. American journal of epidemiology, 126(2), 193-201.
- World Health Organization, Fact Sheet: World Malaria Report, 2014.
- World Health Organization, Fact Sheet: World Malaria Report, 2015.
