Territorial decomposition of balanced scorecard for evaluation of primary energy resources in fuel and energy sector in the Northwestern federal district to ensure its sustainable development

Author: Salina Tatyana Konstantinovna
Journal: Economic and Social Changes: Facts, Trends, Forecast @volnc-esc-en
Section: Branch-wise economy
Article in issue: 5 (53) т.10, 2017.
Free access
The research subject in the article is the correlation between evaluation indicators of primary energy resources in the fuel and energy sector in the Northwestern Federal District of the country. The purpose for the study is to evaluate the primary energy resources of the fuel and energy sector in the Northwestern Federal District in terms of economic, technological, energy, social, and environmental parameters with the use of balanced scorecard (BSC) for sustainable development of the sector in the Northwestern Federal District as a whole. Methods. The article proposes the methodology for territorial decomposition of the balanced scorecard for evaluating primary energy resources in the Northwestern Federal District. The region's balanced scorecard decomposition of evaluation of primary energy resources in the case of the Arkhangelsk Oblast fuel and energy sector, including Nenets Autonomous Okrug, is determined; the authors identify the degree of stability of the fuel land energy sector in the Arkhangelsk Oblast, according to the following parameters of sustainable development of the energy sector in the Northwestern Federal District: economic, technological, energy, social, environmental...
Fuel and energy sector, balanced system of indicators, primary energy resources, sustainable development
Short address: https://sciup.org/147223974
IDR: 147223974 | UDC: 338.012 | DOI: 10.15838/esc.2017.5.53.9
Text of the scientific article Territorial decomposition of balanced scorecard for evaluation of primary energy resources in fuel and energy sector in the Northwestern federal district to ensure its sustainable development
Introduction. The concept of sustainable development (SD), according to Agenda 21 adopted at the United Nations Conference on Environment and Development held June 14th, 1992 in Rio de Janeiro, and a number of subsequent documents1 are the basis for the transition to sustainable development. The provisions of the concept are reflected in many international agreements developed on the basis of national concepts of sustainable development, including those published in Russia, such as the Concept of Russia’s transition to sustainable development, the Environmental doctrine of the Russian Federation, the Climate doctrine of the Russian Federation, the Concept of longterm socio-economic development of the Russian Federation up to 2020, the Energy strategy of Russia up to 2030, and other legal acts reflecting the principles of sustainable development, as well as in the works of scholars working on the issues of sustainable development, for example, V.A. Vasilenko [5], Yu.P. Grigorieva [6], and in the proceedings of Institute of the energy strategy [1; 4].
The process of global sustainable development is based on the influence of global factors and the consideration of specific characteristics of each country’s economy, its resource potential, economic, natural, geographical, and other conditions, namely, the components which form the framework of the system of sustainable development. In this regard, trends in the study of the issues of interaction between the society and environment, between nature and human activities become relevant.
In order to achieve sustainable development it is necessary to develop appropriate mechanisms to manage the sustainability of national economies, as well as its constituent regions [5] and industries, including fuel and energy complex (e.g., V.I. Kalika [10], T.A. Moiseen-kova [12], Grigor’eva Yu.P. [7; 8]). In this term, the goal of the fuel and energy complex (FEC) is to meet the population’s needs in energy resources at economically reasonable prices, maintain the stability of the energy market and ensure environmental safety [2; 9].
The essence of the strategies of socioeconomic development of the state, namely the Concept of socio-economic development of Russia up to 2020, the Strategy for socioeconomic development of the Northwestern federal district (NWFD), as well as the Energy strategy up to 2030 (ES-2030) focused on innovative and sustainable development of FEC as a driver of economic growth is that they have a direct impact on the socio-economic development of the country in general and the Northwestern federal district in particular: on the achievement of economic growth, increase in population’s welfare [8]. In this context, the study of the role of FEC in sustainable development of the country as a complex multilevel system becomes highly relevant.
Russia’s Northwestern federal district is a major promising area of FEC development in the European Russia. The raw material profile of the region Is in the long term attributed to geographic proximity to major energy consumers and export pipeline systems.
Most modern FEC development scenarios for the country in general and NWFD in particular originate from the key role of primary energy resources (PER)2 in the energy supply of the national economy [13]. Changes in conditions of FEC functioning, namely depletion of the developing supplies of energy resources, increasing competition for access to new mineral deposits, the influence of natural factors, the need for development of underdeveloped less efficient resource deposits, deposits located in remote areas with harsh geological and climatic conditions, and the need to develop the necessary infrastructure.
Thus, the development of economic tools for sustainable development of FEC in the NWFD3 which would take into account economic, technological, energy, social, and environmental aspects of its functioning, as well as its components, namely FEC of its entities forming the FEC in the NWFD is an urgent objective [13].
In the article, the author offers balanced scorecard (BSC) assessment of PER of FEC in NWFD in general and of its separate elements as an economic tool for sustainable development of FEC in NWFD since this system has an advantage: there is a possibility to interrelate economic, technological, energy, social, and environmental parameters of functioning of FEC in NWFD. More about the advantages of BSC see in works by M.G. Brown [3], D. Norton and R. Kaplan [11; 19; 20] and other foreign studies [16; 17; 18].
The nature and content of BSC assessment of primary energy resources to ensure sustainable development of FEC in NWFD is covered in [18]. The article proposes a decomposition of BSC assessment of primary energy resources for individual entities in NWFD.
1. The decomposition methodology of the BSC assessment of primary energy resources of FEC in NWFD.
Decomposition to lower management levels of sustainable development of FEC in NWFD is carried out according to the development objectives so that the objectives of lower levels are not contrary to those of higher levels. The
BSC, level 1
Assessment of PER of FEC in NWFD in general
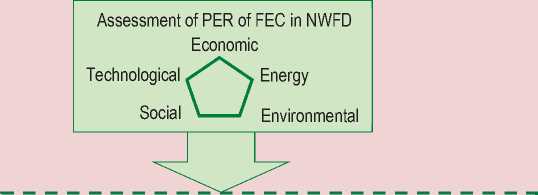
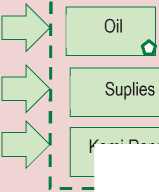
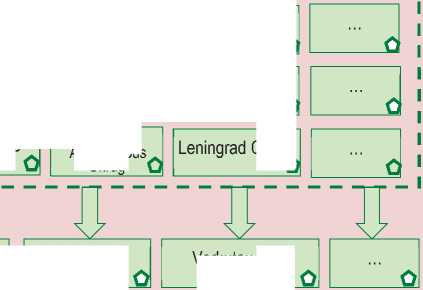
Figure 1. Horizontal and vertical decomposition of BSC assessment of primary energy resources
BSC, level 2
Assessment of specific types of PER (activity) of NWFD constituent entities
Komi Republic
LUKOIL
____О
BSC, level 3 Assessment of economic entites in NWFD

Drilling
с
о
Nenets Autonomous Okrug renewable energy sources (RES) Q
Oblast о
Gas
о
Coal
Capacities
GAZPROM
Vorkutaugol'


Horizontal decomposition

о – assessment is carried out by 5 parameters: economic, technological, energy, social, and environmental construction of BSC assessment of primary energy resources of a single entity in NWFD is advisable to be carried out according to specific features of a specific constituent entity of the Russian Federation which is a part of NWFD and produces energy resources. Goals of sustainable development of entities in NWFD should contribute to the achievement of the development goals of the entire complex.
According to the proposed approach, the decomposition of BSC assessment of PER in NWFD can be carried out in two directions ( Fig. 1 ):
– horizontally (at the same hierarchical level): resource decomposition (by type of energy resource); process decomposition (by type of a process [7]);
– vertically – involvement of other management levels (territorial decomposition).
The article proposes the methodology for territorial decomposition of BSC assessment of PER in constituent entities of NWFD.
The territorial decomposition is carries out in order to:
-
1. Develop the indicators for assessment of PER of a constituent entity of the Russian Federation according to parameters of sustainable development of FEC in NWFD (economic, technological, energy, social, environmental);
-
2. Reflect the contribution of individual constituent entities of the Russian Federation to the achievement of target values of indicators of assessing PER.
-
3. Focus the management processes on key framework indicators for assessing PER to ensure sustainable development of FEC in NWFD.
The territorial decomposition of BSC is performed according to the following steps:
-
1. Defining the territorial structure of decomposition. Target indicators and their values for a constituent entity of the Russian Federation are formulated depending on the economic situation in the region. BSC in general acts as a framework within which BSC assessment of PER of a constituent entity in NWFD is formed for a lower level.
-
2. Framing of development goals for FEC of a NWFD constituent entity in the framework of general goals of sustainable development of FEC in NWFD.
-
3. Development of indicators for assessment of PER. The indicators are fully transferred from BSC assessment of PER of FEC in NWFD to regions. However, their target and threshold values may be adjusted depending on specific characteristics of the region on coordination with higher management levels in a way that does not contradict to sustainable development of the entire complex.
-
4. Reflection of cause-and-effect relations between parameters of sustainable development and their indicators (PER scorecard). PER scorecard reflects cause-and-effect relations between separate PER assessment indicators. Cause-and-effect relations are reflected in the scorecard in the following objectives:
-
– to demonstrate the relations and correlation between performance indicators;
– to reveal the mutual effects arising from the implementation of sustainable development objectives;
– to provide a common understanding of the state of FEC sustainable development;
– to ensure the achievement of goals of sustainable development;
– to contribute to the establishment of the management hierarchy.
-
5. The establishment of target indicator values. Assessments of PER of FEC in NWFD for its constituent entities are established based on target values of indicators. But, depending on specific characteristics of the region, they can change their value by decision of the governing bodies with stating the reason.
-
6. Threshold values of indicators. Threshold values for indicators are set to determine the degree of stability of development of FEC in NWFD.
A threshold indicator value is the value of the indicator of PER, the achievement or exceeding of which is considered as a transition of the given indicator to a qualitatively new larger area of with higher loss of sustainable development in FEC of the region. The degree of sustainability of the region’s FEC is a conditional indicator characterizing the degree of achievement of target indicator values of assessment of PER for sustainable development of FEC of the region.
The author presents the following degrees of sustainable development of FEC in the region for each parameter. In turn, the borderline state and the state of instability are divided into three stages:
-
I. Sustainable development (SD) – achieving or improving of target indicator values.
-
II. Borderline state (BS): minor loss of sustainability (MLS) – a deviation of not more than 10% from target values of indicator of PER assessment; increasing sustainability loss (ISL) not more than 20%; the stage of transition to the state of unsustainable development (TSD) – no more than 30%.
-
III. Unsustainable development: the initial stage of unsustainable development (NSNU) – not more than 40%; significant loss of development sustainability (SLDS) – not more than 50%; complete loss of development sustainability (CLDS) – more than 50%.
-
7. Assessment and specification of the degree of stability. The specification of FEC sustainability may be conducted based on the approach proposed in [7].
-
8. Documentation of results.
-
9. Coordination of decomposition results with higher levels of management. At this stage, depending on the obtained evaluation results, management influence may be adjusted to ensure sustainable development.
-
10. Comparison of assessment results with the FEC development goals in the region. At this stage, it is necessary to define the contribution of NWFD constituent entity in achieving the goals of sustainable development of FEC in NWFD. The goals at all management levels can be adjusted in order to develop mechanisms to achieve them.
-
2. Territorial decomposition of BSC assessment of PER (the case of the Arkhangelsk Oblast, including Nenets Autonomous Okrug).
-
2.1. The structure of the territorial decomposition of BSC.
-
2.2. Formulating FEC development goals in the Arkhangelsk Oblast and formation of indicators to assess primary energy resources.
-
2.3. PER scorecard in the Arkhangelsk Oblast.
The boundaries of states of sustainability may vary depending on the purpose of analysis and the state of FEC development, as well as on strategic goals of its development.
Territorial decomposition is carried out for regions producing energy resources. In the article, the BSC decomposition will be carried out in the case of the Arkhangelsk Oblast.
When forming BSC assessment of PER in the Arkhangelsk Oblast, assessment indicators are fully transferred from the total BSC. In this case, the contribution of FEC in NWFD in the achievement of target indicator values of FEC in NWFD is determined ( Tab. 1 ).
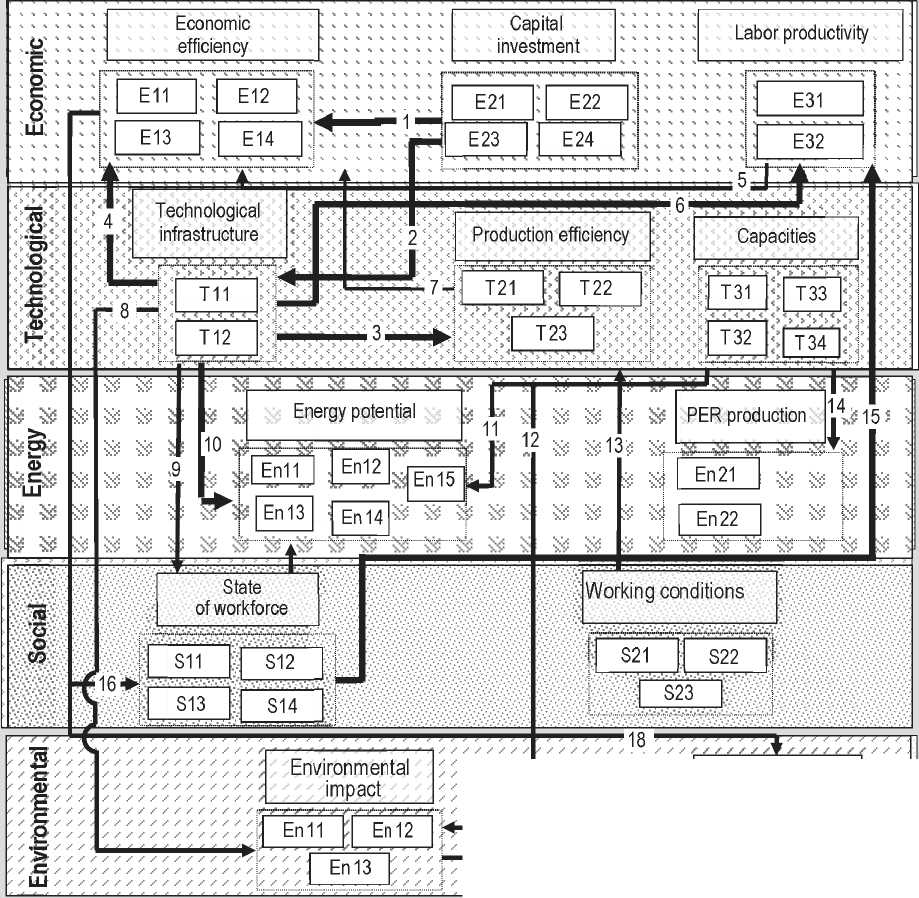
PER scorecard in the Arkhangelsk Oblast is created on the basis of overall scorecard of PER assessment of FEC in NWFD ( Fig. 2 ).
Documentation of cause-and-effect correlation between separate indicators is carried out simultaneously with their development. The correlation is characterized by the following data: number of correlation, indicator which has an influence or is influenced; “transcript” of the correlation; how the change in A parameter value influences the achievement or non-achievement of the target parameter value; brief description of correlation content.
-
(1) strong influence. Short-term investments (E21, E22, E23) adversely affect the indicators of economic efficiency. At the beginning of the period there is an increase in the cost, later – a decrease.
-
(2) strong influence. Capital investments (E21, E22, E23) have a direct impact on the technological infrastructure (T11, T12) of the production process. Investments in modern equipment and technology improves the condition of fixed assets and increases innovation activity of fuel enterprises.
-
(3) strong influence. The technological infrastructure (T11, T12) of the production process has a direct impact on PER production efficiency (T21, T22, T23). The better the condition of fixed assets, the higher innovative activity, the higher is the efficiency of natural resource management (oil recovery rate, oil gas use rate).
Table 1. Documentation of sustainable development goals and indicators for assessing PER in the Arkhangelsk Oblast (AO)
|
Goal of SD |
1 |
No. E1 (AO) |
|
|
Parameter of SD of FEC in NWFD |
Economic |
||
|
Goal subject |
Ensuring economic efficiency of PER production to ensure SD of EFC in NWFD |
||
|
Goal validation |
Achieved through reducing the cost of PER production and financial sustainability |
||
|
Assessment indicators |
Cost development rate Change in production costs per 1 RUR of gross output (GO) PER production profitability Financial sustainability |
E11 ( АО ) E12 ( АО ) E13 ( АО ) E14 ( АО ) |
|
|
Period |
Up to 2030 |
||
|
Goal of SD |
No. E2( АО ) |
||
|
Parameter of SD of FEC in NWFD |
Economic |
||
|
Goal subject |
Increase in capital investment (CI) in PER production |
||
|
Goal validation |
Contributes to modernization and increased efficiency of FEC functioning in NWFD |
||
|
Assessment indicators |
Capital investment growth rate Specific capital investment per one PER unit Specific costs of innovation per one PER unit |
E21 (АО) E22 (АО) E23 (АО) |
|
|
Period |
Up to 2030 |
||
|
Goal of SD |
No. E3( АО ) |
||
|
Parameter of SD of FEC in NWFD |
Economic |
||
|
Goal subject |
Increase in labor productivity |
||
|
Goal validation |
Will improve production efficiency |
||
|
Assessment indicators |
Labor productivity growth rate Share of GO growth rate due to increased labor productivity |
E31 (АО) E32 (АО) |
|
|
Period |
Up to 2030 |
||
|
Goal of SD |
No.T1( АО ) |
||
|
Parameter of SD of FEC in NWFD |
Technological |
||
|
Goal subject |
Modernization of PER production capacities |
||
|
Goal validation |
Will increase PER production efficiency |
||
|
Assessment indicators |
Degree of depreciation of fixed assets Innovation activity |
T11 (АО) T12 (АО) |
|
|
Period |
Up to 2030 |
||
|
Goal of SD |
No. Т 2( АО ) |
||
|
Parameter of SD of FEC in NWFD |
Technological |
||
|
Goal subject |
Increase in PER production efficiency |
||
|
Goal validation |
Will decrease PER production costs |
||
|
Assessment indicators |
Mineral resource management efficiency Accident rate Energy consumption |
Т21 (АО) Т22 (АО) Т23 (АО) |
|
|
Period |
Up to 2030 |
||
|
Goal of SD |
No. Т 3( АО ) |
||
|
Parameter of SD of FEC in NWFD |
Technological |
||
|
Goal subject |
Development of PER production capacities |
||
|
Goal validation |
Will help meet the need for PER |
||
|
Assessment indicators |
Compliance of capacities to region’s needs Share of new capacities in the total PER production output Share of Russian equipment |
Т31 (АО) Т32 (АО) Т33 (АО) |
|
End of Table 1
|
Period |
Up to 2030 |
||
|
Goal of SD |
No. En1(АО) |
||
|
Parameter of SD of FEC in NWFD |
Energy |
||
|
Goal subject |
Reproduction of fuel and energy resources (FER) |
||
|
Goal validation |
Ensuring reliable energy supply services for the population |
||
|
Assessment indicators |
Access of the district to its own PER Rate of increase in FER supply Renewability of FER supplies Compliance of energy consumption to region’s needs PER production increase rate |
En11 (АО) En12 (АО) En13 (АО) En14 (АО) En15 (АО) |
|
|
Period |
Up to 2030 |
||
|
Goal of SD |
No. En2(АО) |
||
|
Parameter of SD of FEC in NWFD |
Energy |
||
|
Goal subject |
Rationalization of PER production structure |
||
|
Goal validation |
Meeting the need for PER |
||
|
Assessment indicators |
Share of FER supplies in new deposits Share of FER production in complex deposits |
En21 (АО) En22 (АО) |
|
|
Period |
Up to 2030 |
||
|
Goal of SD |
No. S1(АО) |
||
|
Parameter of SD of FEC in NWFD |
Social |
||
|
Goal subject |
Development and increased use of human potential |
||
|
Goal validation |
Increasing the quality of human potential |
||
|
Assessment indicators |
Share of the employed, under 40 Share of the employed with higher (professional) education Share of loss of working hours Personnel turnover |
S11 ( АО ) S12 ( АО ) S13 ( АО ) S14 ( АО ) |
|
|
Period |
Up to 2030 |
||
|
Goal of SD |
No. S2(АО) |
||
|
Parameter of SD of FEC in NWFD |
Social |
||
|
Goal subject |
Increased social responsibility and satisfaction of the employees |
||
|
Goal validation |
Increasing the quality of human potential |
||
|
Assessment indicators |
Salary rate (compared to the district) Danger coefficient Average period of training for one employee |
S21 (АО) S22 (АО) S23 (АО) |
|
|
Period |
Up to 2030 |
||
|
Goal of SD |
No. Ec1(АО) |
||
|
Parameter of SD of FEC in NWFD |
Environmental |
||
|
Goal subject |
Reduced emission of pollutants into the environment |
||
|
Goal validation |
Natural resource management |
||
|
Assessment indicators |
Environmental friendliness (share of toxic emissions) Share of generated waste Share of water consumption |
Ec11 ( АО ) Ec12 ( АО ) Ec13 ( АО ) |
|
|
Period |
Up to 2030 |
||
|
Goal of SD |
No. Ec2( АО ) |
||
|
Parameter of SD of FEC in NWFD |
Environmental |
||
|
Goal subject |
Elimination of consequences of PER production |
||
|
Goal validation |
Restoration of environment |
||
|
Assessment indicators |
Level of land re-cultivation Rate of expansion of disturbed lands Rate of increase of mud pits |
Ec21 ( АО ) Ec22 ( АО ) Ec23 ( АО ) |
|
|
Period |
Up to 2030 |
||
Figure 2. PER scorecard assessment in the Arkhangelsk Oblast
Т 31
Т 33
T11
Т 12
Т 34
En11
Working conditions
S21
S22
S11
S12
S23
S13
S14
En11
En12
State of workforce
Labor productivity
E11
E12
E31
E21
E22
E13
E14
E23
E24
E32
Capacities
Production efficiency
Т 21
Т 22
Т 23
Т 32
PER production
12 13
En12
En21
En15
En13
En22
En13
Technological infrastructure
Capital investment
Economic efficiency
Environmental impact
Energy potential
&2& ф &ш&
14 15
Elimination of consequences
En21
En22
-
(4) strong influence. The technological infrastructure (T11, T12) of the production process has a direct impact on production efficiency (E11, E12, E13, E14, E15). This correlation is due to the fact that the condition of fixed assets and innovative activities affects the growth rate of PER cost, profitability, etc.
-
(5) moderate mutual influence. Labor productivity (E31, E32) has an impact on economic efficiency (E11, E12, E13, E14). The
more gross output per one employee engaged in production of PER, the more economically efficient it is. On the other hand, the more capital investments, the higher is labor productivity through the use of modern technology.
-
(6) strong influence. The technological infrastructure (T11, T12) of the production process has a direct impact on productivity.
-
(7) moderate influence. The efficiency of the production process (T21, T22, T23) has an
impact on economic efficiency (E11, E12, E13, E14) since, for example, accident elimination requires costs.
-
(8) rather strong influence. The technological infrastructure (T11, T12) in PER production has a direct impact on the environment (accident spills due to deterioration of equipment).
-
(9) strong influence. The technological infrastructure (T11, T12) in PER production characterizes the working conditions.
-
(10) strong influence. The technological infrastructure (T11, T12) of the production process characterizes the reproductive capacity of the district. This is due to the fact that there are resource supplies whose development is possible only with the use of modern equipment.
-
(11) strong influence. Production capacity (T31, T32, T33, T34) affect the possibilities of reproduction, as well as on the formation of the energy potential of NWFD.
-
(12) rather strong influence. PER production (T21, T22, T23) has a direct impact on the environment (accident spills due to deterioration of equipment).
-
(13) rather strong influence. The satisfaction of employees affects the production efficiency as the better the working conditions (C21, C22, C23) the higher is PER production efficiency.
-
(14) rather strong influence. Due to the development of capacities (T31, T32, T33, T34) it becomes possible to satisfy the energy demand by developing new deposits.
-
(15) strong influence. The state of workforce (C11, C12, C13, C14) has a direct impact on productivity.
-
(16) rather strong influence. The higher the quality of workforce (C11, C12, C13, C14) the greater is the cost of its content (E11, E12, E13, E14).
-
(17) rather strong influence. The greater the negative impact on the environment (Ec11, Ec12, Ec13), the higher is the scale of consequences for elimination (Ec21, Ec22).
-
(18) rather strong influence. In order to eliminate the consequences of environmental impacts (oil spills, sludge pits, etc.) (Ec21, Ec22) it is necessary to invest (E11, E12, E13, E14).
-
2.4. The establishment of target values of indicators of assessment of primary energy resources in the Arkhangelsk Oblast.
-
2.5. Threshold indicator values .
-
2.6. The evaluation and determination of the degree of sustainability.
Target values are set for all regions in NWFD for periods of implementation of strategic documents (ES-2030) broken down into three periods based on the experience of leading companies of ES-2030, research of designated organizations. More about the rationale of indicators and their target values see in [14]. Further we perform the documentation of target values of indicators of PER assessment and establishment of their actual values ( Tab. 2 ).
Threshold indicator values are defined according to the method proposed in [7]. Table 3 demonstrates the results of threshold indicator values iterations for assessing PER in the Arkhangelsk Oblast.
The results of determining the degree of sustainability of FEC in the Arkhangelsk Oblast as a whole and by individual parameters are given in Table 4 .
Conclusion
Based on the assessment we can draw the following conclusion: sustainable development is achieved only by the energy parameter. This is due to the fact that this constituent entity of the Northwestern FD possesses PER
Table 2. Documentation of actual values of indicators of an estimation of primary energy*
PER assessment indicator Target value Actual value (2014) Economic parameter PER cost increase rate, % No more than 110 92 Change in production costs per 1 ruble of gross output, RUR/RUR No more than 0 -0.08 PER production profitability, % No less than 15 -14.9 Financial sustainability, relative units No less than 1,9 0.58 Capital investment growth rate, % No less than 120 91 Capital investment ratio per TFOE, RUR./ TFOE No less than 3200 1919 R&D costs ratio per PER, RUR./TFOE No less than 50 Not published Labor productivity increase rate, % No less than 110 98 Share of gross output increase by means of LP, % No less than 5 -0.02 Technological parameter Degree of fix assets depreciation, % No more than 48 44.9 Innovation activity, relative units No less than 0.7 0.339 Natural resource management efficiency, % No less than 127 113 Risk of accidents, units/TFOE. No more than 100 144 Energy consumption, TFOE./thou TFOE No more than 12 52.25 Compliance of capacities to region’s needs, % No less than 150 160 Share of new capacities in the total PER production output, % No less than 27 7.6 Share of Russian equipment, % No more than 20 74 Energy parameter Access of the district to its own PER, % No less than 102 150 Rate of increase in FER supply, % No less than 103 120 Reproduction of FER, % No less than 130 135 Compliance of energy consumption to region’s needs, % No less than 110 200 PER production increase rate, % No less than 103 106 Share of FER supplies in new deposits, % No less than 12 13 Share of FER production in complex deposits, % No less than 10 100 Social parameter Share of the employed, under 40, % No less than 30 29 Share of the employed with higher (professional) education, % No less than 60 26.5 Average number of training hours per 1 employee, No less than 78 45 Loss of working hours rate, % No more than 4 3.2 Personnel turnover rate, % No more than12 48 Salary rate, % No less than 150 253 Danger coefficient No more than 7.6 9.7 Environmental parameter Environmental friendliness, kg/TFOE No more than 70 90 Share of generated waste, kg/TFOE No more than 5 6.3 Share of water consumption, m3/TFOE No more than 3.5 2.5 Level of land re-cultivation from yearly disturbance, % No less than 65 70 Rate of expansion of disturbed lands, % No more than 100 112 Rate of increase of mud pits, % No more than 100 115 * Compiled from statistical data on the Arkhangelsk Oblast, including the Nenets Autonomous Okrug: Arkhangel’skaya oblast’ v tsifrakh. 2015: kr. stat. sb. [Arkhangelsk Oblast in numbers: brief statistical book]. Federal State Statistics Service, (Arkhangelskstat). Arkhangelsk, 2016. 235 p.; O sostoyanii i ispol’zovanii mineral’no-syr’evykh resursov Rossiiskoi Federatsii v 2014 godu: Gosudarstvennyi doklad [On the state and use of mineral resources of the Russian Federation in 2014: State report]. Moscow, 2015. Available at: ru/upload/iblock/331/ (accessed: October, 2016.); O sostoyanii okruzhayushchei sredy v Nenetskom avtonomnom okruge v 2014 godu: doklad [On the state of environment in the Nenets Autonomous Okrug in 2014; report]. Available at: ru/doklady-i-otchety-o-deyatelnosti/doklady-o-sostoyanii-okruzhayushej-sredy-v-neneckom-avtonomnom-okruge/ (accessed: October, 2016); Promyshlennost’ Rossii. 2014: stat. sb. [Industry of Russia, 2014; statistical book]. Rosstat. Moscow, 2014. 326 p.; Regiony Ros-sii. Sotsial’no-ekonomicheskie pokazateli. 2015: stat. sb. [Russian regions. Socio-economic indicators, 2015: statistical book]. Rosstat. Moscow, 2015. 1266 p.; Rossiiskii statisticheskii ezhegodnik. 2015: stat. sb. [Russian statistics yearbook, 2015: statistical book]. Rosstat. Moscow, 2015. 728 p.; Statisticheskii ezhegodnik Arkhangel’skoi oblasti. 2014:stat. sb. [Statistics yearbook of the Arkhangelsk Oblast, 2014: statistical book]. Federa;l State Statistics Service, Arkhangelskstat. Arkhangelsk, 2015. 187 p.
Table 3. Threshold values for determining the degree of FEC sustainability in the Arkhangelsk Oblast including Nenets Autonomous Okrug
|
PER assessment indicators |
Threshold values |
||||||
|
Borderline state (BS) |
Unsustainable development (USD) |
||||||
|
MLS |
ISL |
TSD |
ISUD |
SLDS |
CLDS |
||
|
Economic parameter |
|||||||
|
E1 |
110 |
121 |
133.1 |
146.41 |
161.051 |
177.1561 |
|
|
E2 |
0.1 |
0.11 |
0.121 |
0.1331 |
0.14641 |
0.161051 |
|
|
E3 |
15 |
13.5 |
12.15 |
10.935 |
9.8415 |
8.85735 |
|
|
E4 |
1.9 |
1.71 |
1.539 |
1.3851 |
1.24659 |
1.121931 |
|
|
E5 |
120 |
108 |
97.2 |
87.48 |
78.732 |
70.8588 |
|
|
E6 |
3200 |
2880 |
2592 |
2332.8 |
2099.52 |
1889.568 |
|
|
E7 |
50 |
45 |
40.5 |
36.45 |
32.805 |
29.5245 |
|
|
E8 |
110 |
99 |
89.1 |
80.19 |
72.171 |
64.9539 |
|
|
E9 |
5 |
4.5 |
4.05 |
3.645 |
3.2805 |
2.95245 |
|
|
Technological parameter |
|||||||
|
Т1 |
48 |
52.8 |
58.08 |
63.888 |
70.2768 |
77.30448 |
|
|
Т2 |
0.7 |
0.63 |
0.567 |
0.5103 |
0.45927 |
0.413343 |
|
|
Т3 |
127 |
114.3 |
102.87 |
92.583 |
83.3247 |
74.99223 |
|
|
Т4 |
100 |
110 |
121 |
133.1 |
146.41 |
161.051 |
|
|
Т5 |
12 |
13.2 |
14.52 |
15.972 |
17.5692 |
19.32612 |
|
|
Т6 |
150 |
135 |
121.5 |
109.35 |
98.415 |
88.5735 |
|
|
Т7 |
27 |
24.3 |
21.87 |
19.683 |
17.7147 |
15.94323 |
|
|
Т8 |
20 |
22 |
24.2 |
26.62 |
29.282 |
32.2102 |
|
|
Energy parameter |
|||||||
|
En1 |
102 |
91.8 |
82.62 |
74.358 |
66.9222 |
60.22998 |
|
|
En2 |
103 |
92.7 |
83.43 |
75.087 |
67.5783 |
60.82047 |
|
|
En3 |
130 |
117 |
105.3 |
94.77 |
85.293 |
76.7637 |
|
|
En4 |
110 |
99 |
89.1 |
80.19 |
72.171 |
64.9539 |
|
|
En5 |
103 |
92.7 |
83.43 |
75.087 |
67.5783 |
60.82047 |
|
|
En6 |
12 |
10.8 |
9.72 |
8.748 |
7.8732 |
7.08588 |
|
|
En7 |
10 |
9 |
8.1 |
7.29 |
6.561 |
5.9049 |
|
|
Social parameter |
|||||||
|
S1 |
30 |
27 |
24.3 |
21.87 |
19.683 |
17.7147 |
|
|
S2 |
60 |
54 |
48.6 |
43.74 |
39.366 |
35.4294 |
|
|
S3 |
78 |
70.2 |
63.18 |
56.862 |
51.1758 |
46.05822 |
|
|
S4 |
4 |
4.4 |
4.84 |
5.324 |
5.8564 |
6.44204 |
|
|
S5 |
12 |
13.2 |
14.52 |
15.972 |
17.5692 |
19.32612 |
|
|
S6 |
150 |
135 |
121.5 |
109.35 |
98.415 |
88.5735 |
|
|
S7 |
7.6 |
8.36 |
9.196 |
10.1156 |
11.12716 |
12.239876 |
|
|
Environmental parameter |
|||||||
|
Ec1 |
70 |
77 |
84.7 |
93.17 |
102.487 |
112.7357 |
|
|
Ec2 |
5 |
5.5 |
6.05 |
6.655 |
7.3205 |
8.05255 |
|
|
Ec3 |
3.5 |
3.85 |
4.235 |
4.6585 |
5.12435 |
5.636785 |
|
|
Ec4 |
65 |
58.5 |
52.65 |
47.385 |
42.6465 |
38.38185 |
|
|
Ec5 |
100 |
110 |
121 |
133.1 |
146.41 |
161.051 |
|
|
Ec6 |
100 |
110 |
121 |
133.1 |
146.41 |
161.051 |
|
Table 4. Determination of the degree of sustainability of FEC development in the Arkhangelsk Oblast including Nenets Autonomous Okrug
|
Parameter |
Normalized valuesof degrees of FEC development sustainability in NWFD |
Parameter assessment |
State of FEC in NWFD |
|||||
|
BS |
USD |
|||||||
|
MLS |
ISL |
TSD |
ISUD |
SLDS |
CLDS |
|||
|
Economic |
0.00 |
0.35 |
0.69 |
1.00 |
1.30 |
1.59 |
1.79 |
Complete loss of development sustainability |
|
Technological |
0.00 |
0.35 |
0.00 |
0.34 |
0.67 |
1.00 |
1.94 |
Complete loss of development sustainability |
|
Energy |
0.00 |
0.37 |
0.70 |
1.00 |
1.27 |
1.51 |
0.00 |
Sustainable development |
|
Social |
0.00 |
0.34 |
0.67 |
1.00 |
1.33 |
1.65 |
1.5 |
Significant loss of development sustainability |
|
Environmental |
0.00 |
0.31 |
0.65 |
1.00 |
1.38 |
1.79 |
0.59 |
Increasing loss of development sustainability |
|
FEC |
0.00 |
0.34 |
0.67 |
1.00 |
1.32 |
1.64 |
1.16 |
Initial state of unsustainable development |
References Territorial decomposition of balanced scorecard for evaluation of primary energy resources in fuel and energy sector in the Northwestern federal district to ensure its sustainable development
- Astakhov A.S., Bushuev V.V., Golubev V.S. Ustoichivoe razvitie i natsional'noe bogatstvo Rossii . Moscow: IATs "Energiya", 2009. 156 p..
- Belogor'ev A.M., Afanas'eva M. Zachem nuzhen indeks ustoichivogo razvitiya? . Neft' Rossii , 2011, no. 11..
- Brown M.G. Za ramkami sbalansirovannoi sistemy pokazatelei. Kak analiticheskie pokazateli povyshayut effektivnost' upravleniya kompaniei . Moscow: ZAO "Olimp-Biznes", 2012. 248 p..
- Bushuev V.V., Gromov A.I., Belogor'ev A.M., Mastepanov A.M. Energetika Rossii: poststrategicheskii vzglyad na 50 let vpered . Moscow: IATs "Energiya", 2016. 96 p..
- Vasilenko V.A. Ustoichivoe razvitie regionov: podkhody i printsipy . Novosibirsk: IEOPP SO RAN, 2008. 208 p..
- Grigor'ev Yu.P. Model' obsluzhivaniya tsepei postavok material'nykh resursov . Uchenye zapiski Sankt-Peterburgskogo imeni V.B. Bobkova filiala Rossiiskoi tamozhennoi akademii , 2015, no. 2 (54), pp. 68-75..
- Grigor'ev Yu.P., Salina T.K. Podkhod k opredeleniyu stepeni ustoichivosti razvitiya TEK regiona (na primere SZFO) . Problemy ekonomiki i upravleniya neftegazovym kompleksom , 2016, no. 8, pp. 32-38..
- Grigor'ev Yu.P., Yakovleva K.V. Povyshenie obshchestvennoi poleznosti nefti na osnove sovershenstvovaniya instrumentov gosudarstvennogo vozdeistviya . Uchenye zapiski Sankt-Peterburgskogo imeni V.B. Bobkova filiala Rossiiskoi tamozhennoi akademii , 2014, no. 3 (51), pp. 56-69..
- Gromov A.I. Energeticheskaya osnova global'noi sistemy "priroda -obshchestvo -chelovek" . Partnerstvo tsivilizatsii , 2012, no. 3, pp. 72-79..
- Kalika V.I. Problemy issledovaniya i modelirovaniya razvitiya regional'nykh TEK . Ufa: BFAN SSSR, 1987. 41 p..
- Kaplan R., Norton D. Sbalansirovannaya sistema pokazatelei. Ot strategii k deistviyu . Moscow: ZAO "Olimp-Biznes", 2003. 264 p..
- Moiseenkova T.A. Ekologo-ekonomicheskaya sbalansirovannost' promyshlennykh uzlov . Saratov: Izd-vo Sarat. gos. un-ta, 1989. 216 p..
- Salina T.K. Kontseptual'nyi podkhod k upravleniyu ustoichivym razvitiem TEK Severo-Zapadnogo federal'nogo okruga . Zhurnal ekonomicheskoi teorii , 2016, no. 4, pp. 80-92..
- Salina T.K. Sbalansirovannaya sistema pokazatelei otsenki pervichnykh energoresursov TEK Rossii: sushchnost' i soderzhanie . Ekonomika i menedzhment sistem upravleniya , 2016, vol. 19, no. 1.2, pp. 254-161..
- Grigor'ev Yu.P. (Ed.). Teoretiko-metodologicheskie osnovy i prikladnoi ekonomicheskii instrumentarii optimizatsii v reshenii problemy vosproizvodstva nefti. Chast' 1. Podkhod k optimizatsii protsessov peremeshcheniya nefti v tsepi postavki: etapy razrabotki mestorozhdenii i pererabotki nefti . Saint Petersburg: SPb imeni V.B.Bobkova filial RTA, 2015. 360 p..
- Binder B. Strategieentwicklung und Balanced Scorecard /B. Binder, P. Sürth. Controller Magazin, 2002, no. 3, pp. 359-364.
- Gminder C.-U., Bieker Th., Hahn T. Nachhaltig managen mit der Balanced Scorecard. Erfahrungen aus einem Praxisprojekt, 2002, no. 6, pp. 27-28.
- Implementing the Balanced Scorecard at FMC Corporation: An Interview with Larry D. Brady. Harvard Business Review, 1993, September/October, pp. 143-147.
- Kaplan R.S., Norton D.P. Strategy Maps. Converting intangible assets into tangible outcomes. Boston, 2004. 144 p.
- Kaplan R.S., Norton D.P. Strategieumsetzung mit Hilfe der Balanced Scorecard. München, 1997. 342 p.
