The analysis of monetary movement of Russian Federation on the present stage of development and in the historical context
Автор: Vyborova E.N.
Журнал: Вестник Воронежского государственного университета инженерных технологий @vestnik-vsuet
Рубрика: Экономика и управление
Статья в выпуске: 3 (69), 2016 года.
Бесплатный доступ
In this article views the result of analysis of condition of monetary movement on the present stage of development and reveals the main results the tendencies and the regularity of development. In the article provides an overview of monetary movement in Russia in the view of the evolutionary phases, including the dynamics of the last millennium. Displayed the assessment of the money weight in the beginning of the century, during the war, at the stage of the economic imbalances in the planned economy. As the results of the analysis of the main indicators of the dynamics of the money weight during the period of formation and development of a market economy.
Monetary weight, monetary sphere, monetary base, denomination
Короткий адрес: https://sciup.org/140230004
IDR: 140230004 | DOI: 10.20914/2310-1202-2016-3-350-354
Текст научной статьи The analysis of monetary movement of Russian Federation on the present stage of development and in the historical context
DOI:
Introduction.
The monetary movement is permanent sphere of macroeconomic regulation. Trends in the development of monetary movement of any state always were ambiguous. It is possible to agree with the position of the Bank of Russia (CB RF) with the implementation of complex measures to maintain exchange rate flexibility, to provide and absorb liquidity, which involves of Central Bank of Russia Federation in the 2014 stand at the 4.5% [2, 3], and other actions that are defined in the medium term in this sphere. Precarious situation of Russia in comparison with other countries in this area complicates the implementation of the goals in the expected time frame. The difficulty lies in the fact that, compared with other countries, in Russia there is a high level of inflation, as evidenced by the consumer price index, which in the November 2013 compared to the December 2012 was as follows: Austria – 1.2% Germany – 0.7%, in Spain – 0.3%, France – 0.5%, in UK – 1.6%, Sweden – 0.1%, etc 1 . [13, 14, 17]. In this regard, it is important to determine the main trends of monetary movement and factors determining it and compile existing experience of regulating it.
The hypothesis of research.
Hypothesis 1. Excessive monetary movement in Russian Federation has not soft regulatory mechanism.
Hypothesis 2. The monetary movement is largely determined by the dynamics of internal liabilities of the country.
Method of research
-
1.1 The scale of research
Analyzed data on an array of monetary movement in the historical context in the 1900–1913 and from the 1917–1998 Detailed analysis of indicators implemented from the 01.01.1992–01.01.2014
-
1.2 Method of research.
In the last years has been studied using the index method, the methods of multivariate statistics and application of the software package Statgraphics Plus.
Results
Russia has a rich history of development. This is defined patterns of evolution. Briefly stopping on a review of monetary movement in Russia in the last millennium, it may be noted that the dynamics of monetary movement had an interesting trend. In particular, in the 1900–1913 [5] observed a significant increase in the money supply by 78.95%, accounting for the 1,673.8 million rubles (table 1, figure 1).
Table 1
The dynamics of monetary movement in Russian Federation in the 1900–1913, million RUR
|
№ |
Indicators |
1900 |
1913 |
Changes |
|
|
absolute |
relative |
||||
|
A |
B |
1 |
2 |
3 = 2 – 1 |
4 = (2/1)⋅100% |
|
1. |
Gold cash |
843 |
1550 |
707 |
183,87% |
|
2. |
Credit notes |
491 |
1493,8 |
1002,8 |
3,04 |
|
3. |
Gold Coins |
641 |
629,3 |
-11,7 |
98,17% |
|
4. |
Silver |
145 |
120,7 |
-24,3 |
83,24% |
|
5. |
In total |
2120 |
3793,8 |
1673,8 |
178,95% |
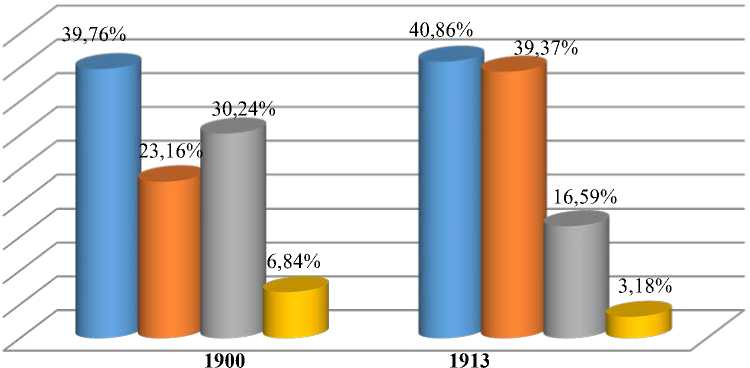
Figure 1. The structure of monetary movement in Russia in the 1900–1913: Row 1 (blue) – gold cash, Row 2 (red) – credit notes, Row 3 (green) – gold coins, Row 4 (violet) – silver coins.
As the data in a retrospective analysis, the favorable factors of Russia’s economy does not significantly inhibit the growth of the monetary movement, which confirms the budget surplus, which in the 1910 was 208.4 million rubles at the rate in the 1913 – 48.3 million rubles 2 . The exchange rate in Russia in the 1913, the same is favorable and is 1.94 to the U.S. dollar, 0.37 – Japanese yen, 0.37 – Swiss franc, 0.47 – a shilling, 0.46 – mark Germany. The structure of Russia's 3 national wealth is estimated A.L. Weinstein was on the 01.01.1914 (based on analysis of data in the 1911–1913) and estimated P. Gregory and A. Kagan in the 1908–1913 on the basic elements tended to increase [5, p. 32]. Evaluating the structure of monetary movement during this period, it is clear that the largest share on the cash gold – 40.86%, credit notes – 39.37%.
The monetary movement in the future, is determined largely by historical events, as shown by analysis of the data [4,6]. Significant emission is observed in Russia in the 1917, which is caused by the change of government. Excessive monetary movement was adjusted denomination in the 1924.
Then, a significant amount of emission was observed during the Great Patriotic War – more than the 60 billion rubles. Hence, the denomination was held in the 1948.
Disparities planned economy, in our opinion, caused an increase in the monetary movement in the 55–60y last century. In particular, in the 1956 it was more than the 50 billion rubles. Natural measure of macroeconomic regulation by Central Bank of Russia in the last century made the traditional denomination in the 1961.
In view of this fact, that the macroeconomic mechanism of regulation of the economy was not found, then it indicates the rapid growth of the monetary movement in Russia up to the 1990. In the 1973, there was more monetary movement the 30 billion rubles, 1983 (> 60 billion rubles), 1990 (> 135 billion rubles), 1997 (> 300 billion rubles). And still, a measure of macroeconomic regulation is the denomination in the 1998
Having stayed in more detail at the present stage of development, evaluation of the monetary movement in Russian Federation carried out from the 1992 4 to present. Analyzing the dynamics of monetary movement using chain indices 5 , it may be noted, at first glance, a slight increase in this index (figure 2).
However, since the 2000, the monetary movement increased by the 40.8 times on the 01.01.2014, amounts to the 29,167.3 billion rubles 6 .
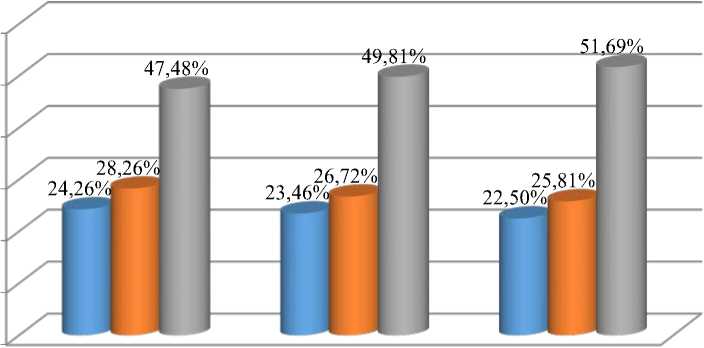
The changes of the past three years does not differ by sharp fluctuations and has a positive dynamics in the structure (table 2, figure 3).
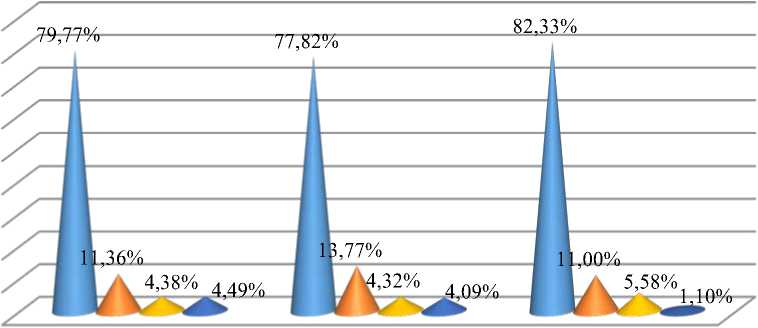
Another important indicator of monetary movement is the monetary base in broad definition, which also confirms the positive trend in the monetary policy implemented by Central Bank of Russian Federation at the present stage (table 3, figure 4) [1,15].
-
5 Annual indices were calculated as the geometric mean of the monthly indices.
-
6 Please note, that the analysis is based on data of the Bank of Russia. This is taken into account in the national monetary movement definition. It should be noted that too much information can have an impact on the accuracy of the calculations, since the money supply, CB RF calculated in compliance with the Special Data International Monetary Fund's Dissemination Standard (SDDS) was already on the 01.11.2013 was the 35,098 billion rubles.
Returning to the evaluation of trends in the monetary movement from the 01.01.1992– 01.01.2014, it should be noted that in general, its dynamics is described by a second degree polynomial and has the form (figure 5):
Y 7 = 2337,62 – 97,41⋅t + 0,74⋅t2
As noted earlier, the state and dynamics of this indicator is influenced by many factors. We have attempted to assess the impact on the domestic internal requirements 8 on the monetary movement of
Russian Federation. Their assessment was based on existing database the 01.07.1995 till the 01.11.2013
The monetary movement is determined by the dynamics of internal requirements for the 96.39%, as evidenced by the correlation coefficient, the study of internal of Russian Federation requirements leads to the conclusion that they are described by the function:
Y= exp(6,02 + 0,02⋅t)
In this set of the data of monetary movement was used for the same period of time 9 .
1,0131
1,0094
■ 1,0169
н 1,0228
1,0136 1 ,0007
0,9 0,95
1,0305 1,0336
1,027
1,0259 1,0346
1,0236
1,028 1,
4 0404
1,0386
1,0162
1,0219
1,0225
1,0702
1,0942
1,1456
1,179 1
1 1,05 1,1 1,15 1,2
Figure 2. Dynamics of chain indices of monetary movement in Russian Federation for the 1992–2013
60,00%
50,00%
40,00%
30,00%
20,00%
10,00%
0,00%
2012 2013 2014
Figure 3. Dynamics of money supply in the national determination of Russian Federation 01.01.2012–01.01.2014: Row 1 (blue) – cash, Row 2 (red) – transferable deposits, Row 3 (green) – other deposts.
-
8 The internal requirements include requirements for public authorities, public enterprises, public, private companies, financial institutions.
-
9 If the correct boundaries of the analyzed period, the dynamics of the monetary movement is described by the form: Y=1524,8 -75,63⋅t + 0,9⋅t2.
Table 2
The dynamics of monetary movement in the national definition of Russian Federation in the 2012–2013, billion RUR
|
no |
Indicators |
01.01.2012 |
01.01.2013 |
01.01.2014 |
Changes |
|||
|
absolute |
relative |
|||||||
|
А |
B |
1 |
2 |
3 |
4=3–2 |
5=3–1 |
6=(3/2)⋅100% |
7=(3/1)⋅100% |
|
1. |
Cash 10 (М0) |
5 938,6 |
6 430,1 |
6 564,1 |
134 |
625,5 |
102,08% |
110,53% |
|
2. |
Transferable deposits 11 |
6 918,9 |
7 323,5 |
7 527,9 |
204,4 |
609 |
102,79% |
108,80% |
|
3. |
Monetary aggregate М1 (1+2) |
12 857,4 |
13 753,6 |
14 092 |
338,4 |
1 234,6 |
102,46% |
109,60% |
|
4. |
Other deposits 12 |
11 625,7 |
13 651,8 |
15 075,3 |
1 423,5 |
3 449,6 |
110,43% |
129,67% |
|
5. |
Monetary movement in the national definition Monetary aggregate М2 (3+4) |
24 483,1 |
27 405,4 |
29 167,3 |
1761,9 |
4684,2 |
106,43% |
119,13% |
2012 2013 2014
Figure 4. Dynamics of the monetary base in broad definition of Russian Federation in 01.01.2012–01.01.2014: Row 1 (dark blue) – cash, Row 2 (red) – funds on correspondent accounts with the CBR, Row 3 (magenta) – required reserves, Row 4 (blue) – deposits of credit institutions CB RF.
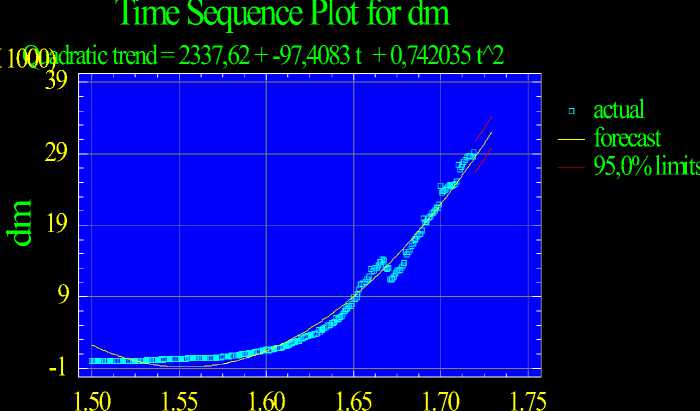
Figure 5. The monetary movement of Russian Federation in the 01.01.2012–01.01.2014
Conclusions
The forecasted volume of monetary movement in 2014, according to our estimates, ranging from 28,633.8 billion RUR to 42,339.45 billion RUR. High rate of growth indicator, taking into account the dynamics of the problem and the proportions of the main macroeconomic indicators may negatively affect the condition of the monetary spheres and the operation of credit.
Список литературы The analysis of monetary movement of Russian Federation on the present stage of development and in the historical context
- The Annual report of Bank of the Russian Federation for 2021. Moscow, Central Bank of the Russian Federation, 2013. 293 p.
- Guidelines for the single state monetary policy for the 2013 and for the 2014-2015 period. Moscow, Central Bank of the Russian Federation, 2013. 34 p.
- Report on monetary policy. no. 4 October. Moscow, Central Bank of the Russian Federation, 2013. 42 p.
- On pages of archival funds of the Central Bank of Bank of the Russian Federation. Rel. no. 2-8. Moscow, Central Bank of Bank of the Russian Federation, 2007.
- Russia 1913 Statistic documentary directory. Мoscow, 1996. 620 p.
- Vyborova E.N. The basic tendencies of development of the monetary movement in Russian Federation. Finance and credit. 2010. no. 33. pp.37.
- Vyborova E.N. Estimation of the mechanism of regulation the international reserves of the Russian Federation at the development present stage. Money and credit. 2011. no. 10. pp.74.
- Ions V.M. The monetary movement in the modern world. Money and credit. 2013. no. 7. pp.74.
- Krasavina LN Actual problems of inflation and its regulation in Russia: a systematic approach. Money and credit. 2013. no. 3. pp.19.
- Luntovsky G.I. The monetary movement: the current stage and prospects of development. Money and credit. 2013. no. 2. pp. 3.
- Jurov A.V. The monetary movement during periods of recession and recovery of economics. Money and credit. 2011. no. 1. pp. 37.
- Jurov A.V. The state of monetary movement in the Russian Federation. The implementation of decisions of prospects. Money and credit. 2012. no. 6. pp.74.
- Federal state statistics service. Available at: http://www.gks
- Database Eurostat. Available at: http://www.epp.eurostat.ec.europa.eu
- Central Bank of Russia. Available at: http://www.cbr.
- World Bank Group. Available at: http://www.worldbank.org
- IMF -International Monetary Fund Home Page. Available at: http://www.imf.org

