The Application of Phasor Measurement Units in Transmission Line Outage Detection Using Support Vector Machine

Author: A. Y. Abdelaziz, S. F. Mekhamer, M. Ezzat
Journal: International Journal of Intelligent Systems and Applications(IJISA) @ijisa
Article in issue: 8 vol.5, 2013.
Free access
Many protection applications are based upon the Phasor Measurement Units (PMUs) technology. Therefore, PMUs have been increasingly widespread throughout the power network, and there are several researches have been made to locate the PMUs for complete system observability. This paper introduces an important application of PMUs in power system protection which is the detection of single line outage. In addition, a detection of the out of service line is achieved depending on the variations of phase angles measured at the system buses where the PMUs are located. Hence, a protection scheme from unexpected overloading in the network that may lead to system collapse can be achieved. Such detections are based upon an artificial intelligence technique which is the support Vector Machine (SVM) classification tool. To demonstrate the effectiveness of the proposed approach, the algorithm is tested using offline simulation for both the 14-bus IEEE and the 30-bus IEEE systems. Two different kernels of the SVM are tested to select the more appropriate one (i.e. polynomial and Radial Basis Function (RBF) kernels are used).
Phasor Measurement Units, Support Vector Machine, Radial Basis Function Kernel
Short address: https://sciup.org/15010449
IDR: 15010449
Text of the scientific article The Application of Phasor Measurement Units in Transmission Line Outage Detection Using Support Vector Machine
Published Online July 2013 in MECS
The study of line outage is important to provide a measure of the overall effect on the system due to that line outage. The power flow of the system is affected by the line outage, and overloading for certain lines may occur in order to supply the loads located at the load buses. Therefore, the line outage causes changes in power angles for several buses. A protective action should be made to prevent large system disturbances (over loading of lines) leading to cascaded tripping results in a system collapse [1, 2].
In recent years, Phasor Measurement Units (PMUs) gained a great importance and became capable of providing geographically dispersed accurate synchronized measurements over the entire power grid [3]. Therefore, they are used for power system studies and became a powerful technology in power system protection [4 - 8].
Mikolinnas and Wollenberg [9] have presented a version of the Megawatt Performance Indices (PI) whish are function of bus voltages and line flows and the corresponding limits. They include all terms in the infinite Taylor’s series expansion for all the change in the performance index due to different outage. Irissari and Sasson [10] have proposed an improved computational procedure based on DC load flow method in order to detect the line outage. Vemuri and Usher [11] have presented a unified approach to find sensitivity of performance index for single branch outage, generation/load outage and combination of them. D. Hazarika et al. [12] describe an algorithm for determining the line outage contingency of a line taking into account of line over load effect in remaining lines and subsequent tripping of over loaded line(s) leading to system split or islanding of a power system using fast decoupled load flow analysis. J. Tate and T. Overbye [13, 14] introduce two researches for single and double line outage respectively using phasor angle measurements. This is done by utilizing an optimization technique for event detection.
This paper focuses on the line outage problem and proposes an artificial intelligence based technique for outage detection. The line which suffers an outage is determined by means of a Support Vector Machine (SVM) classification tool using either of polynomial kernel or Radial Basis Function (RBF) kernel. The task of SVM is to utilize the output information from the PMUs to determine a status for each line if it is out of service or not. The PMUs calculate the phasor angles at the certain buses based on the complete observability approach discussed in [15]. Section II of this paper gives some details about SVM as a classification tool. Section III proposes an approach to detect the outage of a line based on the variations of the phasor angles at different buses with the aid of the SVM tool. Section IV introduces a numerical simulation for the IEEE 14-bus system using an offline simulation program EMTDC/PSCAD and the mathematical analysis with the aid of MATLAB. Sections V and VI present the results of line outage detection in the IEEE 14-bus system for both polynomial and RBF kernels respectively. Section VII applies the same proposed approach on the IEEE 30-bus system to show the validity of such approach in larger systems. Section VIII clarifies the extracted conclusions.
1||w||2+ C ∑ fi
|| || 2
1=1
Subjected to
Vt ( Xi .w+ b ) ≥1- fi , fi ≥0, for i =1,2,…, n (7)
-
II. Support Vector Machine
Support vector machine [16, 17] was originally introduced by Vapnik and co-workers in the late 1990s. SVM mainly has two classes of applications, classification and regression. In this paper, only the application of classification is considered.
There are many possible linear classifiers that can separate the data, but there is only one that maximizes the margin between the data point of each class). This linear classifier is termed the optimal separating hyperplane. Fig. 1 shows the maximum margin hyper-plane and margins for SVM trained with samples from two classes.
Given a set of training data
{ Xi , Vi }, i =1,2,…, n , Vi ∈ {-1,1}, Xi ∈ R" (1)
Each xi is a d-dimensional real vector Rd. The points x which lie on the hyper-plane satisfy:
w. X + b =0 (2)
Where w is normal to the hyper-plane, |b|/||w|| is the perpendicular distance from the hyper-plane to the origin, and ||w|| is the Euclidean norm of w . For the linearly separable case, the support vector algorithm simply looks for the separating hyper-plane with largest margin. This can be formulated as follows (suppose that all the training data satisfy the following constraints):
Xi .w+b ≥ +1 for yt=+1(3)
xt .w+b ≤ -1 for yt=-1(4)
These can be combined into one set of inequalities:
yt (Xi .w+b)-1 ≥0(5)
Training points for which the equality in (5) holds are called support vectors. The pair of hyper-planes which gives the maximum margin by minimizing ||w|| , subject to constraints can be found. The optimization problem presented is difficult to solve because it depends on ||w|| which involves a square root. Fortunately it is possible to alter the equation by substituting ||w|| with 0.5||w||2 without changing the solution. Taking into account the noise with slack variable ξ and error penalty C , the optimal hyper-plane can be found by solving the following convex quadratic programming (QP) problem:
Minimize where ξi is measuring the degree of misclassification, the constant C > 0 determines the trade-off between margin maximization and training error minimization.
In SVM, the optimal hyper-plane is determined to maximize the generalization ability. But if the training data are not linearly separable, the obtained classifier may not have high generalization ability. Thus to enhance linear separation, the original input space is mapped into a high-dimensional dot product space called the feature space.
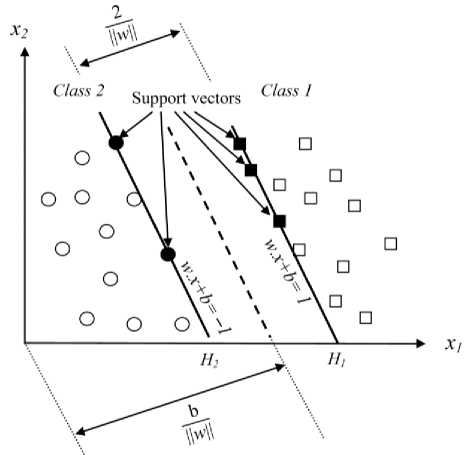
Fig. 1: Maximum margin hyper-plane and margins for a SVM trained with samples from two classes
A construction of the linear separating hyper-plane is done in this high dimensional feature space, after a nonlinear mapping of the input data to feature space as shown in Fig. 2. An inner product in feature space has an equivalent kernel in input space as in (8).
к ( X , x' )= 〈∅ ( X ), ∅ ( x' ) 〉 (8)
This allows the algorithm to fit the maximum-margin hyper-plane in the transformed feature space [18]. In this work, the polynomial kernel function is used as in (9) with the degree n:
к ( X , x' )=( 〈 X , x’ 〉 + 1)
Radial basis functions have received significant attention, most commonly with a Gaussian of the form.
к ( X , X ′)= exp (- || x;; || )
-
III. The Proposed Approach
The line outage in a transmission network causes a re-distribution of the lines power flow. Hence, variations in the voltages phase angles are achieved. The most affected buses are the buses near the outaged lines. Therefore, large scale measurements all over the network should be taken into consideration. The PMUs are located at certain buses for complete observability [15]. Then, a mathematical model is applied to calculate the phasors angles.
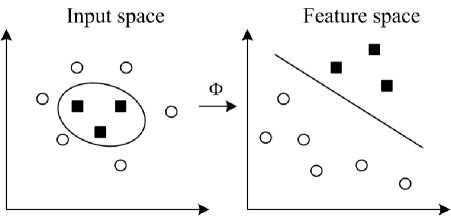
Fig. 2: Mapping the training data into a higher-dimensional feature space
The proposed approach uses the Rockefeller and Udren algorithm [19] that depends on successive three samples to calculate the phasor voltage magnitude and angle.
A training of the SVM is made using all the possible cases of the line outage scenarios at several different loading cases. For the proposed first study case of 14-bus IEEE system, there are 20 lines connecting the buses. So, the number of training vectors is 20 single line outage cases multiplied by 6 different loading cases at different buses, (i.e. 120 training vectors). Each vector contains the results of phase angles for each line outage case. Theses vectors are the x vectors of the SVM. These vectors form a matrix X . For the second study case of 30-bus IEEE system, same analysis is made but with larger number of lines (i.e. 41 lines).
The y vector of the SVM for a certain line is a vector that has the values of 1 and -1. The value of 1 represents a case in which the test data matches the training data. While the value of -1 represents a non-matching data (e.g. if the rows number i , j and k in the X matrix represent an outage case of a certain line. Hence, when studying the outage of that line, the ith , jth , and kth elements in the y vector should equal to 1 and other elements in the y vector should equal to -1)
In the testing of the studied system, an SVM classification function is applied for each line and the predicted values of the SVM functions are collected. Hence, the out of service line is extracted through the results of the testing of SVM. To show the effect of the error penalty C , the testing is repeated at different values of C , to get the accuracy of the results as a function of C .
Fig. 3 introduces a flow chart describing the proposed approach applied to either the 14-bus IEEE system or the 30-bus IEEE system as a simple model used to apply the proposed approach.
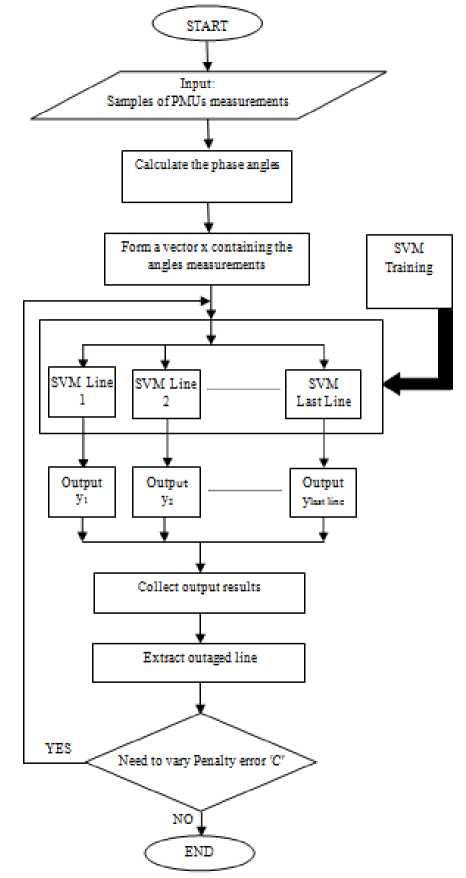
Fig. 3: Flowchart describing the proposed approach
-
IV. Simulation Results of The 14 Bus IEEE System
In order to test the proposed algorithm, an offline simulation is performed using EMTDC/PSCAD simulation package [20]. The 14-bus IEEE system is shown in Fig. 4, and the PMUs are located upon the complete observability approach in [15] at the buses 2, 7, 10 and 13.
Therefore, the voltage samples are taken at the buses where the PMUs are located. Then, the angles of voltage phasors are calculated.
The training of SVM requires many study cases of outage for each line to record the angles variations in all cases. The proposed approach suggests making such training at different loading cases at different buses. The following cases are considered in the SVM training using either the polynomial kernel or the RBF kernel.
-
• Normal loading case as the standard IEEE system.
-
• An increase of 25% in loading at bus4.
-
• An increase of 25% in loading at bus6.
-
• An increase of 25% in loading at bus9.
-
• An increase of 25% in loading at bus10.
-
• An increase of 25% in loading at bus12.
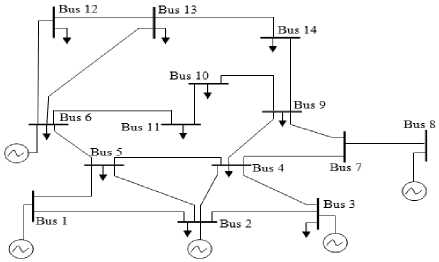
Fig. 4: IEEE 14 bus system
Each of the six loading cases has an internal 20 cases of line outage for the 20 lines in the system. Therefore, 120 vectors are available to perform the required training of SVM.
The training vector consists of a number of parts arranged together. Each part clarifies the angle variations at the buses where the PMUs are located. The next step is to apply a different loading case to test the SVM including all possible line outages. Then, the results are tabulated and the accuracy is calculated. It is proposed to perform such testing at conditions that differ from the training conditions.
In order to ensure the superiority of the SVM classification tool in the field of line outage detection, several study cases have been studied including the complete observability principle. The study cases are given as follow:
-
• Study case (1): An increase of 25% in loading at bus 14.
-
• Study case (2): An increase of 25% in loading at bus 3.
-
• Study case (3): An increase of 40% in loading at bus 9.
The targets of studying more study cases are; (1) to get an approximated accuracy of the proposed approach, (2) to select the appropriate range of penalty error for each line outage detection case, and (3) to determine which kernel from the two proposed kernels is more powerful.
-
V. Simulation Results of The 14 Bus IEEE System
Firstly, the polynomial kernel is considered, and the results of the three study cases are given in Tables 1, 2, and 3 respectively. The results are compared, and the comparison is introduced in Fig. 5.
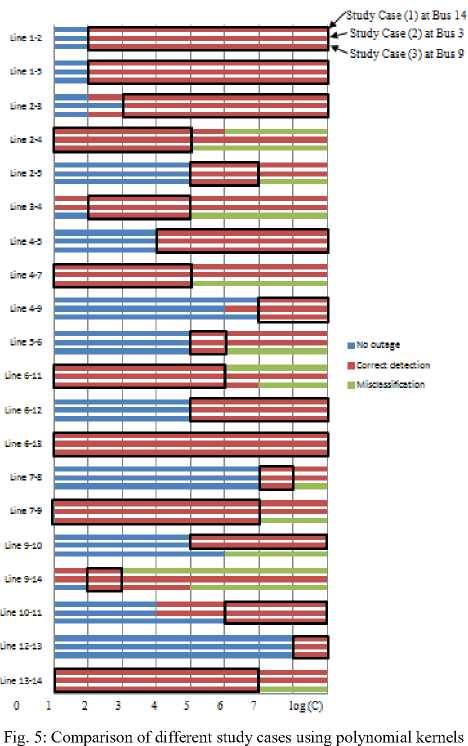
It is clear from Fig. 5 that for each line, there is a detectable range of penalty error " C " for the line outage. Some lines are classified clearly even the value of C is small which means narrow range of classification or large which means wide margin of classification (e.g. line connecting bus 6 and bus 13), where the result is correct for all tested range of C . While other line needs a specified range of C (e.g. line connecting bus 6 and bus 12), it requires a greater value of C starting from 1 x 10⁴. On the opposite, some lines need small values of C (e.g. line connecting bus 9 to bus 14), it requires lower value of C up to 10, after that a miss-classification may occur and the result becomes confusing.
For the study case (3), the bus number 9 is 40% overloaded than the standard system that differs from both study cases (1) and (2). The difference between the study cases is that in case (3), the SVM fails in the detection of line 9-10 and makes a miss classification as shown in Table 3 by bolded font and grey shadow. It detects line 10-11 instead of 9-10 at C = 1 x 10⁴. Even a miss classification occurs; the accuracy of the approach still has 19 correct detections versus one wrong detection which means a percentage of 95 % of accuracy.
The conclusion is that the overall accuracy increases as the value of C increases to have much classification margin. But, for some cases the increase in C allows an appearance of miss-classifications. Therefore, to have correct decision for any case of line outage, it is important to make a parallel processing for all lines with parallel subroutines. Each subroutine operates with the suitable or optimum penalty error "C" that to be adjusted through different study cases in order to get correct decisions. Consequently, the obtained accuracy of the SVM classification tool for these study cases reaches 59 cases over 60 cases with a percentage of 98.3%.
Table 1: Results of study case (1) using polynomial kernel
|
Study Case (1): An increase of 25% at bus 14 using polynomial kernel |
||||||||
|
Outage Case |
Result at C = 1 |
Result at C = 10 |
Result at C = 100 |
Result at C = 1000 |
Result at C = 1x10⁴ |
Result at C = 1x10⁵ |
Result at C = 1x10⁶ |
Result at C = 1x10⁷ |
|
Line 1-2 |
No outage |
1-2 |
1-2 |
1-2 |
1-2 |
1-2 |
1-2 |
1-2 |
|
Line 1-5 |
No outage |
1-5 |
1-5 |
1-5 |
1-5 |
1-5 |
1-5 |
1-5 |
|
Line 2-3 |
No outage |
2-3 |
2-3 |
2-3 |
2-3 |
2-3 |
2-3 |
2-3 |
|
Line 2-4 |
2-4 |
2-4 |
2-4 |
2-4 |
2-4 |
2-4, 10-11 |
2-4, 10-11 |
2-4, 10-11 |
|
Line 2-5 |
No outage |
No outage |
No outage |
No outage |
2-5 |
2-5 |
2-5 |
2-5 |
|
Line 3-4 |
3-4 |
3-4 |
3-4 |
3-4 |
3-4 |
3-4 |
3-4 |
3-4 |
|
Line 4-5 |
No outage |
No outage |
No outage |
4-5 |
4-5 |
4-5 |
4-5 |
4-5 |
|
Line 4-7 |
4-7 |
4-7 |
4-7 |
4-7 |
4-7 |
4-7 |
4-7 |
4-7 |
|
Line 4-9 |
No outage |
No outage |
No outage |
No outage |
No outage |
No outage |
4-9 |
4-9 |
|
Line 5-6 |
No outage |
No outage |
No outage |
No outage |
5-6 |
5-6 |
5-6 |
5-6 |
|
Line 6-11 |
6-11 |
6-11 |
6-11 |
6-11 |
6-11 |
6-11, 10-11 |
6-11, 10-11 |
6-11, 10-11 |
|
Line 6-12 |
No outage |
No outage |
No outage |
No outage |
6-12 |
6-12 |
6-12 |
6-12 |
|
Line 6-13 |
6-13 |
6-13 |
6-13 |
6-13 |
6-13 |
6-13 |
6-13 |
6-13 |
|
Line 7-8 |
No outage |
No outage |
No outage |
No outage |
No outage |
No outage |
7-8 |
7-8 |
|
Line 7-9 |
7-9 |
7-9 |
7-9 |
7-9 |
7-9 |
7-9 |
7-9 |
7-9 |
|
Line 9-10 |
No outage |
No outage |
No outage |
No outage |
9-10 |
9-10 |
9-10 |
9-10 |
|
Line 9-14 |
9-14 |
9-14 |
9-14, 3-4 |
9-14, 3-4 |
9-14, 3-4 |
9-14, 3-4 |
9-14, 3-4 |
9-14, 3-4 |
|
Line 10-11 |
No outage |
No outage |
No outage |
10-11 |
10-11 |
10-11 |
10-11 |
10-11 |
|
Line 12-13 |
No outage |
No outage |
No outage |
No outage |
No outage |
No outage |
No outage |
12-13 |
|
Line 13-14 |
13-14 |
13-14 |
13-14 |
13-14 |
13-14 |
13-14 |
13-14 |
13-14 |
Table 2: Results of study case (2) using polynomial kernel
|
Study Case (2): An increase of 25% at bus 3 using polynomial kernel |
||||||||
|
Outage Case |
Result at C = 1 |
Result at C = 10 |
Result at C = 100 |
Result at C = 1000 |
Result at C = 1x10⁴ |
Result at C = 1x10⁵ |
Result at C = 1x10⁶ |
Result at C = 1x10⁷ |
|
Line 1-2 |
No outage |
1-2 |
1-2 |
1-2 |
1-2 |
1-2 |
1-2 |
1-2 |
|
Line 1-5 |
No outage |
1-5 |
1-5 |
1-5 |
1-5 |
1-5 |
1-5 |
1-5 |
|
Line 2-3 |
No outage |
No outage |
2-3 |
2-3 |
2-3 |
2-3 |
2-3 |
2-3 |
|
Line 2-4 |
2-4 |
2-4 |
2-4 |
2-4 |
2-4 |
2-4 |
2-4 |
2-4 |
|
Line 2-5 |
No outage |
No outage |
No outage |
No outage |
2-5 |
2-5 |
2-5 |
2-5 |
|
Line 3-4 |
3-4 |
3-4 |
3-4 |
3-4 |
3-4 |
3-4 |
3-4 |
3-4 |
|
Line 4-5 |
No outage |
No outage |
No outage |
4-5 |
4-5 |
4-5 |
4-5 |
4-5 |
|
Line 4-7 |
4-7 |
4-7 |
4-7 |
4-7 |
4-7 |
4-7 |
4-7 |
4-7 |
|
Line 4-9 |
No outage |
No outage |
No outage |
No outage |
No outage |
4-9 |
4-9 |
4-9 |
|
Line 5-6 |
No outage |
No outage |
No outage |
No outage |
5-6 |
5-6 |
5-6 |
5-6 |
|
Line 6-11 |
6-11 |
6-11 |
6-11 |
6-11 |
6-11 |
6-11 |
6-11 |
6-11 |
|
Line 6-12 |
No outage |
No outage |
No outage |
No outage |
6-12 |
6-12 |
6-12 |
6-12 |
|
Line 6-13 |
6-13 |
6-13 |
6-13 |
6-13 |
6-13 |
6-13 |
6-13 |
6-13 |
|
Line 7-8 |
No outage |
No outage |
No outage |
No outage |
No outage |
No outage |
7-8 |
7-8 |
|
Line 7-9 |
7-9 |
7-9 |
7-9 |
7-9 |
7-9 |
7-9 |
7-9 |
7-9 |
|
Line 9-10 |
No outage |
No outage |
No outage |
No outage |
9-10 |
9-10 |
9-10 |
9-10 |
|
Line 9-14 |
9-14 |
9-14 |
9-14 |
9-14 |
9-14 |
9-14 |
9-14 |
9-14 |
|
Line 10-11 |
No outage |
No outage |
No outage |
10-11 |
10-11 |
10-11 |
10-11 |
10-11 |
|
Line 12-13 |
No outage |
No outage |
No outage |
No outage |
No outage |
No outage |
No outage |
12-13 |
|
Line 13-14 |
13-14 |
13-14 |
13-14 |
13-14 |
13-14 |
13-14 |
13-14 |
13-14 |
Table 3: Results of study case (3) using polynomial kernel
|
Study Case (3): An increase of 40% at bus 9 using polynomial kernel |
||||||||
|
Outage Case |
Result at C = 1 |
Result at C = 10 |
Result at C = 100 |
Result at C = 1000 |
Result at C = 1x10⁴ |
Result at C = 1x10⁵ |
Result at C = 1x10⁶ |
Result at C = 1x10⁷ |
|
Line 1-2 |
No outage |
1-2 |
1-2 |
1-2 |
1-2, 10-11 |
1-2, 10-11 |
1-2, 10-11 |
1-2, 10-11 |
|
Line 1-5 |
No outage |
1-5 |
1-5 |
1-5 |
1-5, 2-5 |
1-5, 2-5 |
1-5, 2-5 |
1-5, 2-5 |
|
Line 2-3 |
No outage |
2-3 |
2-3 |
2-3 |
2-3 |
2-3 |
2-3 |
2-3 |
|
Line 2-4 |
2-4 |
2-4 |
2-4 |
2-4 |
2-4, 2-5 |
2-4, 2-5, 7-8 |
2-4, 2-5, 7-8 |
2-4, 2-5, 7-8, |
|
Line 2-5 |
No outage |
No outage |
No outage |
No outage |
2-5 |
2-5 |
2-5, 7-8 |
2-5, 7-8 |
|
Line 3-4 |
No outage |
3-4 |
3-4 |
3-4 |
3-4, 10-11 |
3-4, 10-11 |
3-4, 10-11 |
3-4, 10-11 |
|
Line 4-5 |
No outage |
No outage |
No outage |
4-5 |
4-5 |
4-5 |
4-5 |
4-5 |
|
Line 4-7 |
4-7 |
4-7 |
4-7 |
4-7 |
4-7, 10-11 |
4-7, 10-11 |
4-7, 10-11 |
4-7, 10-11 |
|
Line 4-9 |
No outage |
No outage |
No outage |
No outage |
No outage |
No outage |
4-9 |
4-9 |
|
Line 5-6 |
No outage |
No outage |
No outage |
No outage |
5-6 |
5-6, 10-11 |
5-6,10-11 |
5-6,10-11 |
|
Line 6-11 |
6-11 |
6-11 |
6-11 |
6-11 |
6-11 |
6-11 |
6-11, 4-9 |
6-11, 4-9 |
|
Line 6-12 |
No outage |
No outage |
No outage |
No outage |
6-12 |
6-12 |
6-12 |
6-12 |
|
Line 6-13 |
6-13 |
6-13 |
6-13 |
6-13 |
6-13 |
6-13 |
6-13 |
6-13 |
|
Line 7-8 |
No outage |
No outage |
No outage |
No outage |
No outage |
No outage |
7-8 |
7-8, 10-11 |
|
Line 7-9 |
7-9 |
7-9 |
7-9 |
7-9 |
7-9 |
7-9 |
7-9, 4-9 |
7-9, 4-9 |
|
Line 9-10 |
No outage |
No outage |
No outage |
No outage |
No outage |
10-11 |
10-11, 7-8 |
10-11, 7-8 |
|
Line 9-14 |
No outage |
9-14 |
9-14 |
9-14 |
9-14, 10-11 |
9-14, 10-11 |
9-14, 10-11 |
9-14, 10-11 |
|
Line 10-11 |
No outage |
No outage |
No outage |
No outage |
No outage |
10-11 |
10-11 |
10-11 |
|
Line 12-13 |
No outage |
No outage |
No outage |
No outage |
No outage |
No outage |
No outage |
12-13 |
|
Line 13-14 |
13-14 |
13-14 |
13-14 |
13-14 |
13-14 |
13-14 |
13-14, 9-10 |
13-14, 9-10 |
-
VI. Simulation Results of The 14 Bus IEEE System Using RBF Kernel
The (RBF) kernel is introduced in section II. It is applied to the proposed line outage problem and the results are obtained for the selected three study cases that are mentioned before. Table 4, Table 5 and Table 6 introduce the detailed results of line outage cases for an increase in the loading by 25% at bus 14, 25% at bus 3 and 40% increase at bus 9 respectively. The results are combined in a bar chart representation and introduced in Fig. 6.
The results of using RBF kernel are much better than that using polynomial kernel. All line outage cases are classified clearly for a large range of penalty error even the cases in which the phase angles have very small changes during the occurrence of line outage.
According to all simulation, tables of results and figures, the RBF kernel is more efficient than the polynomial kernel, as the RBF kernel have succeeded in all line outage cases for all study cases. To show the superiority of the RBF kernel compared to the polynomial kernel in the classification of line outage, a comparison of the final results for both kernels is introduced in Table 7. It is clear from the table that the RBF kernel has a more detectable range of penalty error in 15 line outage cases against 4 cases in which the polynomial kernel advances.
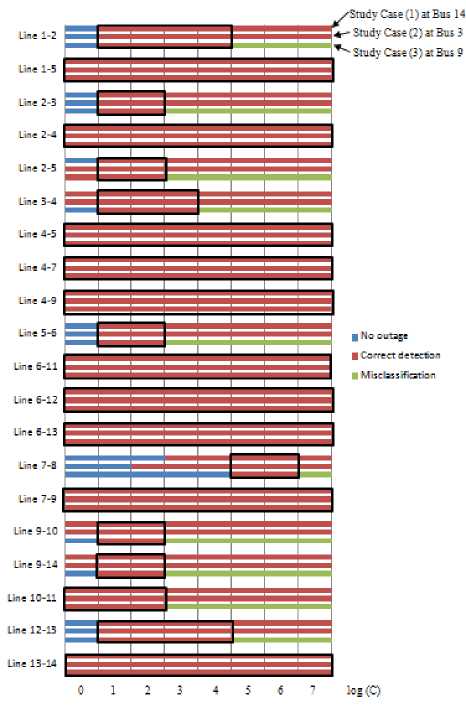
Fig. 6: Comparison of different study cases using RBF kernel
Table 4: Results of study case (1) using RBF kernel
|
Study Case (1): An increase of 25% at bus 14 using RBF kernel |
||||||||
|
Outage Case |
Result at C = 1 |
Result at C = 10 |
Result at C = 100 |
Result at C = 1000 |
Result at C = 1x10⁴ |
Result at C = 1x10⁵ |
Result at C = 1x10⁶ |
Result at C = 1x10⁷ |
|
Line 1-2 |
No outage |
1-2 |
1-2 |
1-2 |
1-2 |
1-2 |
1-2 |
1-2 |
|
Line 1-5 |
1-5 |
1-5 |
1-5 |
1-5 |
1-5 |
1-5 |
1-5 |
1-5 |
|
Line 2-3 |
No outage |
2-3 |
2-3 |
2-3 |
2-3 |
2-3 |
2-3 |
2-3 |
|
Line 2-4 |
2-4 |
2-4 |
2-4 |
2-4 |
2-4 |
2-4 |
2-4 |
2-4 |
|
Line 2-5 |
No outage |
2-5 |
2-5 |
2-5 |
2-5 |
2-5 |
2-5 |
2-5 |
|
Line 3-4 |
3-4 |
3-4 |
3-4 |
3-4 |
3-4 |
3-4 |
3-4 |
3-4 |
|
Line 4-5 |
4-5 |
4-5 |
4-5 |
4-5 |
4-5 |
4-5 |
4-5 |
4-5 |
|
Line 4-7 |
4-7 |
4-7 |
4-7 |
4-7 |
4-7 |
4-7 |
4-7 |
4-7 |
|
Line 4-9 |
4-9 |
4-9 |
4-9 |
4-9 |
4-9 |
4-9 |
4-9 |
4-9 |
|
Line 5-6 |
No outage |
5-6 |
5-6 |
5-6 |
5-6 |
5-6 |
5-6 |
5-6 |
|
Line 6-11 |
6-11 |
6-11 |
6-11 |
6-11 |
6-11 |
6-11 |
6-11 |
6-11 |
|
Line 6-12 |
6-12 |
6-12 |
6-12 |
6-12 |
6-12 |
6-12 |
6-12 |
6-12 |
|
Line 6-13 |
6-13 |
6-13 |
6-13 |
6-13 |
6-13 |
6-13 |
6-13 |
6-13 |
|
Line 7-8 |
No outage |
No outage |
No outage |
7-8 |
7-8 |
7-8 |
7-8 |
7-8 |
|
Line 7-9 |
7-9 |
7-9 |
7-9 |
7-9 |
7-9 |
7-9 |
7-9 |
7-9 |
|
Line 9-10 |
9-10 |
9-10 |
9-10 |
9-10 |
9-10 |
9-10 |
9-10 |
9-10 |
|
Line 9-14 |
9-14 |
9-14 |
9-14 |
9-14 |
9-14 |
9-14 |
9-14 |
9-14 |
|
Line 10-11 |
10-11 |
10-11 |
10-11 |
10-11 |
10-11 |
10-11 |
10-11 |
10-11 |
|
Line 12-13 |
No outage |
12-13 |
12-13 |
12-13 |
12-13 |
12-13 |
12-13 |
12-13 |
|
Line 13-14 |
13-14 |
13-14 |
13-14 |
13-14 |
13-14 |
13-14 |
13-14 |
13-14 |
Table 5: Results of study case (2) using RBF kernel
|
Study Case (2): An increase of 25% at bus 3 using RBF kernel |
||||||||
|
Outage Case |
Result at C = 1 |
Result at C = 10 |
Result at C = 100 |
Result at C = 1000 |
Result at C = 1x10⁴ |
Result at C = 1x10⁵ |
Result at C = 1x10⁶ |
Result at C = 1x10⁷ |
|
Line 1-2 |
No outage |
1-2 |
1-2 |
1-2 |
1-2 |
1-2 |
1-2 |
1-2 |
|
Line 1-5 |
1-5 |
1-5 |
1-5 |
1-5 |
1-5 |
1-5 |
1-5 |
1-5 |
|
Line 2-3 |
No outage |
2-3 |
2-3 |
2-3 |
2-3 |
2-3 |
2-3 |
2-3 |
|
Line 2-4 |
2-4 |
2-4 |
2-4 |
2-4 |
2-4 |
2-4 |
2-4 |
2-4 |
|
Line 2-5 |
2-5 |
2-5 |
2-5 |
2-5 |
2-5 |
2-5 |
2-5 |
2-5 |
|
Line 3-4 |
3-4 |
3-4 |
3-4 |
3-4 |
3-4 |
3-4 |
3-4 |
3-4 |
|
Line 4-5 |
4-5 |
4-5 |
4-5 |
4-5 |
4-5 |
4-5 |
4-5 |
4-5 |
|
Line 4-7 |
4-7 |
4-7 |
4-7 |
4-7 |
4-7 |
4-7 |
4-7 |
4-7 |
|
Line 4-9 |
4-9 |
4-9 |
4-9 |
4-9 |
4-9 |
4-9 |
4-9 |
4-9 |
|
Line 5-6 |
No outage |
5-6 |
5-6 |
5-6 |
5-6 |
5-6 |
5-6 |
5-6 |
|
Line 6-11 |
6-11 |
6-11 |
6-11 |
6-11 |
6-11 |
6-11 |
6-11 |
6-11 |
|
Line 6-12 |
6-12 |
6-12 |
6-12 |
6-12 |
6-12 |
6-12 |
6-12 |
6-12 |
|
Line 6-13 |
6-13 |
6-13 |
6-13 |
6-13 |
6-13 |
6-13 |
6-13 |
6-13 |
|
Line 7-8 |
No outage |
No outage |
7-8 |
7-8 |
7-8 |
7-8 |
7-8 |
7-8 |
|
Line 7-9 |
7-9 |
7-9 |
7-9 |
7-9 |
7-9 |
7-9 |
7-9 |
7-9 |
|
Line 9-10 |
9-10 |
9-10 |
9-10 |
9-10 |
9-10 |
9-10 |
9-10 |
9-10 |
|
Line 9-14 |
9-14 |
9-14 |
9-14 |
9-14 |
9-14 |
9-14 |
9-14 |
9-14 |
|
Line 10-11 |
10-11 |
10-11 |
10-11 |
10-11 |
10-11 |
10-11 |
10-11 |
10-11 |
|
Line 12-13 |
No outage |
12-13 |
12-13 |
12-13 |
12-13 |
12-13 |
12-13 |
12-13 |
|
Line 13-14 |
13-14 |
13-14 |
13-14 |
13-14 |
13-14 |
13-14 |
13-14 |
13-14 |
Table 6: Results of study case (3) using RBF kernel
Study Case (3): An increase of 40% at bus 9 using RBF kernel
|
Outage Case |
Result at C = 1 |
Result at C = 10 |
Result at C = 100 |
Result at C = 1000 |
Result at C = 1x10⁴ |
Result at C = 1x10⁵ |
Result at C = 1x10⁶ |
Result at C = 1x10⁷ |
|
Line 1-2 |
No outage |
1-2 |
1-2 |
1-2 |
1-2 |
1-2 , 2-5 |
1-2 , 2-5 |
1-2 , 2-5 |
|
Line 1-5 |
1-5 |
1-5 |
1-5 |
1-5 |
1-5 |
1-5 |
1-5 |
1-5 |
|
Line 2-3 |
No outage |
2-3 |
2-3 |
2-3 , 9-10 |
2-3 , 9-10 |
2-3 , 9-10 |
2-3 , 9-10 |
2-3 , 9-10 |
|
Line 2-4 |
2-4 |
2-4 |
2-4 |
2-4 |
2-4 |
2-4 |
2-4 |
2-4 |
|
Line 2-5 |
2-5 |
2-5 |
2-5 |
2-5 , 1-5 |
2-5 , 1-5 |
2-5 , 1-5 |
2-5 , 1-5 |
2-5 , 1-5 |
|
Line 3-4 |
No outage |
3-4 |
3-4 |
3-4 , 5-6 |
3-4 , 5-6 |
3-4 , 5-6 |
3-4 , 5-6 |
3-4 , 5-6 |
|
Line 4-5 |
4-5 |
4-5 |
4-5 |
4-5 |
4-5 |
4-5 |
4-5 |
4-5 |
|
Line 4-7 |
4-7 |
4-7 |
4-7 |
4-7 |
4-7 |
4-7 |
4-7 |
4-7 |
|
Line 4-9 |
4-9 |
4-9 |
4-9 |
4-9 |
4-9 |
4-9 |
4-9 |
4-9 |
|
Line 5-6 |
No outage |
5-6 |
5-6 |
5-6 , 9-10 |
5-6 , 9-10 |
5-6 , 9-10 |
5-6 , 9-10 |
5-6 , 9-10 |
|
Line 6-11 |
6-11 |
6-11 |
6-11 |
6-11 |
6-11 |
6-11 |
6-11 |
6-11 |
|
Line 6-12 |
6-12 |
6-12 |
6-12 |
6-12 |
6-12 |
6-12 |
6-12 |
6-12 |
|
Line 6-13 |
6-13 |
6-13 |
6-13 |
6-13 |
6-13 |
6-13 |
6-13 |
6-13 |
|
Line 7-8 |
No outage |
No outage |
No outage |
No outage |
No outage |
No outage |
7-8 |
7-8 , 9-10 |
|
Line 7-9 |
7-9 |
7-9 |
7-9 |
7-9 |
7-9 |
7-9 |
7-9 |
7-9 |
|
Line 9-10 |
No outage |
9-10 |
9-10 |
9-10 , 2-5 |
9-10 , 2-5 |
9-10 , 2-5 |
9-10 , 2-5 |
9-10 , 2-5 |
|
Line 9-14 |
No outage |
9-14 |
9-14 |
9-14,12-13 |
9-14,12-13 |
9-14,12-13 |
9-14,12-13 |
9-14,12-13 |
|
Line 10-11 |
10-11 |
10-11 |
10-11 |
10-11, 5-6 |
10-11, 5-6 |
10-11, 5-6 |
10-11, 5-6 |
10-11, 5-6 |
|
Line 12-13 |
No outage |
12-13 |
12-13 |
12-13 |
12-13 |
12-13, 2-5 |
12-13, 2-5 |
12-13, 2-5 |
|
Line 13-14 |
13-14 |
13-14 |
13-14 |
13-14 |
13-14 |
13-14 |
13-14 |
13-14 |
Table 7: Comparison of results for polynomial and RBF kernels
|
Outage Case |
Range of log (C) for detection for Polynomial kernel |
Range of log (C) for detection for RBF kernel |
Outage Case |
Range of log (C) for detection for Polynomial kernel |
Range of log (C) for detection for RBF kernel |
|
Line 1-2 |
1 to 7 |
1 to 4 |
Line 6-11 |
0 to 4 |
0 to 7 |
|
Line 1-5 |
1 to 7 |
0 to 7 |
Line 6-12 |
4 to 7 |
0 to 7 |
|
Line 2-3 |
2 to 7 |
1 to 2 |
Line 6-13 |
0 to 7 |
0 to 7 |
|
Line 2-4 |
0 to 3 |
0 to 7 |
Line 7-8 |
6 |
5 to 6 |
|
Line 2-5 |
4 to 5 |
1 to 2 |
Line 7-9 |
0 to 5 |
0 to 7 |
|
Line 3-4 |
1 to 3 |
1 to 3 |
Line 9-10 |
Misdetection in one case |
1 to 2 |
|
Line 4-5 |
3 to 7 |
0 to 7 |
Line 9-14 |
1 |
1 to 2 |
|
Line 4-7 |
0 to 3 |
0 to 7 |
Line 10-11 |
5 to 7 |
0 to 2 |
|
Line 4-9 |
6 to 7 |
0 to 7 |
Line 12-13 |
7 |
1 to 4 |
|
Line 5-6 |
4 |
1 to 2 |
Line 13-14 |
0 to 5 |
0 to 7 |
Table 8: Results of study case (1): An increase of 25% in loading at bus 18
|
Study Case (1): An increase of 25% at bus 18 using RBF kernel |
||||||||
|
Outage Case |
Result at C = 1 |
Result at C = 10 |
Result at C = 100 |
Result at C = 1000 |
Result at C = 1x10⁴ |
Result at C = 1x10⁵ |
Result at C = 1x10⁶ |
Result at C = 1x10⁷ |
|
Line 1-2 |
No outage |
1-2 |
1-2 |
1-2 |
1-2 |
1-2 |
1-2 |
1-2 |
|
Line 1-3 |
1-3 |
1-3 |
1-3 |
1-3 |
1-3 |
1-3 |
1-3 |
1-3 |
|
Line 2-4 |
2-4 |
2-4 |
2-4 |
2-4 |
2-4 |
2-4 |
2-4 |
2-4 |
|
Line 2-5 |
No outage |
2-5 |
2-5 |
2-5 |
2-5 |
2-5 |
2-5 |
2-5 |
|
Line 2-6 |
2-6 |
2-6 |
2-6 |
2-6 |
2-6 |
2-6 |
2-6 |
2-6 |
|
Line 3-4 |
3-4 |
3-4 |
3-4 |
3-4 |
3-4 |
3-4 |
3-4 |
3-4 |
|
Line 4-6 |
4-6 |
4-6 |
4-6 |
4-6 |
4-6 |
4-6 |
4-6 |
4-6 |
|
Line 4-12 |
4-12 |
4-12 |
4-12 |
4-12 |
4-12 |
4-12 |
4-12 |
4-12 |
|
Line 5-7 |
No outage |
5-7 |
5-7 |
5-7 |
5-7 |
5-7 |
5-7 |
5-7 |
|
Line 6-7 |
6-7 |
6-7 |
6-7 |
6-7 |
6-7 |
6-7 |
6-7 |
6-7 |
|
Line 6-8 |
6-8 |
6-8 |
6-8 |
6-8 |
6-8 |
6-8 |
6-8 |
6-8 |
|
Line 6-9 |
6-9 |
6-9 |
6-9 |
6-9 |
6-9 |
6-9 |
6-9 |
6-9 |
|
Line 6-10 |
6-10 |
6-10 |
6-10 |
6-10 |
6-10 |
6-10 |
6-10 |
6-10 |
|
Line 6-28 |
6-28 |
6-28 |
6-28 |
6-28 |
6-28 |
6-28 |
6-28 |
6-28 |
|
Line 8-28 |
No outage |
No outage |
No outage |
No outage |
No outage |
No outage |
No outage |
No outage |
|
Line 9-10 |
9-10 |
9-10 |
9-10 |
9-10 |
9-10 |
9-10 |
9-10 |
9-10 |
|
Line 9-11 |
9-11 |
9-11 |
9-11 |
9-11 |
9-11 |
9-11 |
9-11 |
9-11 |
|
Line 10-17 |
10-17 |
10-17 |
10-17 |
10-17 |
10-17 |
10-17 |
10-17 |
10-17 |
|
Line 10-20 |
10-20 |
10-20 |
10-20 |
10-20 |
10-20 |
10-20 |
10-20 |
10-20 |
|
Line 10-21 |
10-21 |
10-21 |
10-21 |
10-21 |
10-21 |
10-21 |
10-21 |
10-21 |
|
Line 10-22 |
10-22 |
10-22 |
10-22 |
10-22 |
10-22 |
10-22 |
10-22 |
10-22 |
|
Line 12-13 |
12-13 |
12-13 |
12-13 |
12-13 |
12-13 |
12-13 |
12-13 |
12-13 |
|
Line 12-14 |
12-14 |
12-14 |
12-14 |
12-14 |
12-14 |
12-14 |
12-14 |
12-14 |
|
Line 12-15 |
12-15 |
12-15 |
12-15 |
12-15 |
12-15 |
12-15 |
12-15 |
12-15 |
|
Line 12-16 |
12-16 |
12-16 |
12-16 |
12-16 |
12-16 |
12-16 |
12-16 |
12-16 |
|
Line 14-15 |
14-15 |
14-15 |
14-15 |
14-15 |
14-15 |
14-15 |
14-15 |
14-15 |
|
Line 15-18 |
15-18 |
15-18 |
15-18 |
15-18 |
15-18 |
15-18 |
15-18 |
15-18 |
|
Line 15-23 |
15-23 |
15-23 |
15-23 |
15-23 |
15-23 |
15-23 |
15-23 |
15-23 |
|
Line 16-17 |
16-17 |
16-17 |
16-17 |
16-17 |
16-17 |
16-17 |
16-17 |
16-17 |
|
Line 18-19 |
18-19 |
18-19 |
18-19 |
18-19 |
18-19 |
18-19 |
18-19 |
18-19 |
|
Line 19-20 |
19-20 |
19-20 |
19-20 |
19-20 |
19-20 |
19-20 |
19-20 |
19-20 |
|
Line 21-22 |
21-22 |
21-22 |
21-22 |
21-22 |
21-22 |
21-22 |
21-22 |
21-22 |
The final conclusion is that the SVM classification tool using the RBF kernel is a powerful tool in the detection of an outage of a line. As a result, it has a great importance in the field of power system protection against line outage contingency.
VII. Testing the proposed algorithm with 30-Bus System Using RBF Kernel
In order to enhance the superiority of the proposed algorithm, the EMTDC/PSCAD simulation package is used to simulate the 30-bus IEEE system shown in Fig. 7. According to the complete observability approach [15], the PMUs are located at 10 different locations in
the buses 2, 4, 6, 9, 10, 12, 15, 19, 25 and 27. The study cases of outage considered in the training of SVM are as follow:
-
• Normal loading case as the standard IEEE system.
-
• An increase of 25% in loading at bus4.
-
• An increase of 25% in loading at bus12.
-
• An increase of 25% in loading at bus15.
-
• An increase of 25% in loading at bus17.
-
• An increase of 25% in loading at bus21.
Each of the six loading cases has an internal 41 cases of line outage for the 41 lines in the system. Therefore, 246 vectors are available to perform the required training of SVM.
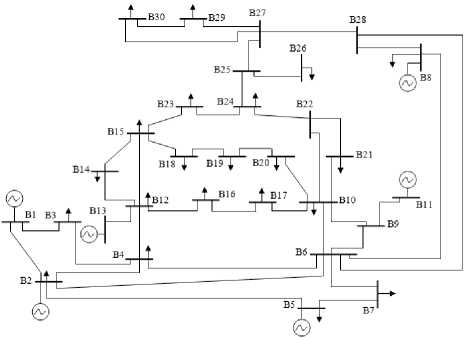
Fig. 7: IEEE 30 bus system
As mentioned previously in the case of IEEE 14-bus system, the training is made and testing is performed for different cases of loading including all possible line outages. The proposed study cases including the complete observability principle. Are as follow:
-
• Study case (1): An increase of 25% in loading at bus 18.
-
• Study case (2): An increase of 20% in loading at bus 24 + an increase of 20% in loading at bus 29.
As the conclusion in the 14-bus IEEE system is that the RBF kernel gives more accurate results. Therefore, the simulation for the 30-bue IEEE system is to be run under the using of RBF kernel function. The results of the two study cases are given in Table 8 and Table 9 respectively.
Table 8 and Table 9 introduce supportive results to the previously discussed in the case of 14-bus IEEE system. It is clear that the outage of the most of transmission lines in the network is classified very well for a wide range of penalty error '' C ''. Therefore, the accuracy of the classification for the 30-bus system is approximately equivalent to that of the 14-bus system. As a result, it can be stated that the proposed approach is suitable for large transmission networks.
|
Line 22-24 |
22-24 |
22-24 |
22-24 |
22-24 |
22-24 |
22-24 |
22-24 |
22-24 |
|
Line 23-24 |
23-24 |
23-24 |
23-24 |
23-24 |
23-24 |
23-24 |
23-24 |
23-24 |
|
Line 24-25 |
24-25 |
24-25 |
24-25 |
24-25 |
24-25 |
24-25 |
24-25 |
24-25 |
|
Line 25-26 |
25-26 |
25-26 |
25-26 |
25-26 |
25-26 |
25-26 |
25-26 |
25-26 |
|
Line 25-27 |
25-27 |
25-27 |
25-27 |
25-27 |
25-27 |
25-27 |
25-27 |
25-27 |
|
Line 27-28 |
27-28 |
27-28 |
27-28 |
27-28 |
27-28 |
27-28 |
27-28 |
27-28 |
|
Line 27-29 |
27-29 |
27-29 |
27-29 |
27-29 |
27-29 |
27-29 |
27-29 |
27-29 |
|
Line 27-30 |
27-30 |
27-30 |
27-30 |
27-30 |
27-30 |
27-30 |
27-30 |
27-30 |
|
Line 29-30 |
29-30 |
29-30 |
29-30 |
29-30 |
29-30 |
29-30 |
29-30 |
29-30 |
Table 9: Results of study case (2): An increase of 20% in loading at both buses 24 and 29
|
Study Case (2): An increase of 20% at buses 24 and 29 using RBF kernel |
||||||||
|
Outage Case |
Result at C = 1 |
Result at C = 10 |
Result at C = 100 |
Result at C = 1000 |
Result at C = 1x10⁴ |
Result at C = 1x10⁵ |
Result at C = 1x10⁶ |
Result at C = 1x10⁷ |
|
Line 1-2 |
No outage |
1-2 |
1-2 |
1-2 |
1-2 |
1-2 |
1-2 |
1-2 |
|
Line 1-3 |
1-3 |
1-3 |
1-3 |
1-3 |
1-3 |
1-3 |
1-3 |
1-3 |
|
Line 2-4 |
2-4 |
2-4 |
2-4 |
2-4 |
2-4 |
2-4 |
2-4 |
2-4 |
|
Line 2-5 |
No outage |
2-5 |
2-5 |
2-5 |
2-5 |
2-5 |
2-5 |
2-5 |
|
Line 2-6 |
2-6 |
2-6 |
2-6 |
2-6 |
2-6 |
2-6 |
2-6 |
2-6 |
|
Line 3-4 |
3-4 |
3-4 |
3-4 |
3-4 |
3-4 |
3-4 |
3-4 |
3-4 |
|
Line 4-6 |
4-6 |
4-6 |
4-6 |
4-6 |
4-6 |
4-6 |
4-6 |
4-6 |
|
Line 4-12 |
4-12 |
4-12 |
4-12 |
4-12 |
4-12 |
4-12 |
4-12 |
4-12 |
|
Line 5-7 |
No outage |
No outage |
5-7 |
5-7 |
5-7 |
5-7 |
5-7 |
5-7 |
|
Line 6-7 |
6-7 |
6-7 |
6-7 |
6-7 |
6-7 |
6-7 |
6-7 |
6-7 |
|
Line 6-8 |
6-8 |
6-8 |
6-8 |
6-8 |
6-8 |
6-8 |
6-8 |
6-8 |
|
Line 6-9 |
6-9 |
6-9 |
6-9 |
6-9 |
6-9 |
6-9 |
6-9 |
6-9 |
|
Line 6-10 |
6-10 |
6-10 |
6-10 |
6-10 |
6-10 |
6-10 |
6-10 |
6-10 |
|
Line 6-28 |
6-28 |
6-28 |
6-28 |
6-28 |
6-28 |
6-28 |
6-28 |
6-28 |
|
Line 8-28 |
No outage |
No outage |
No outage |
No outage |
No outage |
No outage |
No outage |
No outage |
|
Line 9-10 |
9-10 |
9-10 |
9-10 |
9-10 |
9-10 |
9-10 |
9-10 |
9-10 |
|
Line 9-11 |
9-11 |
9-11 |
9-11 |
9-11 |
9-11 |
9-11 |
9-11 |
9-11 |
|
Line 10-17 |
No outage |
10-17 |
10-17 |
10-17 |
10-17 |
10-17 |
10-17 |
10-17 |
|
Line 10-20 |
10-20 |
10-20 |
10-20 |
10-20 |
10-20 |
10-20 |
10-20 |
10-20 |
|
Line 10-21 |
10-21 |
10-21 |
10-21 |
10-21 |
10-21 |
10-21 |
10-21 |
10-21 |
|
Line 10-22 |
10-22 |
10-22 |
10-22 |
10-22 |
10-22 |
10-22 |
10-22 |
10-22 |
|
Line 12-13 |
12-13 |
12-13 |
12-13 |
12-13 |
12-13 |
12-13 |
12-13 |
12-13 |
|
Line 12-14 |
12-14 |
12-14 |
12-14 |
12-14 |
12-14 |
12-14 |
12-14 |
12-14 |
|
Line 12-15 |
12-15 |
12-15 |
12-15 |
12-15 |
12-15 |
12-15 |
12-15 , 14-15 |
12-15 , 14-15 |
|
Line 12-16 |
12-16 |
12-16 |
12-16 |
12-16 |
12-16 |
12-16 |
12-16 |
12-16 |
|
Line 14-15 |
14-15 |
14-15 |
14-15 |
14-15 |
14-15 |
14-15 |
14-15 |
14-15 |
|
Line 15-18 |
15-18 |
15-18 |
15-18 |
15-18 |
15-18 |
15-18 |
15-18 |
15-18 |
|
Line 15-23 |
15-23 |
15-23 |
15-23 |
15-23 |
15-23 |
15-23 |
15-23 |
15-23 |
|
Line 16-17 |
16-17 |
16-17 |
16-17 |
16-17 |
16-17 |
16-17 |
16-17 |
16-17 |
|
Line 18-19 |
18-19 |
18-19 |
18-19 |
18-19 |
18-19 |
18-19 |
18-19 |
18-19 |
|
Line 19-20 |
19-20 |
19-20 |
19-20 |
19-20 |
19-20 |
19-20 |
19-20 |
19-20 |
|
Line 21-22 |
No outage |
No outage |
No outage |
21-22 |
21-22 |
21-22 |
21-22 |
21-22 |
|
Line 22-24 |
22-24 |
22-24 |
22-24 |
22-24 |
22-24 |
22-24 |
22-24 |
22-24 |
|
Line 23-24 |
23-24 |
23-24 |
23-24 |
23-24 |
23-24 |
23-24 |
23-24 |
23-24 |
|
Line 24-25 |
24-25 |
24-25 |
24-25 |
24-25 |
24-25 |
24-25 |
24-25 |
24-25 |
|
Line 25-26 |
25-26 |
25-26 |
25-26 |
25-26 |
25-26 |
25-26 |
25-26 |
25-26 |
|
Line 25-27 |
25-27 |
25-27 |
25-27 |
25-27 |
25-27 |
25-27 |
25-27 |
25-27 |
|
Line 27-28 |
27-28 |
27-28 |
27-28 |
27-28 |
27-28 |
27-28 |
27-28 |
27-28 |
|
Line 27-29 |
27-29 |
27-29 |
27-29 |
27-29 |
27-29 |
27-29 |
27-29 |
27-29 |
|
Line 27-30 |
27-30 |
27-30 |
27-30 |
27-30 |
27-30 |
27-30 |
27-30 |
27-30 |
|
Line 29-30 |
29-30 |
29-30 |
29-30 |
29-30 |
29-30 |
29-30 |
29-30 |
29-30 |
-
VIII. Conclusion
The paper presents the SVM classification tool in determination of the outage of a line in a power network based on the technology of PMUs.
The paper suggests applying a parallel processing for each line with the optimum range of penalty error. Also, the paper show the superiority of the RBF kernel compared with the polynomial kernel in the process of classification related to the line outage problem. Therefore, the approach reaches an accuracy of 60 correct detections over 60 possible cases of outage scenarios including three study cases for the 14-bus IEEE power system and 80 correct detections over 82 possible cases including two study cases for the 30-bus IEEE power system with the use of RBF kernel.
The research can be applicable for any network especially when the regular daily loading cases are considered in the training of SVM. Hence, the actual case of line outage will not be so far from the training cases. As a result, a good detection will be achieved.
It is suggested to get a dynamic training of SVM related to the variations of network loading stated by the network dispatch center. Future work will consider larger systems.
References The Application of Phasor Measurement Units in Transmission Line Outage Detection Using Support Vector Machine
- US-Canada Power System Outage Task Force. Final Report on August 14, 2003 the Blackout in the United States and Canada, 2004.
- US-Canada Power System Outage Task Force. Final Report on the Implementation of the Task Force Recommendations, 2006.
- B. Singh, N. Sharma, A. Tiwari, K. Verma, and S. Singh, “Applications of phasor measurement units (PMUs) in electric power systems network incorporated with FACTS controllers,” International Journal of Engineering, Science and Technology, vol. 3, no. 3, pp. 64–82, 2011.
- Weiqing Jiang, Vijay Vittal, and Gerald T. Heydt, "A Distributed State Estimator Utilizing Synchronized Phasor Measurements", IEEE Transactions on Power Systems, Vol. 22, No. 2, pp. 563-571, May 2007.
- George N. Korres, and Nikolas M. Manousakis, "State estimation and bad data processing for system including PMU and SCADA measurements", Electric Power Systems Research, 81 (2011), pp. 1514-1524, March 2011.
- A. Monticelli, “Modeling circuit breakers in weighted least squares state estimation,” IEEE Trans. Power Syst., vol. 8, no. 3, pp. 1143–1149, Aug. 1993.
- M. Kezunovic, “Monitoring of power system topology in real-time,” in Proc. 39th Hawaii Int. Conf. System Sciences, Jan. 2006.
- E. Lourenço, A. Costa, K. Clements, and R. Cernev, “A topology error identification method directly based on collinearity tests,” IEEE Trans. Power Syst., vol. 21, no. 4, pp. 1920–1929, Nov. 2006.
- T. A. Mikolinnas and B. F. Wollenberg, “An advanced contingency selection algorithm,” IEEE Trans. Power Apparatus Syst., vol. PAS-100, no. 2, pp. 608–617, Feb. 1981.
- G. D. Irissari, and A. M. Sasson, “An automatic contingency selection method for online security analysis,” IEEE Trans Power Apparatus Syst., vol. PAS-100, no. 4, pp. 1838–1844, Apr. 1981.
- S. Vemuri, and R. E. Usher, “On line automatic contingency selection algorithms,” IEEE Trans Power Apparatus Syst., vol. PAS-102, no. 2, pp. 346–354, Feb. 1983.
- D. Hazarika, S. Bhuyan, and S.P. Chowdhury, “Line outage contingency analysis including the system islanding scenario” Electrical Power and Energy Systems, vol. 28, no. 4, pp, 232–243, May 2006.
- J. E. Tate, and T. J. Overbye, “Line outage detection using phasor angle measurements,” IEEE Transactions on Power Systems, vol. 23, no. 4, pp. 1644–1652, Nov. 2008.
- J. E. Tate, and T. J. Overbye, “Double line outage detection using phasor angle measurements,” IEEE Power & Energy Society General Meeting Proceeding, pp. 1–5, July 2009.
- S. Chakrabarti, and E. Kyriakides, “Optimal placement of phasor measurement units for power system observability,” IEEE Transactions on Power Systems, vol. 23, no. 3, pp. 1433–1440, Aug. 2008.
- S. Abe, Support Vector Machines for Pattern Classification. England: Springer-Verlag, London, Ltd, 2005.
- I. Steinwart, and A. Christmann, Support Vector Machines, New York: Springer, 2008.
- V. Vapnik, “The Nature of Statistical Learning Theory,”. Springer, N.Y., 1995. ISBN 0-387-94559-8.
- Q. H. Wu, Z. Lu and T. Y. Ji, Protective relaying of power systems using mathematical Morophology, Springer-Verlag London Limited 2009.
- PSCAD User’s Guide Ver. 4.2, Manitoba Research Center, April 2005.
