The Arctic population: dynamics and centers of the settlement system

Author: Smirnov Andrey V.
Journal: Arctic and North @arctic-and-north
Section: Northern and arctic societies
Article in issue: 40, 2020.
Free access
The article presents an estimate of the Arctic population in 1900-2019 by country and macro-region, obtained using official statistics of eight Arctic States. Analysis of spatial and temporal data revealed the main patterns of the Arctic population formation. Calculations show the world’s Arctic population increased from 1.3 million in 1900 to 6.1 million in 1989, and then declined to 5.4 million in 2019. The share of Russia varied from 22% to 58%. The data show that interregional migration in the Russian Arctic had a decisive influence on the demographic dynamics of the Arctic in general. The main reasons for the decline in the Arctic population in different periods were the completion of cycles of natural resource development and lower quality of life in comparison with the central regions. To smooth out differences in national statistical accounting systems, the article examines the dynamics of the population in 17 major centers of settlement in the Arctic, where more than two-thirds of the population lives. Calculations show that urbanization and population concentration in several of the most attractive areas of the Arctic continue. Administrative and educational centers, which are points of attraction for residents of other Arctic territories, get an advantage. The results of the study allow us to predict the further evolution of the Arctic settlement system. They can be used in the development of strategies and programs for the spatial development of the North and the Arctic.
Population, demography, centers of the settlement system, spatial development, arctic
Short address: https://sciup.org/148318387
IDR: 148318387 | UDC: 314.(98)(045) | DOI: 10.37482/issn2221-2698.2020.40.270
Text of the scientific article The Arctic population: dynamics and centers of the settlement system
Interest in the Arctic in the scientific world is due to the huge reserves of natural resources, the prospects for the development of transport routes, climatic changes, high human development and the original culture of the indigenous peoples of this mega-region [1, Fauzer V.V., Smirnov A.V.]. It is no less important that the Arctic is a unique example of how millions of people live in extreme natural and climatic conditions. The accumulated experience can be in demand in various spheres [2, Zamyatina N.Yu., Pilyasov A.N.], which determines the relevance of the study of Arctic societies.
The high spatial heterogeneity of the demographic characteristics of the Arctic, combined with the cyclical nature of migration processes, make it difficult to study the population. Therefore, in most publications on the Arctic population, attention is focused either on individual territories or on short time periods. Even the most ambitious analysis given in the Arctic Human Development Report [3, Bogoyavlenskiy D., Siggner A., p. 30], considers only the interval 1940–2000 and has many data gaps. Another problem is the differences in the administrative-territorial and municipal structure of the Arctic countries, which do not allow direct comparisons of indicators characterizing the features of settlement. All this makes it difficult to obtain new knowledge about the patterns of population development and the evolution of settlement systems in the Arctic.
∗ For citation:
In this paper, using a variety of statistical databases published in recent years, an attempt is made to consider the dynamics of the size and distribution of the population in the context of all Arctic countries and macroregions over an extensive time interval from 1900 to 2019. To neutralize the influence of national characteristics of statistical accounting, the dynamics of the population in the vicinity of the seventeen most populated points of the world Arctic is additionally considered. Distances between settlements can be calculated using the same methodology for all countries, which allows the formation of comparable statistical units for comparative analysis.
The object of the study is the population of the Arctic. The purpose of the article is to improve understanding of the processes of formation of the Arctic population as a unique sociodemographic phenomenon, using spatial and temporal analysis of demographic statistics. The scientific novelty of the study lies in the fact that for the first time, using a unified methodology, estimates of the number of all territories of the world Arctic have been obtained since the beginning of the 20th century, and trends in the evolution of the largest centers of settlement in the Arctic have been identified.
At the beginning of the article, theoretical approaches to the study of demographic processes in the Arctic are considered. Then the research methodology is presented. The main results are divided into two sections: the first is devoted to the dynamics of the population of the Arctic in the 20th – 21st centuries, the second - to the processes of urbanization and the evolution of settlement systems in the Arctic at the beginning of the XXI century. In the conclusion, conclusions are formulated and prospects for further research are indicated.
Arctic population as a socio-demographic phenomenon
The main characteristics of the population of the Arctic include: a high degree of urbanization with a low population density, a high proportion of men with a low proportion of the elderly, high birth rates with a low life expectancy, and high migration mobility of the population (in comparison with the non-Arctic territories of the northern countries). All demographic characteristics of the Arctic are extremely heterogeneous both between countries and between the territories of individual countries. In many regions of the Arctic, the spatial distribution of the indigenous peoples of the North has a great influence on demographic processes. For areas inhabited by indigenous peoples are usually characterized by a higher birth rate and low life expectancy [3, Bogoyavlenskiy D., Siggner A.; 4, Heleniak T., Bogoyavlenskiy D.; 5, Hamilton L.C., Wirsing J., Saito K.]. Indigenous people make up almost 90% of the population of Greenland, more than half of the population of the Arctic territories of Canada, 15% in Alaska and from 0 to 12% in the European Arctic. In Russia, the indigenous peoples of the North make up about 4% of the population of the Arctic1.
The above is reflected in two theoretical approaches that are used to study demographic processes in the Arctic - resource and spatial. The first focuses on the temporal measurement of
Andrey V. Smirnov. The Arctic Population … demographic processes in the context of economic cycles, the second - on the patterns of distribution of population, infrastructure, and natural resources in space. Together, these two approaches form the conceptual framework of Arctic demography.
The resource-based approach considers demographic development in relation to the stages of natural resource development. Organization of large-scale mining requires the involvement of a large number of workers during the "boom", and after their depletion or decrease in demand for resources, a period of “bust” occurs, there is a migration outflow of the population, the age and sex structure is deformed [4, Heleniak T., Bogoyavlenskiy D.; 6, Shiklomanov N., Streletskiy D., Suter L. et al.]. The cyclical nature of migration processes, not only long-term, but also seasonal, sets the rhythm of life for Arctic communities and generates social and infrastructural problems.
Since in the Western European Arctic sectors of the economy that are not related to raw materials bring a significant part of the gross product, the influence of cyclicality there is not so noticeable. It is also important that these countries hold leading positions in terms of human development and the quality of life of the population. As a result, research aimed at the formation of smart specialization of territories is becoming increasingly important [7, Jungsberg L., Copus A. et al.; 8, Teras J., Salenius V. et al.], stimulating human development and dissemination of knowledge in the Arctic [9, Pilyasov A.N.; 10, Petrov A.; 11, Petrov A.; 12, Smirnov A.V.].
The spatial approach considers demographic processes from the standpoint of proximity and remoteness of settlements [13, Zamyatina N.Yu., Pilyasov A.N.], the influence of the agglomeration effect [14, Scott A., Storper M.; 15, Zamyatina N., Goncharov R.], transport accessibility and geographical features of settlement systems [16, Huskey L.; 17, Berman M., Lance H.]. The settlements of the Arctic are considered as “settlements at the edge”, the demographic situation in which can radically change as a result of migration [18, Saxinger G., Petrov A., Krasnoshtanova N. et al.]. In addition, rotational work organization is widespread in the sparsely populated areas of the Arctic. It can give rise to socio-demographic problems, since jobs go not to the local population, but to residents of other territories. At the same time, the transfer of competencies from shift workers to local residents is organized extremely rarely [7, Jungsberg L., Copus A. et al.].
The spatial approach also includes a significant part of studies of the influence on demography of natural and climatic factors: these are medical and geographical restrictions on living in the Arctic [19, Vinogradova V.V., Zolotokrylin A.N., Krenke A.N.], and migration under the influence of climatic changes [20, Heleniak T.; 21, Hamilton L.C., Saito K. et al.]. It is expected that climate change faster and more intense will occur in the Arctic [22, Bird D., McLeman R., Gísladóttir G. et al.]. They will cause a decrease in the ice area, coastal erosion, the disappearance of populations of game animals and the thawing of permafrost, which will negatively affect the infrastructure of Arctic settlements and affect the way of life of indigenous people.
Obviously, the most productive for the study of the population in the Arctic is an integrated approach that simultaneously considers both temporal and spatial characteristics of demographic
Andrey V. Smirnov. The Arctic Population … development. A basic statistic such as population size provides detailed data for a wide variety of locations and times.
Research methodology
Although people have been living in the Arctic for about 40 thousand years [23, Pavlov P., Svendsen J.I., Indrelid S.], the Arctic was most intensively populated in the 20th-21st centuries. In addition, starting from the late 19th - early 20th centuries. In most countries, population censuses have begun, which allows obtaining more accurate data on the dynamics of the number of inhabitants living in the Arctic regions. Therefore, 1900 was chosen as the starting point for the analysis of the population size.
The Arctic includes all or part of the territory of eight countries. Russian Arctic in the study adopted in the regulatory approved boundaries of the Russian Arctic (as amended on May 13, 2019 2), and foreign - within the boundaries determined by the Arctic Council 3. For the convenience of analysis, the Arctic will be considered within the framework of three macroregions: Russian, Western European, and North American (Table 1). The population of the entire world Arctic, whose territory occupies about 13.2 million square km (8.9% of the earth’s land area) is only 5.4 million people. This roughly corresponds in number to cities such as St. Petersburg or Singapore. However, considering unfavorable natural conditions, this value is quite large. For comparison, the southern circumpolar region - Antarctica - has no permanent population, and the temporary does not exceed several thousand people.
Table 1
Composition of the Arctic 4
|
Macro region |
Country |
Territories |
Area, km2 |
|
Russian |
Russia |
Completely included: Murmansk Oblast, Nenets AO, Yamal-Nenets AO, Chukotsky АО; Partly included: Arkhangelsk Oblast (7 townships and municipal areas), Republic of Karelia (3), Komi Republic (1), Krasnoyarsky Krai (3), Republic of Sakha (Yakutia) (13) |
4 769 508 |
|
West European |
Finland |
Lapland, Nort Ostrobothnia, Kainuu |
168 910 |
|
Sweden |
Norrbotten, Västerbotten |
153 431 |
|
|
Norway |
Nordland, Troms, Finnmark, Svalbard, Jan Mayen |
174 350 |
|
|
Iceland |
Completely arctic |
102 775 |
2 Decree of the President of the Russian Federation of 05/02/2014 No. 296 “On the land territories of the Arctic zone of the Russian Federation” (as amended by the Decrees of the President of the Russian Federation of June 27, 2017 No. 287, of 05/13/2019 No. 220).
3Arctic administrative areas. URL: (access-sed 01 March 2020).
4 Compiled by the author.
|
Denmark |
Faroe islands |
1 399 |
|
|
North American |
Denmark |
Greenland |
2 166 086 |
|
Canada |
Yukon, Northwest Territories, Nunavut |
3 921 739 |
|
|
USA |
Alaska |
1 723 337 |
|
|
Total |
13 181 534 |
||
Estimation of the population of the Arctic in the 20th-21st centuries was carried out in three stages. The first stage is the collection of data from official statistical agencies on the population of 26 arctic areas is found in Table. 1. The sources were databases and publications of statistical agencies of eight Arctic countries 5. Priority was given to the results of population censuses. At the second stage, the values of the population of the Arctic regions were estimated for those years for which there is no official statistical information, which mainly concerns the first half of the 20th century. Often, gaps in official data cover no more than 4-9 consecutive years. Using the linear interpolation method, intermediate values were estimated from the nearest known values. This made it possible to estimate the population size at the beginning of each year, starting from 1900. When interpreting the results, it should be borne in mind that such a method can distort the situation in those years when significant demographic changes took place, for example, during world wars. At the third stage, the data were aggregated at the levels of the Arctic countries, macroregions and the world Arctic as a whole.
The greatest difficulty was caused by the estimation of the population of the Russian Arctic, since until 1959 the population censuses were irregular, and the intercensal periods were extremely long. In addition, the borders of the Arctic zone of the Russian Federation pass not only between regions, but also between municipalities within regions, the contours of which in the 20th century changed several times. The assessment was based on a study of the population dynamics of the Arctic zone of Russia in 1939–2017 [24, Fauzer V.V., Smirnov A.V.]. It is supplemented by taking into account individual time periods and territories that entered the Arctic zone as a result of its expansion in 2019.In addition, the estimates of the population of Yamal in the first half of the 20th century, obtained by N.A. Mikhalev [25, Mikhalev N.A.]. Nevertheless, since the boundaries of the territories during the first population censuses differed significantly from the current ones, the estimate of the population size of the Russian Arctic at the beginning of the 20th century may have a high error.
In the 21st century, demographic data were released more frequently and in greater detail. Therefore, for the period 2000–2019. it became possible to study not only the dynamics of the population, but also detailed patterns of its spatial distribution. To this end, the largest settlement centers have been identified in the world Arctic, with more than 70 thousand inhabitants living with- in a radius of 100 km. More than two thirds of the Arctic population live in 17 centers. The number of inhabitants of settlement centers was estimated in the context of three zones, differing in distance from the center: the central city, settlements within a radius of up to 50 km from the center, and a settlement within a radius of 50 to 100 km from the center. Such values were chosen because a distance of up to 50 km is comfortable for “pendulum” migrations of workers, and 100 km is the approximate border of the zone of influence of large urban agglomerations on the placement of settlements and residents [26, Pumain D., p. 83]. The citypopulation.de databases were used for calculations 6 (population of settlements) and geonames.org7 (geographic coordinates of settlements for calculating the distance between them). Analysis of the population dynamics in the vicinity of these 17 points made it possible to assess in detail the current processes of urbanization and population polarization in the Arctic space.
Regularities of the formation of the population of the Arctic
First of all, let us pay attention to the total population of the northern circumpolar region of the Earth. The population of the global Arctic grew during most of the 20th century (Table 2). By 1989, it had increased 4.7 times - from 1.3 million at the beginning of the century to 6.1 million, reaching its peak. The growth rate throughout this period was about 1–3% per year. In absolute terms, the population of the Arctic increased the fastest in the 1970s and 1980s. Starting in 1990, the upward trend changed to a diminishing one, but in the 2010s the population stabilized and even began to increase again. After 1989, the Arctic has lost 0.6 million inhabitants, or 10% of the population. The share of the Arctic in the world population increased during the first six decades of the 20th century, after which, on the contrary, it decreased. By 2019, it became even lower than at the beginning of the 20th century.
Table 2
Population of the Arctic by countries, 1900–2019, thousand people 8
|
Territory |
Year |
||||||||||||
|
1900 |
1910 |
1920 |
1930 |
1940 |
1950 |
1960 |
1970 |
1980 |
1990 |
2000 |
2010 |
2019 |
|
|
World Arctic |
1303 |
1441 |
1618 |
1966 |
2512 |
3150 |
3820 |
4442 |
5199 |
6037 |
5600 |
5399 |
5439 |
|
including: |
|||||||||||||
|
Russia |
282 |
358 |
435 |
643 |
1043 |
1398 |
1766 |
2257 |
2819 |
3429 |
2867 |
2526 |
2439 |
|
USA |
64 |
64 |
55 |
59 |
73 |
129 |
226 |
300 |
402 |
550 |
627 |
710 |
737 |
|
Finland |
281 |
296 |
331 |
384 |
434 |
527 |
612 |
598 |
613 |
641 |
651 |
659 |
664 |
6The demographic database was compiled by T. Brinhoff on the basis of official statistical publications of the countries of the world. URL: (accessed 01 March 2020).
7The GeoNames geographic database covers all countries and contains over eleven million geographic names. URL: (accessed 01 March 2020).
8Calculated by the author based on data from collections and databases of national statistical agencies of the Arctic countries and the UN. Norway before 1990 - excluding Svalbard.
|
Sweden |
279 |
323 |
365 |
404 |
436 |
473 |
501 |
490 |
509 |
513 |
515 |
508 |
521 |
|
Norway |
243 |
266 |
291 |
315 |
344 |
404 |
437 |
456 |
469 |
464 |
467 |
468 |
489 |
|
Iceland |
78 |
85 |
93 |
106 |
120 |
141 |
174 |
204 |
227 |
254 |
279 |
318 |
357 |
|
Canada |
51 |
18 |
13 |
13 |
17 |
24 |
36 |
51 |
68 |
84 |
93 |
106 |
124 |
|
Denmark including: |
26 |
31 |
35 |
41 |
46 |
54 |
67 |
85 |
93 |
103 |
102 |
105 |
108 |
|
Greenland |
11 |
13 |
14 |
17 |
18 |
23 |
33 |
46 |
50 |
56 |
56 |
56 |
56 |
|
Faroe Islands For reference: |
15 |
18 |
21 |
24 |
27 |
31 |
34 |
39 |
43 |
48 |
45 |
48 |
52 |
|
World, million people Share of the Arctic in |
1650 |
1750 |
1860 |
2070 |
2300 |
2536 |
3035 |
3700 |
4458 |
5327 |
6144 |
6957 |
7714 |
|
the world population,% |
0,08 |
0,08 |
0,09 |
0,09 |
0,11 |
0,12 |
0,13 |
0,12 |
0,12 |
0,11 |
0,09 |
0,08 |
0,07 |
In terms of countries, throughout the entire period in terms of population, Russia was in the lead (until 1990 - the USSR), whose Arctic population for the period 1900-2019. increased by 8.6 times. Due to this concentration of human resources, primarily engaged in the extraction of minerals, Russia has become a leader in terms of the volume of GRP produced in the Arctic, while yielding to other countries in terms of relative economic indicators [1, Fauzer V.V., Smirnov A.V., p. 17]. The share of Russia in the population of the world Arctic ranged from 21.6% in 1900 to 57.5% in 1989, and by 2019 decreased to 44.8%. The US Arctic population, the second largest, has increased 11.5 times over these 120 years. Other countries showed moderate growth, ranging from 1.9 to 4.6 times, because they did not have such a high potential for internal migration. The smallest share in the population of the Arctic is in Canada and Denmark, despite their vast territories. The dynamics in the context of macroregions shows that in different parts of the Arctic, the rates of population varied significantly (Fig.1).
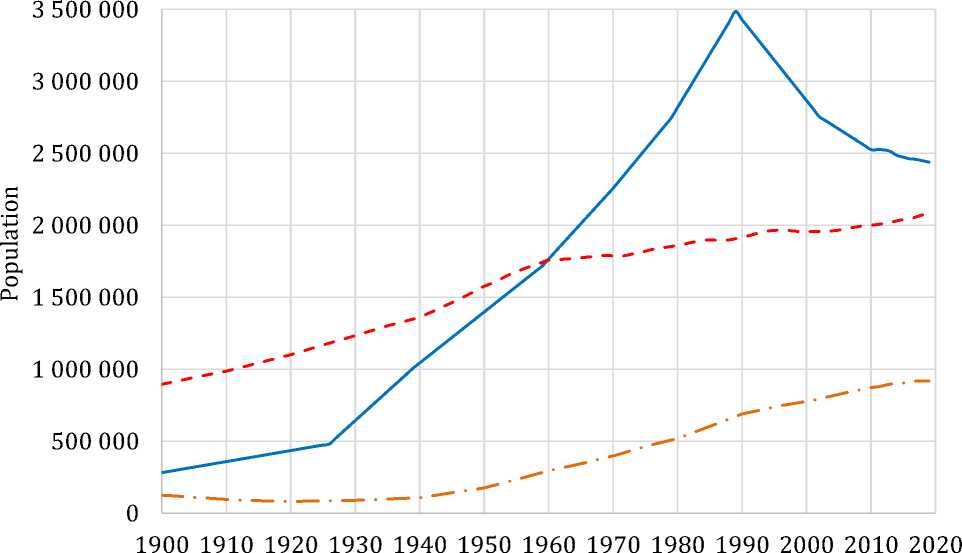
Macroregions
Russian West European North American
Fig. 1. Population of the Arctic by macroregions, 1900–2019, people9.
If at the beginning of the 20th century. the slope of the population dynamics curve for the Russian Arctic did not differ from that in Western Europe, but in the 1930s it changed during the period of large-scale development of the Arctic space by the Soviet Union. The graph shows that it was the Russian Arctic that made the greatest contribution to the demographic dynamics of the global Arctic in the 20th century. More than 60% of the total increase came from Russia. The rapid increase in the population in the Soviet period was provided primarily by interregional migration, partly forced [27, Lytkina T.S., Fauzer V.V.; 28, Fauzer V.V., Lytkina T.S.].
The Arctic population has not always and everywhere demonstrated growth. There have been three major population declines. The first occurred in the North American Arctic in 1900 – 1919. The outflow to the United States and Canada during this period was fueled by the end of the Klondike Gold Rush. The decline over 20 years was a total of 47 thousand people, or 41% of the population of Alaska and the Canadian Arctic in 1900. The second reduction is the migration outflow from the Arctic regions of Finland and Sweden in the 1960s to the central regions and neighboring countries. The decline was caused primarily by the difference in the standard of living between neighboring territories and amounted to 26 thousand people or 2.3% of the Arctic population of these countries.
Finally, the third and largest reduction, which continues today, is the migration outflow from the Russian Arctic, which began in 1990. Its genesis is of a combined nature. In part, it is caused by a decrease in the need for workers in the extractive industry, influenced by the growth of labor productivity and the reduction in the volume of mining. By the 1990s in many territories of the old development, a stage of decline in the resource cycle has begun, associated with both the depletion of deposits and a decrease in demand for resources after the destruction of the Soviet economic system and established supply chains. Many industrial productions turned out to be uncompetitive in a market economy. In addition, the Russian Arctic has lost its attractiveness for migration in the perception of the residents themselves due to a decrease in the relative level and quality of life, compression of the once extensive social and engineering infrastructure, the lack of prospects for long-term development of territories [29, Lytkina T.S., Smirnov A.V.; 30, Lytkina T.S., Smirnov A.V.]. By 2019, the decline was 1,046 thousand people, or 30% of the 1989 population. Despite the high migration mobility, the permanent population in the Russian Arctic is decreasing annually, and the move from central Russia to the Arctic continues to be considered as a tool for accumulating resources for further movement to a larger and "prestigious" city outside the Arctic zone [31, Zamyatina N., Yashunsky A., p. 83].
These patterns have also led to some changes in the population density of the Arctic territories of the countries (Fig. 2). The countries of Western Europe are distinguished by a high density, in the Arctic parts of which in 2019 it ranges from 2.8 to 4.0 people per 1 sq. km. The opposite situation is in Canada and Denmark (0.03 and 0.05, respectively), where the population density is two orders of magnitude lower. In the Russian Arctic (0.51) and Alaska (0.43), the density roughly corresponds to the global Arctic average (0.41). A consequence of the high share of Russia both in the population size and in the area of the Arctic territory is that throughout the entire period, the population density of the global Arctic did not differ significantly from the density of the Russian part. For this indicator, the Arctic stands out significantly on a global scale. The density of the world's population is 51.5 people per 1 sq. km of land, which is more than two orders of magnitude higher than the population density of the Arctic. From the Arctic regions, a similar density value can be observed only in the Faroe Islands (36.8).
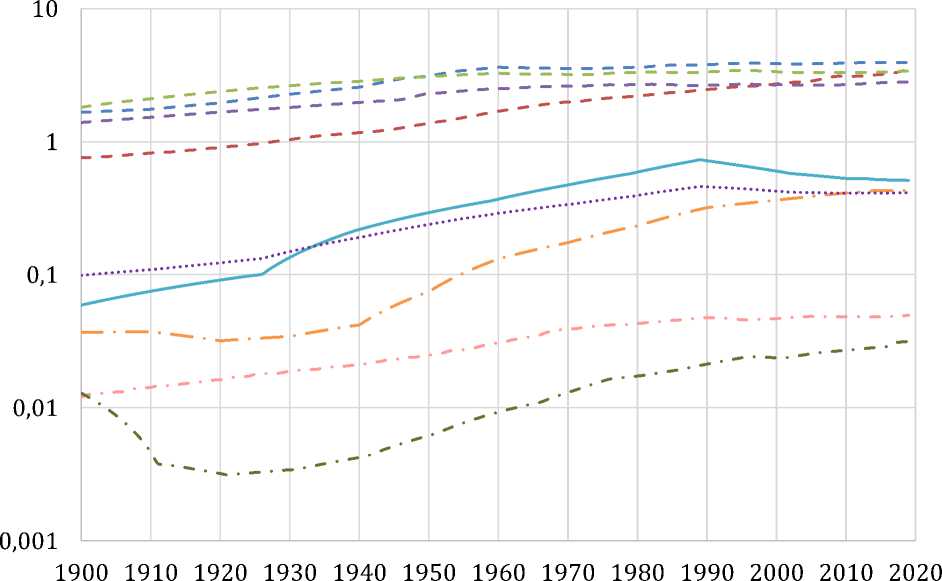
Finland
Norway
World Arctic
Iceland
Russia
Denmark
Sweden
USA
Canada
Fig. 2. Population density in the Arctic by country, 1900–2019, people per sq. km10.
In the dynamics of the population of the Arctic 20th-21st centuries the influence of both global demographic trends and socio-economic characteristics of individual countries is traced. Since the Arctic countries belong to the highly developed “global North”, they have fully felt the impact of the urbanization of the first and then the second demographic transition to fewer children, which was reflected in a decrease in the rate of natural population growth. After 1960, the share of the Arctic in the world's population began to decline. At the same time, migration remained the main driver of demographic dynamics, which was largely determined by the economic and geopolitical priorities of states. The large-scale and extensive development of natural resources in the Soviet Union, the development of the navy and transport routes required the involvement of a huge number of workers in the sparsely populated areas of the Arctic. Similar processes took place on a smaller scale in the USA and Canada.
In Western European countries, the Arctic territories are no longer perceived as sources of natural resources; the service sector and the knowledge economy are actively developing there. Nevertheless, due to the huge reserves of hydrocarbons in the 21st century the ups and downs in the Arctic economy, associated with the discovery and depletion of resources, will continue. They will continue to influence the population size [4, Heleniak T., Bogoyavlenskiy D., p. 102]. All demographic projections agree that the population of the Arctic will grow at a moderate pace over the coming decades. The continuing population decline in the Russian Arctic will partially counterbalance the growth in other Arctic countries [32, Emelyanova A.; 33, Gassen N.S., Heleniak T.; 34, Hele-niak T.]. In the long term, we can expect the stabilization of the population of the Arctic zone of the Russian Federation and population growth in the global Arctic, caused by the high migration attractiveness of the northern countries.
The analysis shows that the Arctic in the 20th-21st centuries underwent dramatic fluctuations in population, while maintaining an extremely high uneven settlement. And if in the first decades the settlement processes clearly obeyed the logic of the development of natural resources, then by the end of the 20th century other motives began to come to the fore - the spatial unevenness of economic development and the quality of life of the population. For a detailed analysis of the spatial patterns of population formation, it is necessary to consider the key centers of settlement of the world Arctic.
Population in the Arctic: remoteness and over-urbanization
The small number of medium and large cities in the Arctic and significant distances between them [35, Fauzer V.V., Lytkina T.S., Fauzer G.N., p. 49] have led to the fact that only a few places concentrate in themselves most of the demographic and labor potential, form the cultural and infrastructural provision of vast territories. The role of the largest cities and their inhabitants in the Arctic regions will remain decisive. When attracting a large number of employees from other regions, the labor market is segmented into a sector for the local population and a sector for visitors. Moreover, the level of remuneration in the latter is often higher, which leads to stratification, conservation of poverty and growth of social tension. Therefore, the principles of sustainable development predetermine “the further formation of the Arctic settlement according to the principle of “base city - in-tra-regional shift”, when there is an interaction of stationary base cities, with a full-fledged infrastructure and multifunctional purpose, where the working contingent with families constantly lives, and small mobile settlements at the fields” [36, Blagodeteleva O.M., p. 21]. In scientific works, the concepts of self-sufficient settlements [37, Dmitrieva T.E., Bury O.V.] and supporting settlements [38, Fauzer V.V., Smirnov A.V., Lytkina T.S., Fauzer G.N.] in the Arctic, the most suitable candidates for the role of which are the largest cities that combine many functions and have sufficient human potential.
Large and medium-sized cities, due to the economic advantages caused by the spatial proximity of residents and organizations (agglomeration effect), draw the population from the adjacent areas, increasing the degree of concentration of the Arctic settlement system (Table 3). More than two-thirds of the entire Arctic population lives in the 100-kilometer neighborhood of the 17 largest centers of settlement in the world Arctic, although their area is only 4% of the area of the Arctic territories. The largest settlement centers are Arkhangelsk (600 thousand inhabitants), Murmansk
(458), Anchorage (369), Oulu (358) and Reykjavik (268). These five cities and their surrounding territories are home to 38% of the Arctic population, or more than 2 million people. Arkhangelsk together with Severodvinsk and Novodvinsk forms the largest urban agglomeration in the world Arctic.
Largest centers of settlement in the Arctic at the beginning of 2019 11
Table 3
|
Rang |
Settlement centers |
Country |
Population, people |
Share of the Arctic population (100 км), % |
Average annual air temperature, °C |
|
|
in the largest city |
within a radius of 100 km |
|||||
|
1 |
Arkhangelsk |
Russia |
348 343 |
600 463 |
11,0 |
0,8 |
|
2 |
Murmansk |
Russia |
292 465 |
458 329 |
8,4 |
0,2 |
|
3 |
Anchorage |
USA |
291 538 |
369 090 |
6,8 |
2,1 |
|
4 |
Oulu |
Finland |
202 586 |
357 567 |
6,6 |
1,9 |
|
5 |
Reykjavik |
Iceland |
128 793 |
268 090 |
4,9 |
4,7 |
|
6 |
Apatity |
Russia |
55 201 |
213 728 |
3,9 |
-1,0 |
|
7 |
Norilsk |
Russia |
180 976 |
202 378 |
3,7 |
-10,2 |
|
8 |
Luleå |
Sweden |
48 728 |
185 297 |
3,4 |
1,4 |
|
9 |
Umeå |
Sweden |
89 402 |
164 673 |
3,0 |
2,7 |
|
10 |
Noyabrsk |
Russia |
106 135 |
142 459 |
2,6 |
-5,0 |
|
11 |
Novy Urengoy |
Russia |
116 938 |
138 435 |
2,5 |
-7,4 |
|
12 |
Tromsø |
Norway |
40 471 |
132 545 |
2,4 |
2,2 |
|
13 |
Rovaniemi |
Finland |
53 361 |
107 862 |
2,0 |
0,5 |
|
14 |
Fairbanks |
USA |
31 516 |
99 671 |
1,8 |
-2,9 |
|
15 |
Bodø |
Norway |
41 720 |
96 612 |
1,8 |
4,6 |
|
16 |
Salekhard |
Russia |
50 064 |
93 473 |
1,7 |
-5,8 |
|
17 |
Vorkuta |
Russia |
54 223 |
74 339 |
1,4 |
-6,8 |
The forms of settlement in the Arctic are largely determined by the natural and climatic features of the territories. In all the largest centers of settlement in the foreign Arctic, except Fairbanks, the average annual temperature is positive. Only Russia has a unique experience of building large cities in an absolutely unfavorable zone in terms of natural conditions for the life of the population. More than 400 thousand people live in this zone, which includes Norilsk and Vorkuta. According to medical and geographical indicators, the optimal period of residence of the newcomer population here is estimated at 1–2 years. More than 1 million people live in a very unfavorable climatic zone of the Russian Arctic, for which the optimal life span is 2-3 years. Even in the most favorable parts of the Arctic “the probability of natural stress is high and additional investments are needed to maintain a normal life” [19, Vinogradova V.V., Zolotokrylin A.N., Krenke A.N., p. 115]. Another negative factor of residence is the fact that many of the cities of the Arctic, due to their specialization in the extractive industry, are leading in terms of environmental pollution and anthropogenic load: Zapoly-arny, Norilsk, Bilibino, etc. [39, Bityukova V.R., p. 39]. At the same time, due to their spatial position, such cities are important for maintaining the support frame of settlement, which may be required for future generations of people in the development and settlement of the Arctic territories [38, Fauzer V.V., Smirnov A.V., Lytkina T.S., Fauzer G.N.].
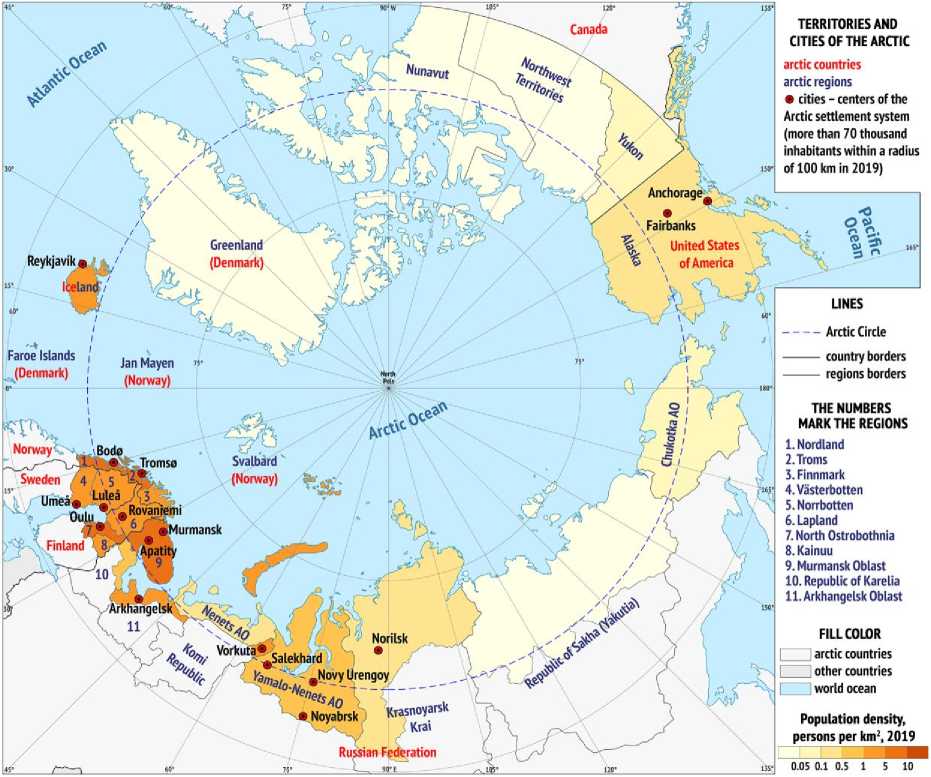
More than half (9 out of 17) of the largest settlement centers in the Arctic are located in a small area, including the north of Fennoscandia and the Arkhangelsk Oblast (Fig. 3). The same area is characterized by a high population density. However, even the presence of one or three large settlement centers makes the population density of huge regions relatively high (for example, the urban district of Vorkuta, the Yamalo-Nenets Autonomous Okrug, and Alaska). In Canada and Greenland, as well as in the eastern part of the Russian Arctic, there are no large centers of settlement. There is a high proportion of the indigenous peoples of the North, which is reflected in demographic indicators.
Canada
Nunavut
Anchorage*
Reykjavik e^
Norway^
Tromso lurmansk
Finland
Norilsk
Vorki
•ration
Jan Mayen (Norway)
Greenland (Denmark)
Svalbard (Norway)
Faroe Islands (Denmark)
Fairbanks
\ United States \ of America
- eNovy Urengoy
»й„к1 Krasnoyarsk o v
TERRITORIES AND CITIES OF THE ARCTIC arctic countries arctic regions
• cities - centers of the Arctic settlement system (more than 70 thousand inhabitants within a radius of 100 km in 2019)
LINES
----Arctic Circle
------country borders ------ regions borders
FILL COLOR arctic countries other countries world ocean
Population density, persons per km2,2019 .'. Z.^^H 0.05 0.1 0.5 1 5 10
THE NUMBERS MARK THE REGIONS
1. Nordland
2.Troms
3. Finnmark
4.Vasterbotten
5.Norrbotten
6. Lapland
7. North Ostrobothnia
8. Kainuu
9. Murmansk Oblast
10. Republic of Karelia
11, Arkhangelsk Oblast
Fig. 3. Population density and centers of the Arctic settlement system at the beginning of 2019.12
Compiled by the author.
In most centers of settlement during the 21st century, population growth is observed (tab. 4). This is especially true for the administrative centers of countries or large regions (Reykjavik, Anchorage, Salekhard) and university cities (Fairbanks, Umeå, Tromsø, Oulu). Their growth is mainly due to migration from other Arctic settlements. The extreme natural and climatic conditions at the present stage are not necessarily the cause of the migration outflow. Population growth is observed in Fairbanks, Salekhard and Novy Urengoy, although the climatic conditions are extremely unfavorable. The centers of settlement, where the greatest decline occurs, are characterized by late stages of the cycles of natural resource development (Vorkuta, Norilsk). Similar processes can be expected in the future and other cities of raw materials. In the Russian Arctic, the number of inhabitants is growing in only two out of eight settlement centers (Salekhard and Novy Urengoy), in the foreign - in all except the Finnish Rovaniemi.
Table 4
Change in the population of the largest centers of settlement in the Arctic (within a radius of up to 100 km from the centers), 2000-2019 13
|
Rang |
Settlement centers |
Country |
Population, thousand people |
Changes in 2000 (2002)–2019, % |
||
|
2000 (2002) г. |
2010 г. |
2019 г. |
||||
|
1 |
Reykjavik |
Iceland |
195,9 |
233,0 |
268,1 |
36,8 |
|
2 |
Anchorage |
USA |
308,6 |
360,5 |
369,1 |
19,6 |
|
3 |
Fairbanks |
USA |
83,6 |
98,2 |
99,7 |
19,2 |
|
4 |
Salekhard |
Russia |
80,9 |
85,6 |
93,5 |
15,6 |
|
5 |
Umeå |
Sweden |
144,1 |
152,6 |
164,7 |
14,3 |
|
6 |
Tromsø |
Norway |
116,5 |
122,8 |
132,5 |
13,8 |
|
7 |
Oulu |
Finland |
315,1 |
342,4 |
357,6 |
13,5 |
|
8 |
Novy Urengoy |
Russia |
125,0 |
125,3 |
138,4 |
10,7 |
|
9 |
Bodø |
Norway |
89,5 |
91,7 |
96,6 |
8,0 |
|
10 |
Luleå |
Sweden |
182,3 |
181,3 |
185,3 |
1,7 |
|
11 |
Noyabrsk |
Russia |
143,5 |
148,7 |
142,5 |
-0,7 |
|
12 |
Rovaniemi |
Finland |
143,8 |
140,1 |
137,0 |
-3,0 |
|
13 |
Arkhangelsk |
Russia |
628,2 |
613,2 |
600,5 |
-4,4 |
|
14 |
Murmansk |
Russia |
558,7 |
509,5 |
488,3 |
-12,7 |
|
15 |
Apatity |
Russia |
254,8 |
231,7 |
213,7 |
-16,1 |
|
16 |
Norilsk |
Russia |
246,2 |
198,0 |
202,4 |
-17,8 |
|
17 |
Vorkuta |
Russia |
132,4 |
95,3 |
74,3 |
-43,9 |
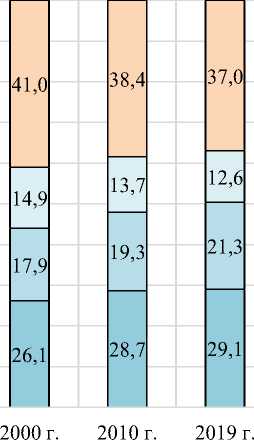
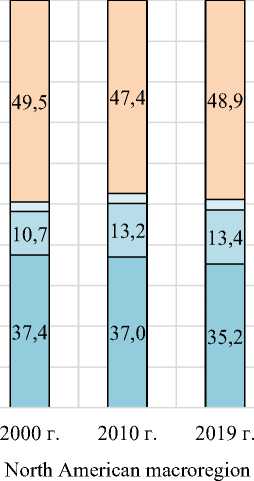
In both the Russian and Western European Arctic, the concentration of the population continues in the largest settlement centers (Fig. 4). It is especially strong in the most urbanized Russian
Calculated by the author. Data on Russia – 2002, 2010 and 2019, other countries – 2000, 2010 and 2019.
Arctic, where they account for 78.9% of the population. In dynamics, the decline in the number of settlements that do not belong to these centers in Western Europe is even more intense. There, the share of settlement centers in the population increased in the 21st century from 59.0 to 63.0%. The population is being drawn to some of the most developed cities in the economic, social and cultural spheres. The situation is somewhat different in the North American Arctic. Since a significant part of the population growth there is provided by the territories in which representatives of indigenous peoples live, and there are only two large centers of settlement in the North American Arctic (Anchorage and Fairbanks), the share of settlement centers in the population increased slightly (from 50.5 to 51.1% for the period 2000–2019), and after 2010 it even decreased.
s 80
й
• 2 60
cd
Оч 50
О Оч 5 40
cd
S 20
22,4
7,5
22,5
47,6
2002 г.
21,7
7,6
22,5
48,3
2010 г.
21,1
7,3
22,2
49,4
2019 г.
West European macroregion
Russian macroregion
-
□ the largest cities of the settlement centers □ settlements within a 50 km from the largest
-
□ settlements within a 50-100 km from the largest □ other arctic settlements
Fig. 4. Dynamics of the population size of the Arctic macroregions in terms of proximity to the largest settlement centers 14.
Demographic trends depend on the distance to the centers of settlement. So, the population of the centers themselves in the 21stI century increased in Russia and Western Europe, settlements within a radius of up to 50 km from the centers - in Western Europe and North America, settlements within a radius of 50-100 km from the centers - decreased in all three macro-regions of the Arctic. Thus, the processes of population concentration have different rates and manifestations in different parts of the Arctic, but in all macroregions the “forces of gravity” of settlement centers are not enough to maintain a stable demographic situation in a radius exceeding 50 km from the settlement centers.
The possibilities for further urbanization and population concentration are due to the prevailing forms of settlement, the differences between which are clearly visible on the night satellite im- ages of the Arctic territories (Fig. 5). The location of light points correlates with the population size and economic activity of the places. In the most remote resource centers of settlement (Norilsk, Novy Urengoy, Noyabrsk, and Vorkuta) more than 70% of the population is in the central city. This is a focal form of settlement, in which the territory does not have a high potential for a further increase in population due to adjacent settlements. On the other hand, Apatity, Luleå, Tromsø and Fairbanks, although they are the centers of settlement systems, include no more than a third of the inhabitants since they are characterized by a belt or even continuous settlement. There are opportunities here for even greater growth in the degree of urbanization of territories in the future.
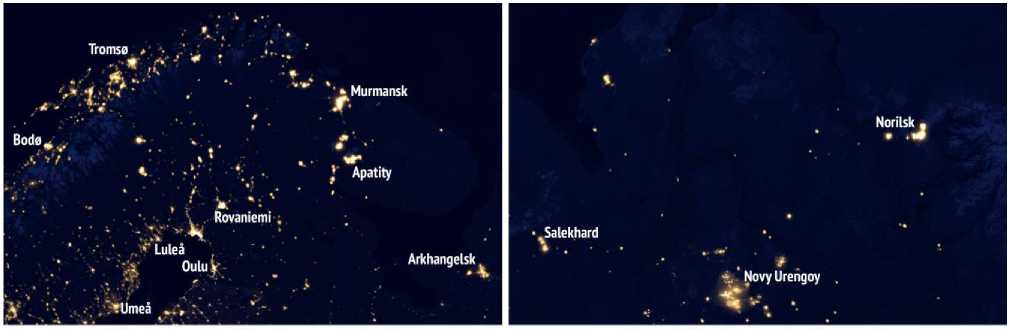
a) Western part of the European Arctic
b) West Siberian part of the Arctic

c) Part of the North American Arctic
d) Southern part of Greenland and Iceland
Fig. 5. Satellite night images of the Arctic settlements 15.
The identification of the largest centers of settlement in order to study changes in their population has shown its applicability as a tool for analyzing demographic dynamics in the Arctic. In the Arctic zone of Russia, settlement centers, due to the positive balance of migration within the regions, in most cases demonstrate a low migration outflow or even an increase. The exception is highly specialized resource cities of early development, which are unable to resist the decline in resource cycles. In the foreign Arctic, settlement centers are growing at an outstripping pace due to the advantages of a high population concentration - the agglomeration effect.
Conclusion
As shown, the population of the Arctic has specific characteristics and requires special approaches to the study. For the first time, based on the data of official statistics of the eight Arctic states, an estimate of the population of the Arctic in 1900–2019 is given in the context of all countries and macroregions (Russian, Western European and North American). It was found that the share of the Arctic in the world population reached its peak in the 1950s, after which it almost halved. The population of the global Arctic increased from 1.3 million in 1900 to 6.1 million in 1989, and then decreased to 5.4 million by 2019.The most large-scale reductions in the Arctic population are considered: in North America at the beginning of the 20th century, in Finland and Sweden in the 1960s and in Russia after 1989. Their reasons were the completion of the cycles of natural resource development and the insufficient quality of life in relation to the central and southern regions of the countries. It was revealed that throughout the entire period Russia was the leader in terms of population. Its specific gravity ranged from 22 to 58%. In the 20th - early 21st centuries interregional migration in the Arctic zone of Russia had a decisive influence on the dynamics of the population of the world Arctic.
Analysis of the population dynamics of the 17 largest centers of settlement in the Arctic, where about 68% of the population live, in 2000–2019, showed that urbanization and population concentration in the vicinity of the most attractive areas for life are still increasing in the global Arctic space. In this regard, a more detailed study of small towns and rural areas of the Arctic is necessary in order to determine the possibilities for them to achieve trajectories of sustainable demographic development in conditions when the largest cities and central regions serve as points of attraction for the population. The research results can be applied in the development of strategies and programs for the development of the northern and arctic territories. The estimates obtained can become the basis for constructing long-term forecasts of the demographic development of the Russian and world Arctic.
Acknowledgments and funding
The article was prepared within the framework of the research work “The population of the northern territories of Russia: the history of formation and development prospects” (No. GR AAAA-A19-119012190103-0, 2019–2021).
References The Arctic population: dynamics and centers of the settlement system
- Fauzer V.V., Smirnov A.V. Mirovaya Arktika: prirodnye resursy, rasselenie naseleniya, ekonomika [The World's Arctic: Natural Resources, Population Distribution, Economics]. Arktika: ekologiya i ekonomika [Arctic: Ecology and Economy], 2018, no. 3 (31), pp. 6–22. DOI: 10.25283/2223-4594-2018-3-6-22
- Zamyatina N.Yu., Pilyasov A.N. Novoe mezhdistsiplinarnoe nauchnoe napravlenie: arkticheskaya region-al'naya nauka [A New Interdisciplinary Area of Study: Arctic Regional Science]. Region: jekonomika i sociologija [Region: ekonomika i sotsiologiya], 2017, no. 3 (95), pp. 3–30. DOI: 10.15372/REG20170301
- Bogoyavlenskiy D., Siggner A. Arctic Demography. In: Arctic Human Development Report. Akureyri, Stef-ansson Arctic Institute, 2004, pp. 27–41.
- Heleniak T., Bogoyavlenskiy D. Arctic Populations and Migration. In: Arctic Human Development Report. Regional Processes and Global Linkages. Copenhagen, Nordic Council of Ministers, 2014, pp. 53–104. DOI: 10.6027/TN2014-567
- Hamilton L.C., Wirsing J., Saito K. Demographic Variation and Change in the Inuit Arctic. Environmental Research Letters, 2018, vol. 13 (11). DOI: 10.1088/1748-9326/aae7ef
- Shiklomanov N., Streletskiy D., Suter L., Orttung R., Zamyatina N. Dealing with the Bust in Vorkuta, Rus-sia. Land Use Policy, 2019, no. 103908. DOI: 10.1016/j.landusepol.2019.03.021
- Jungsberg L., Copus A., Nilsson K., Weber R. Demographic Change and Labour Market Challenges in Re-gions with Largescale Resource-Based Industries in the Northern Periphery and Arctic. Stockholm, Nor-dregio, 2018, 42 p.
- Teras J., Salenius V., Fagerlund L., Stanionyte L. Smart Specialisation in Sparsely Populated European Arc-tic Regions. Luxembourg, Joint Research Centre, 2018, 50 p. DOI: 10.2760/960929
- Piljasov A.N. I poslednie stanut pervymi: severnaya periferiya na puti k ekonomike znaniya [And the Last shall Be First: Northern Periphery on the Way to Knowledge Economy]. Moscow, Kn. dom “LIBROKOM”, 2009, 544 p.
- Petrov A. Creative Arctic: Towards Measuring Arctic’s Creative Capital. In: Arctic Yearbook 2014. Human Capital in the North. Akureyri, Northern Research Forum, 2014, pp. 149–166.
- Petrov A. Exploring the Arctic’s “Other Economies”: Knowledge, Creativity and the New Frontier. The Po-lar Journal, 2016, vol. 6, no. 1, pp. 51–68. DOI: 10.1080/2154896X.2016.1171007
- Smirnov A.V. Chelovecheskoe razvitie i perspektivy formirovaniya ekonomiki znaniy v rossiyskoy Arktike [Human Development and Prospects for the Knowledge Economy Formation]. Arktika: ekologiya i ekonomika [Arctic: Ecology and Economy], 2020, no. 2 (38), pp. 18–30. DOI: 10.25283/2223-4594-2020-2-18-30
- Zamyatina N.Yu., Pilyasov A.N. Kontsepciya blizosti: zarubezhnyy opyt i perspektivy primeneniya v Rossii [Concept of Proximity: Foreign Experience and Prospects of Application in Russia]. Izvestiya RAN. Seriya geograficheskaya, 2017, no. 3, pp. 8–21. DOI: 10.7868/S037324441703001X
- Scott A., Storper M. The Nature of Cities: The Scope and Limits of Urban Theory. International Journal of Urban and Regional Research, 2014, vol. 39 (1), pp. 1–15. DOI: 10.1111/1468-2427.12134
- Zamyatina N., Goncharov R. The Arctic Urbanization: How to Get Resilience in a Condition of Permanent Disaster? The 57th Congress of the European Regional Science Association: Social Progress for Resilient Regions. Groningen, 2017, 16 p.
- Huskey L. Challenges to Economic Development: Dimensions of “Remoteness” in the North. Polar Geog-raphy, 2005, vol. 29 (2), pp. 119–125. DOI: 10.1080/789610129
- Berman M., Lance H. Remoteness, Transportation Infrastructure, and Urban-Rural Population Move-ments in the Arctic. In: Proceedings of the International Conference on Urbanisation of the Arctic, Nuuk. Greenland, August 2012. Stockholm, Nordregio, 2012, pp. 108–122.
- Saxinger G., Petrov A., Krasnoshtanova N., Kuklina V., Carson D.A. Boom Back or Blow Back? Growth Strategies in Mono-Industrial Resource Towns — ‘East’ and ‘West’. In: Taylor A., Carson D.B., Ensign P.C., Huskey L., Rasmussen R.O., Sa G., eds. Settlements at the Edge. Edward Elgar Publishing, 2016, pp. 49–74. DOI: 10.4337/9781784711962
- Vinogradova V.V., Zolotokrylin A.N., Krenke A.N. Rayonirovanie territoriy Rossiyskoy Federatsii po pri-rodno-klimaticheskim usloviyam [Zoning of the Territory of the Russian Federation According to Natural and Climatic Conditions]. Izvestiya RAN. Seriya geograficheskaya, 2008, no. 5, pp. 106–117.
- Heleniak T. Migration in the Arctic. In: Arctic Yearbook 2014. Human Capital in the North. Akureyri, Northern Research Forum, 2014, pp. 82–104.
- Hamilton L.C., Saito K., Loring P.A., Lammers R.B. Climigration? Population and Climate Change in Arctic Alaska. Population and Environment, 2016, vol. 38 (2), pp. 115–133. DOI: 10.1007/s11111-016-0259-6
- Bird D., McLeman R., Gísladóttir G., Kelman I., Warg Næss M., Jóhannesdóttir G., Pétursdóttir G. Climate Change and Settlement Level Impacts. In: Taylor A., Carson D.B., Ensign P.C., Huskey L., Rasmussen R.O., Sa G., eds. Settlements at the Edge. Edward Elgar Publishing, 2016, pp. 293–319. DOI: 10.4337/9781784711962
- Pavlov P., Svendsen J.I., Indrelid S. Human Presence in the European Arctic Nearly 40,000 Years Ago. Na-ture, 2001, vol. 413 (6851), pp. 64–67. DOI: 10.1038/35092552
- Fauzer V.V., Smirnov A.V. Rossiyskaja Arktika: ot ostrogov k gorodskim aglomeratsiyam [The Russian Arc-tic: From Ostrogs to Urban Agglomerations]. ECO [ECO], 2018, no. 7, pp. 112–130. DOI: 10.30680/ECO0131-7652-2018-7-112-130
- Mikhalev N.A. Naselenie Yamala v pervoy polovine XX veka: Istoriko-demograficheskiy analiz [Population of Yamal in the First Half of the Twentieth Century: Historical and Demographic Analysis]. Yekaterinburg, UB RAS Publ., 2010, 195 p.
- Pumain D. Alternative Explanations of Hierarchical Differentiation in Urban Systems. In: Hierarchy in Natural and Social Sciences. Methodos Series. Netherlands, Springer, 2006, pp. 169–222. DOI:10.1007/1-4020-4127-6
- Lytkina T.S., Fauzer V.V. Gosudarstvennoe upravlenie prinuditel'noy migratsiey kak sposob osvoeniya Severa Rossii v 1930–1950-e gg. [Forced Migration as a Way of Russian North Development in the 1930s–1950s]. Zhurnal sotsiologii i sotsial'noy antropologii [The Journal of Sociology and Social Anthro-pology], 2016, no. 1, pp. 90–109.
- Fauzer V.V., Lytkina T.S. Migratsionnye protsessy na rossiyskom Severe [Migration Processes in the Rus-sian North]. Sotsial'naya politika i sotsiologiya [Social Policy and Sociology], 2017, no. 1 (120), pp. 141–149. DOI: 10.17922/2071-3665-2017-16-1-141-149
- Lytkina T.S., Smirnov A.V. Rossiyskiy Sever v usloviyakh global'noy neoliberal'noy politiki: preodolenie prostranstvennogo neravenstva ili vytesnenie? [The Russian North in the Context of Global Neoliberal Politics: Overcoming Spatial Inequality or Expulsion?]. Mir Rossii [Universe of Russia], 2019, no. 3, pp. 27–47. DOI: 10.17323/1811-038X-2019-28-3-27-47
- Lytkina T.S., Smirnov A.V. Vytesnenie na Rossiyskom Severe: migratsionnye processy i neoliberal'naya politika [Expulsions in the Russian North: Migration Processes and Neoliberal Policy]. Arktika i Sever [Arc-tic and North], 2019, no. 37, pp. 94–117. DOI: 10.17238/issn2221-2698.2019.37.94
- Zamyatina N., Yashunsky A. Migration Cycles, Social Capital and Networks. A New Way to Look at Arctic Mobility. In: New Mobilities and Social Changes in Russia’s Arctic Regions. London and New York, Routledge, 2017, pp. 59–84.
- Emelyanova A. Population Projections of the Arctic by Levels of Education. Working Paper. WP-17-022. Laxenburg, International Institute for Applied Systems Analysis, 2017, 41 p.
- Gassen N.S., Heleniak T. The Nordic Population 2040 — Analysis of Past and Future Demographic Trends. Stockholm, Nordregio, 2019, 52 p. DOI: 10.30689/R2019:6.1403-2503
- Heleniak T. The Future of the Arctic Populations. Polar Geography, 2020, pp. 1–17. DOI: 10.1080/1088937X.2019.1707316
- Fauzer V.V., Lytkina T.S., Fauzer G.N. Osobennosti rasseleniya naseleniya v Arkticheskoy zone Rossii [Fea-tures of Population Settlement in the Arctic Zone of Russia]. Arktika: ekologija i ekonomika [Arctic: Ecol-ogy and Economy], 2016, no. 2 (22), pp. 40–50.
- Blagodeteleva O.M. Evolyutsiya i sovremennye tendentsii razvitiya sistem rasseleniya v rayonakh Severa (na primere SShA, Kanady i Rossii) [Evolution and Current Trends of Development of Settlement Systems in the North Areas (on the Example of the USA, Canada and Russia)]. Urbanistika [Urban Development], 2017, no. 3, pp. 5–25. DOI: 10.15593/2409-5125/2017.03.01
- Dmitrieva T.E., Buryy O.V. Konceptsiya samodostatochnogo goroda v Arktike (primer g. Vorkuta) [The Self-Reliant Arctic City Concept (Vorkuta`s Pattern). Regional'nye issledovaniya [Regional Studies], 2017, no. 2 (56), pp. 33–43.
- Fauzer V.V., Smirnov A.V., Lytkina T.S., Fauzer G.N. Metodika opredeleniya opornykh poseleniy ros-siyskoy Arktiki [Methodology for Defining Pivotal Settlements in the Russian Arctic]. Ekonomicheskie i sotsialnye peremeny: fakty, tendentsii, prognoz [Economic and Social Changes: Facts, Trends, Forecast], 2019, vol. 12, no. 5, pp. 25–43. DOI: 10.15838/esc.2019.5.65.2
- Bityukova V.R. Ekologicheskiy reiting gorodov Rossii [Environmental Rating of Cities of Russia]. Ekologija i promyshlennost' Rossii [Ecology and Industry of Russia], 2015, vol. 19, no. 3, pp. 34–39.
