The current state and specifics of small business development in Russia

Author: Terebova Svetlana Viktorovna
Journal: Economic and Social Changes: Facts, Trends, Forecast @volnc-esc-en
Section: Branch-wise economy
Article in issue: 1 (49) т.10, 2017.
Free access
The formation of the small business sector is one of the most promising areas of the country's socio-economic development. In this regard, assessing formation dynamics and determining the problems and areas of development of the sector is of particular relevance. The purpose for the research is to analyze the current state and identify the peculiarities of small business development in Russia. To achieve this purpose the following statistical research methods have been used: data summary and grouping, calculation of integrative indicators (absolute, relative values), construction of dynamics series. The author also used general scientific methods such as generalization, induction, analysis and synthesis, etc. Based on statistical data with the use of these methods, the author analyzed tendencies of small businesses development in the context of indicators characterizing the dynamics of a number of small enterprises and their territorial distribution, sectoral structure, employment in the small business sector, enterprise financial and economic activity, their lending, etc...
Small business, entrepreneurship development, territory
Short address: https://sciup.org/147223905
IDR: 147223905 | UDC: 334.012.64
Text of the scientific article The current state and specifics of small business development in Russia
Small and medium business (SMB) is an integral part of modern economic system without which the economy and society cannot exist and develop1. The history of small business formation in Russia (within contemporary history) in comparison with the USA, the EU member states and some other countries is not a continuous process [26]. The beginning of formation of this sector dates back to the late 1980-s and is connected with the emergence of cooperatives and joint ventures. Reforms implemented in Russia, establishment of the basics of market relations became a condition of small and medium business development and its increased role in the economy. In the early 1990-s, state-owned enterprises were privatized; this process also affected small business. Redistribution of state property contributed to the expansion of entrepreneurship; at the same time, this period was the beginning of the development of “grey”economy in this sector. Heavy taxes prompted entrepreneurs to use “grey” schemes, “black” cash, doubleentry bookkeeping, etc. The economic collapse and political turmoil (1991–1993) led to the situation where a significant share of small businesses was refocused on commercial activity (trade). After 1993, there was a certain rise in small business development, the private sector of economy. For the first time, the legal basis of entrepreneurial activity begins to develop: Civil Code, Law “On noncommercial organizations”, etc. are adopted. During 1998–2001 new legislation is adopted introducing tougher requirements to small businesses, resulting in the strengthening of bureaucratic procedures, a more complicated process of business registration. Subsequently, government policy was aimed at expansion of support measures for small business. Since 2005, the Ministry of Economic Development has implemented the state financial support program for small and medium enterprises2. During 2005–2016, in the framework of this program about 160 billion rubles were allocated to regional budgets from the federal budget; the number of RF constituent entities participating in the program increased from 55 to 85. According to the results of the annual program audit [18], GDP growth per 1 ruble invested amounted to 39 rubles and was estimated at 607 billion rubles per year [4].
Despite a significant increase in state support for the sector under review, unstable tax policy continues to significantly hamper its development. Its contribution to the overall economic performance in Russia is less significant than in the EU member states, the USA and some developing countries (Tab. 1).
The basis of SMB sector by number of business units are individual entrepreneurs (53.3%) and micro-enterprises (41%) – 94.3% in total. These business units account for 55% of the employed in the sector under review [16]. 52% of turnover (revenue) of business units from sales of goods (works and services) is accounted for small (40%) and medium (12%) enterprises. In economy as a whole, the share of small and medium enterprises in total turnover of enterprises is, according to the Federal State Statistics Service, steadily decreasing. In 2014, it amounted to 20.2%, which is 6.2 percentage points less than in 2005 [16]. SMB accounts for only 5–6% of the total fixed assets and 5% of the total investment in fixed assets nationwide [36].
Table 1. Scale of small business development in foreign countries and in Russia [36]
|
Country |
Number of small enterprises (including micro-enterprises), mln units |
Ratio of small businesses per 1000 citizens |
Number of economically active people, mln people |
Number of employed in small business, % |
|
USA |
27 |
86 |
158.9 |
61 |
|
UK |
5.2 |
81 |
32.8 |
50 |
|
Germany |
2.1 |
26 |
41.9 |
42 |
|
France |
2.4 |
38 |
30.2 |
47 |
|
China |
15 |
11 |
793.3 |
69.7 |
|
Russia |
2.1 |
14 |
77 |
21.4 |
2 The procedure for providing regional budgets with funds from the federal budget on a competitive basis in the form of subsidies is established by Government Decision no. 178 “On distribution and provision of regional budgets with subsidies from the federal budget for state support for small and medium business including private farms”, dated February 27th, 2009.
3 Excluding external part-timers.
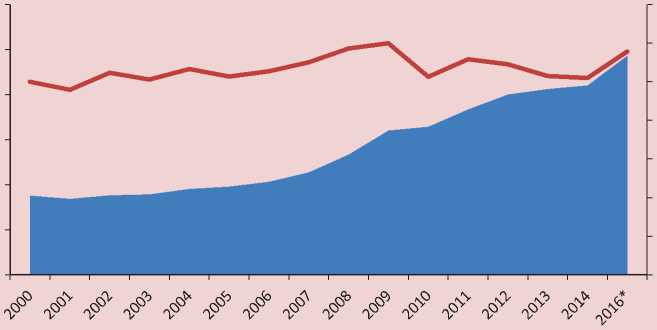
Figure 1. Trend in the number of small enterprises (including micro-enterprises) [8, 36]
120.0
100.0
60.0
20.0
0.0
80.0
40.0
^^M Number of small enterprises, thousand units ^^^* Growth rate of small enterprises, %
140.0
* As of 10.09.2016
Source: compiled from data of the Federal State Statistics Service, Federal Tax Service.
In 2005, the share of the employed in SMB3 increased from 10.7 percentage points and amounted to 23.6% in 2014 [36]. At the same time, labor productivity in the sector, according to the Ministry of Economic Development of the Russian Federation, is 2–3 times below the level of developed countries (the USA, Japan, the EU).
Territorial distribution of small and medium enterprises
Due to targeted state support, over the past 15 years the number of small enterprises in the country increased more than 2 times (Fig. 1). However, it should be noted that the increase was ensured mainly by the segment of micro- enterprises42 (they have been recorded in statistical accounting since 2008), while the number of small companies during 2008– 2016 decreased (16.7%).
In 2008, among small enterprises medium enterprises were distinguished but their share in the total number of small and medium enterprises was insignificant – 0.3%. Consistent with the logic, the authors add that medium businesses are formed from small because the transition from small to large business should be considered as an evolutionary process. However, small businesses do not have incentives to become medium. With transition to a new level small businesses lose their rights for various incentives (tax benefits, administrative benefits, possibility of obtaining state support, etc.), that is why it is easier for such enterprises to artificially divide into a few new ones than to move into the category of medium enterprises.
The trend in the number of small businesses reflected in the statistics is influenced by peculiarities of statistical accounting. For example, even if a firm exceeded the limit on the number of employees or amount of income, it is still considered small within the next three years5.
Table 2. Top 10 constituent entities of the Russian Federation by basic indicators characterizing small* business development, 2014**
|
Share of average number of employees (excluding external part-timers) employed in small business, % |
Share of number of small enterprises, % |
||||||
|
Moscow |
13.3 |
Moscow |
19.7 |
||||
|
Saint-Petersburg |
5.8 |
Saint-Petersburg |
8.3 |
||||
|
Moscow Oblast |
4.4 |
Moscow Oblast |
4.9 |
||||
|
Sverdlovsk Oblast |
3.5 |
Sverdlovsk Oblast |
3.4 |
||||
|
Krasnodar Krai |
3.1 |
44.3% |
Krasnodar Krai |
2.8 |
51.7% |
||
|
Republic of Tatarstan |
3.1 |
Republic of Tatarstan |
2.7 |
||||
|
Republic of Bashkortostan |
2.8 |
Nizhny Novgorod Oblast |
2.6 |
||||
|
Novosibirsk Oblast |
2.7 |
Samara Oblast |
2.5 |
||||
|
Rostov Oblast |
2.4 |
Novosibirsk Oblast |
2.5 |
||||
|
Nizhny Novgorod Oblast |
3.2 |
Chelyabinsk Oblast |
2.3 |
||||
|
Share in the turnover in small business sector, % |
Share in investment in fixed assets in small business sector, % |
||||||
|
Moscow |
20.5 |
Krasnodar Krai |
5.6 |
||||
|
Saint-Petersburg |
5.7 |
Nizhny Novgorod Oblast |
4.9 |
||||
|
Moscow Oblast |
4.9 |
Moscow Oblast |
4.7 |
||||
|
Krasnodar Krai |
3.8 |
Voronezh Oblast |
4.7 |
||||
|
Sverdlovsk Oblast |
3.7 |
52.7% |
Republic of Bashkortostan |
3.9 |
40.2% |
||
|
Nizhny Novgorod Oblast |
3.2 |
Rostov Oblast |
3.6 |
||||
|
Tyumen Oblast |
2.8 |
Altai Krai |
3.5 |
||||
|
Republic of Tatarstan |
2.8 |
Penza Oblast |
3.4 |
||||
|
Rostov Oblast |
2.7 |
Novosibirsk Oblast |
3.2 |
||||
|
Novosibirsk Oblast |
2.6 |
Kemerovo Oblast |
2.7 |
||||
|
* Including micro-enterprises. **Calculated on the basis of statistics of the Federal State Statistics Service [36]. |
|||||||
5 It means that if an enterprise exceeded the limit in 2014, it will lose its status as a small enterprise only in January 1st 2017. Previously, this period amounted to 2 years. The amendment was introduced by Federal Law no. 156-FZ, dated June 29th, 2015.
A significant drawback of small entrepreneurship development in Russia is its high territorial concentration. 52% of small enterprises is concentrated within 10 Russian regions (12% of all regions), the trend towards their concentration in a small number of regions and federal districts remains and is even increased in some regions (Tab. 2) .
In the context of federal districts (FD) the situation is as follows. The leader is the Central FD, where at the beginning of August 2016 36.6% of the total number of small enterprises of Russia were registered; in the Volga FD – 18.5%; in the North-Western FD – 13.3%; in the Siberian FD – 10.6%; in the Ural FD – 8.2%; in the Southern FD – 6.7%. The share of the Far Eastern FD is 3.7%, the North Caucasian FD – 1.7%, the Crimean FD – 0.7%. It should be taken into account that the size structure of business entities is influenced by sectoral specialization of economies of the regions and districts63.
In the framework of federal districts the enterprises are also distributed unevenly. The drivers of the Central FD are the city of
-
6 For example, low percentage of small business concentration in the Ural FD is the result of the District’s sectoral composition of the economy, with the 20% concentration of the all-Russian production (production of aluminum, metallurgy, oil and gas, etc.). These industries are capital- and energy intensive, aimed at the result from the scale.
Moscow and the Moscow Oblast, where about a quarter of all small enterprises in Russia is concentrated (24.6%), which is 70% of small businesses in the District. In the Volga FD, the distribution of small businesses is more uniform, although there us a noticeable concentration of more than 50% of all district’s small enterprises only in four regions: Tatarstan, Bashkortostan, the Nizhny Novgorod and Samara oblasts. In the North-Western FD, there is also a high concentration of small businesses in the city of Saint-Petersburg (more than 60% of the total number of small enterprises in the District), etc.
Consequently, analysis demonstrates uneven distribution of small enterprises throughout the territory of Russia. This unevenness is increased at the level of constituent entities of the Russian Federation. Thus, at the beginning of 2016, the number of small enterprises per 100 thousand inhabitants ranged from 374.6 units (Saint-Petersburg) to 7.6 units (Chechen Republic) [6].
As a result of territorial concentration, 10 constituent entities concentrate 44.3% of the employed in small business in the country, 52.7% of turnover and 40.2% of investments in fixed assets of the sector ( Tab. 2 ). Thus, the dynamics of the small business sector in the country actually depends on its condition in the leading regions.
Sectoral composition of small business
The current sectoral composition of small business is a serious concern. Since the beginning of 2015, enterprises by industry are distributed as follows:
-
• industry – 10.5% (for comparison: in 2000 – 15.3% [17]);
-
• construction – 11.9% (14.4%);
-
• agriculture – 2.7% (1.6%);
-
• transport and communication – 2.1% (2.6%);
-
• the remaining 68.1% are industries not related or indirectly related to material production (65.5%).
Thus, there were no significant changes in the distribution of small enterprises by type of activity over the past 15 years: trade and real estate remain the leaders, in total, they amount to more than 50%. The attractiveness of this sector is primarily explained by low costs and high capital turnover. Unlike manufacturing and construction, which are difficult to transfer to “grey” economy, the leading industries of small business can quite easily become “grey”7. It is necessary to introduce target measures form authorities and management for small business to “returned” to formal economy and become one of the “pillars” of the state. According to expert estimates, only by creating conditions for “releasing” small enterprises, i.e. improving the business environment8, it is possible to increase the share of small business in GDP from 19% to 40–50% [14], which corresponds to the indicators of the leading countries.
It should also be noted that VAT tax administration does not stimulate the reduction in structural imbalances in the economy. The main VAT loading falls on competitive productions. Thus, the average VAT tax burden for manufacturing96 in 2010–2014 was 4%, for mining enterprises – 2.2%, for financing – 0.3%. The profit-making capacity of manufacturing is 1.4 times lower than that of mining, and 3.1 lower than that of financing [10].
When reviewing the sectoral composition of the SMB sector, it should be noted that as the company expands, its specialization is changing towards more complex activities. Thus, among medium enterprises the share of enterprises operating in the industrial sector is significantly higher than industrywide (28.5% of medium enterprises against 10.5%) [16].
Figure 2. Employees dynamics (excluding external part-timers) at small enterprises (including micro-enterprises)*
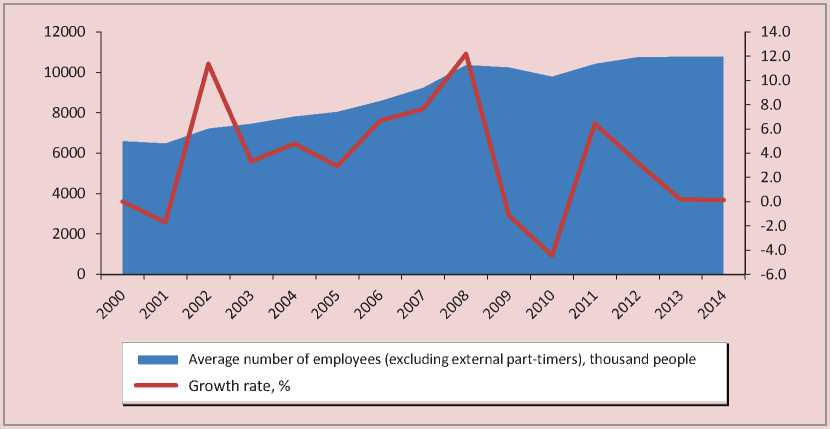
* Compiled from data of the Federal State Statistics Service [36].
Employment in the SMB sector
During 2000–2014, the number of the employed107 in small enterprises increased by almost 4.2 million people, while the total number of the employed in the economy grew by 6.5 million. [29] ( Fig. 2 ). Consequently, the total employment gain is by more than a half ensured by the increased number of workplaces in small business.
In 2000–2008, the number of employees at small enterprises increased. However, from 2008 to 2010 it decreased by 6%, which is more than 576 thousand. One of the reasons for such a reduction is the financial and economic crisis which began in September
2008 and resulted in the increased prices and reducing demand for companies’ products/ services. The policy of tax authorities on small businesses did not change [26]. In 2010, after leveling the impacts of the crisis, the number of employed in the SMB sector began to grow, though slower than before the crisis. In 2011, it reached the level of 2008.
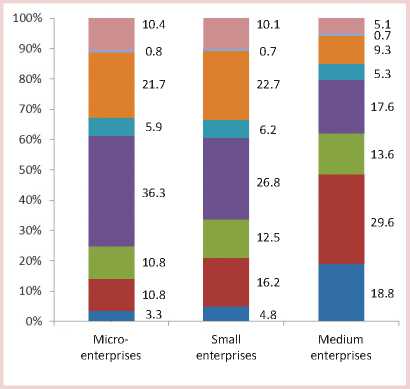
The distribution of the employed by industry corresponds to the structure of the sector: the largest number of workers at small and micro-enterprises is concentrated in trade (29.1% and 36.5% respectively) and real estate (20.8%) ( Fig. 3 ). The greatest number of the employed at medium enterprises is concentrated in manufacturing (34%).
10 Excluding external part-timers.
100%
* Compiled from data of the Federal State Statistics Service [16].
Figure 3. Distribution of the average number of employed in different categories of SMB in 2010 and 2014*
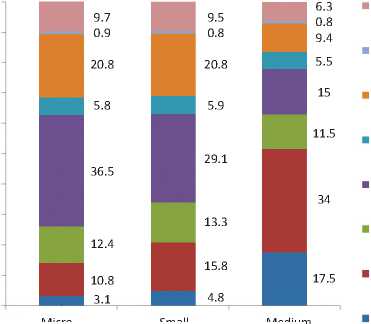
Other activities
Trade
Construction
Manufacturing
Agriculture
Transport and communication
Scientific research and developments
Real estate operations, lease and services
Medium enterprises
Microenterprises
Small enterprises
The average monthly wage of employees in 2014 amounted to 15.7 thousand rubles at micro-enterprises, at small and medium enterprises – 19.2 and 26.1 thousand rubles respectively. At the same time, this figure by full range of organizations in the economy of the Russian Federation amounted to 32 495 rubles [33]. Thus, the average monthly wage of an employee at a small enterprise was only 60% of the national average. In the authors’ opinion, this can be explained by salary payment “in envelopes”, as well as by small turnover of SMBs compared to large businesses.
Enterprise economic and financial activity
In general, it should be noted that the gradual economic slowdown and consumer demand in particular, which took place in 2012–2013 and significantly exacerbated in 2014 amid the imposed sanctions of a number of countries, affected the financial and economic activity of the SMB sector. It was most seriously undermined by December crisis in the foreign exchange market, which forced the CBR to sharply increase its key rate (up to 17%), which immediately resulted in higher bank loans. The result was a reduction in the volume of SMB lending portfolio by
0.9% in 2014; the reduction continued until the first quarter of 2 and reached 5.4% in three months. This reflected in the SMB turnover which in 2014, compared to 2013, declined by 4.6%118 and in 2015 by 8.5% compared to 2014 [6]. In the industry breakdown the main turnover of SMBs is concentrated in trade: 46.4% of medium enterprises, 58.3% of small and 60.5% of micro-enterprises [16].
Investment in fixed capital at small enterprises nationwide considering CPI in 2014 increased by 8.4% compared to 2013, but in 2015 it decreased by 15.6% compared to 2014 [6]. The distribution of investments in fixed assets of different SMB categories by type of economic activity differs markedly from the distribution of the number of different SMB categories, the number of the employed and the turnover by type of economic activity. Thus, the largest volume of investments in 2014 was allocated by micro- and small construction enterprises – 31.7% and 30.6% of total investment by business category [16], real estate transactions – 30.3% and 24%, agriculture – 26.7% and 17.6%. A quarter of investment from medium enterprises is concentrated in real estate (25.6%), in agriculture –22.6%, in manufacturing – 20.1%, and only 8.8%, 10.4% and 5.9% respectively in trade which creates the major part of turnover and provides employment.
Analysis of investment activity of small enterprises shows that the main purpose for investing in fixed assets is replacement of worn out machinery and equipment, increase in production capacity, as well as automation and mechanization of the production process. Only 5% of enterprises129 invested in the introduction of new production technologies.
The factor limiting investment activity of small businesses is low profitability of their business. Thus, in 2014 the profitability of the sold goods, products (works, services) amounted to 5.4%10, which is 2 percentage points more than in 2010 ( Tab. 3 ). To improve the profitability of products it is possible to reduce their cost and increase sales. However, investments aimed at cost reduction were made only by 8% of enterprises [16].
The highest value of the indicator of profitability of sales in Russia in 2014 is characteristic of small enterprises operating in fish farming and fishery (26.9%), education (15.8%) and real estate (12.9%).
However, the return on total assets of small enterprises equaled 18% which corresponds to level of 2010 and is by 0.7 percentage points less than in 2012. A significant shortfall between the interest rates on long-term loans
Table 3. Financial indicators of small businesses operating in the territory of the Russian Federation
|
Indicator |
Year |
Changes (6) compared to (2), % |
||||
|
2010 |
2011 |
2012 |
2013 |
2014 |
||
|
1 |
2 |
3 |
4 |
5 |
6 |
|
|
Number of profitable small enterprises, thousand units |
416.8 |
402.6 |
496 |
1082.1 |
1220 |
В 3 р. |
|
Share of profitable small enterprises in the total number of enterprises, % |
79.3 |
81.3 |
82.3 |
80.5 |
79.7 |
0.4 |
|
Total income earned by small enterprises, billion rubles |
868.4 |
776.8 |
1256.2 |
2093.2 |
2548.6 |
В 3 р. |
|
Share of unprofitable small enterprises, thousand units |
108.6 |
92.8 |
106.7 |
262.8 |
310.3 |
В 2.9 р. |
|
Share of unprofitable enterprises in the total number of enterprises, % |
20.7 |
18.7 |
17.7 |
19.5 |
20.3 |
-0.4 |
|
Total loss of small enterprises, billion rubles |
332.4 |
302.6 |
306 |
656.2 |
1337.7 |
В 4 р. |
|
Profitability of the sold goods, products (works, services), % |
3.4 |
3.7 |
3.7 |
5.3 |
5.4 |
2 |
|
Return on total assets, % |
1.8 |
1.5 |
2.5 |
1.1 |
1.8 |
0 |
|
Current liquidity ratio |
109.4 |
130.4 |
111.9 |
295.8 |
173.3 |
63.9 |
|
Equity to total assets |
50.5 |
49.0 |
46.4 |
14.9 |
28.5 |
-22 |
|
Source: compiled from data of the Federal State Statistics Service [16]. |
||||||
and the value of return on assets indicates the poor state of small businesses.
During the period under review, the maximum share of unprofitable businesses was recorded in 2010 – 20.7%, in 2011–2012 it decreased to 17.7%, but by 2014, under the influence of adverse macro-economic environment the index returned to the level of 20.3%.
The total loss of small businesses over five years (2010–2014) amounted to 2934.8 billion rubles – the figure increased four times14. In 2010–2011, total income exceeded total loss 2.5 times, in 2012 – 4.1 times, in 2014 – 1.9 times. One of the reasons which caused the increase in losses is the companies’ willingness to minimize taxes in difficult economic conditions. In addition, financial loss, even during several years, may be associated with the development of production, but in this case indicators of capital investment, investment in long-term assets and deferred expenses are supposed to grow as well [37].
For the past five years, the value of equity to total assets has demonstrated e negative trend. Changes in the indicator observed during 2012–2014 indicate the weakening financial viability of small businesses, their instability and dependence on external creditors, the reducing guarantee of repayment and the limitation of access to credit resources.
Table 4. Volume of loans granted to resident entities and individual entrepreneurs in 2009-2016 , rubles *, (in current prices)
|
Year |
Volume of loans granted to resident entities and individual entrepreneurs (as of January 1st, next year), mln rubles |
Including volume of loans granted to small and medium businesses (excluding individual entrepreneurs), as of January 1st, mln rubles |
Share of loans granted to to small and medium businesses (excluding individual entrepreneurs) in the total volume of loans granted to resident entities, % |
|
2009 |
15759273 |
2622563 |
16.6 |
|
2010 |
17966469 |
4039836 |
22.5 |
|
2011 |
25436234 |
5301857 |
20.8 |
|
2012 |
27531130 |
6115976 |
22.2 |
|
2013 |
31582836 |
7073508 |
22.4 |
|
2014 |
33241362 |
6615201 |
19.9 |
|
2015 |
29995671 |
4773526 |
15.9 |
|
2016 |
16808251** |
2584044** |
15.4 |
|
* Based on data on state-owned corporation “Bank for Development and Foreign Economic Affairs (Vnesheconombank)”. ** Data for August 1st, 2016. Source: compiled from data of official website of the Central Bank [21, 22]. |
|||
Analysis of dynamics of the current liquidity ratio helps make a conclusion that in 2014 it was greater than unity not in all industries15. Its average nationwide value for small businesses equaled 173.3%, which is above the 2010 level by 63.9 percentage points, but lower than in 2013 by 122.5 p.p. In 2013, the figure was 295.8%, which was in line with international standards.
Amid average profitability of sales at small enterprises being less than 6%, the growth of capital investments in business only by 8.4% and a 22 percentage point decrease in equity to total assets, one may speak about the increasing dependence of small enterprises on short-term loans. At the same time, the problem of availability of borrowed financial resources is relevant throughout the whole businesses’ lifecycle. More stringent monetary policy during the crisis and the growing uncertainty in the economy restricted access to debt financing for these entities. The Central Bank statistics indicates the slowdown in small business credit (Tab. 4).
The cost of SMB loans reduced following the key rate ( Fig. 4 ). Thus, after a gradual decline during 2015, in the first half of 2016, the rates for SMB were stable and amounted to 16.2–16.6% for short-term and 15.9– 16.4% for medium - and long-term loans ( Fig. 5 ). However, the level of interest rates for SMB remains very high due to the fact that the Central Bank lent commercial banks at 12.5%
Figure 4. Dynamics of weighted average interest rates on loans granted to small and medium enterprises in rubles (excluding Sberbank PJSC) in 2015–2016, % [31]
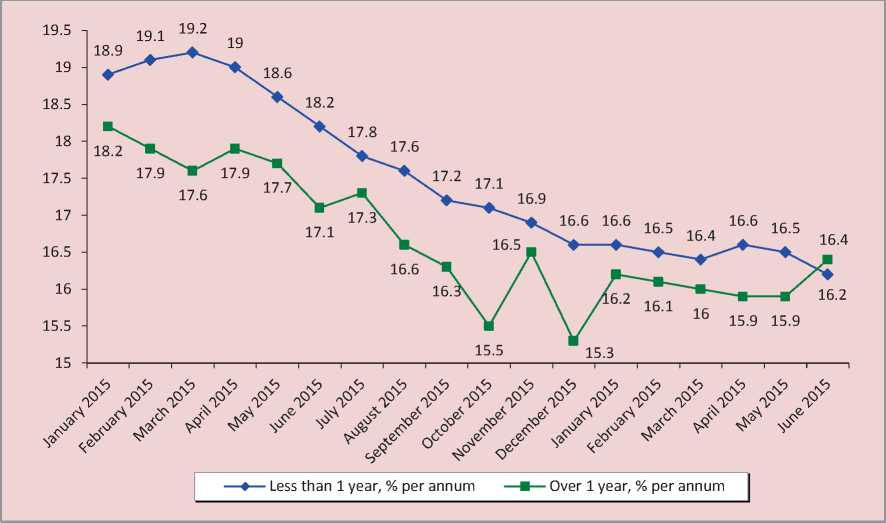
Figure 5. Dynamics of the key rate of the Central Bank of the Russian Federation [25]
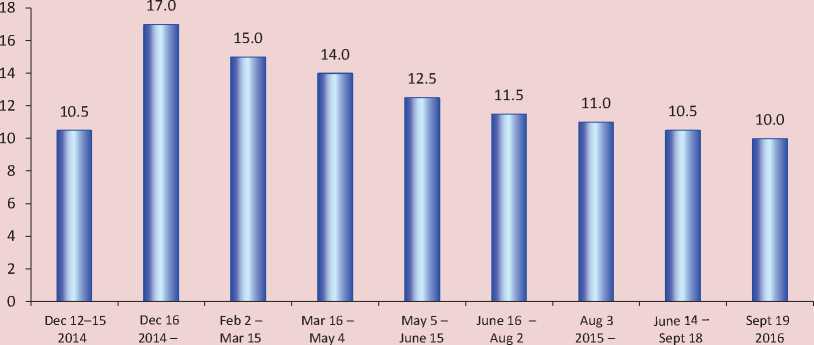
Feb 1 2015 2015 2015 2015 June 13 2016
2015 2016
Source: compiled from data of SME Bank, the Central Bank of the Russian Federation.
(as of May 2015; starting September19th, 2016, the rate is reduced to 10% [39]). The latter, adding their bank margin lend business units. For comparison: in the USA the key rate is at 0.25%, in the UK – 0.5%, in Japan – 0.1%, in Norway – 1.25%, in Australia – 2.5% [20, 23].
The factors hindering the expansion of SMB lending are: negative dynamics of the above mentioned indicators characterizing financial and economic activity of small enterprises; mismatch between profitability of projects and interest rates; lack of liquid assets; limited collateral capacity etc., resulting in high credit risks. The reluctance of banking institutions to grant loans to SMBs is explained by the growth of debt on earlier loans [9]. Thus, during 2009–2013 there was an annual decline in debt arrears; however, in 2014 an inverse trend took place. The largest increase in debt arrears was in 2015, when its volume at year-end increased by 69% compared to the beginning of the year16.
State financial support and other forms of state stimulation amid insufficient access to credit and other alternative financial resources may compensate for their deficit in the economic segment under review. Government support should be aimed at ensuring equal competitive conditions. Therefore, it is important to use the existing mechanisms without creating new ones [2].
The study and generalization of small business development trends in 2000–2016 helps conclude that there is a quantitative increase in the number of indicators in small business amid absence of qualitative development. Moreover, the increase in the turnover of small businesses and in the number of the employed in this economic sector is caused solely by the increase in the number of business entities and, therefore has no independent value. However, the structure of small business is characterized by low diversification: the basic share is presented by trade and services; the share of manufacturing has declined. In addition, during the period under review, the wages of employees at small enterprises remain low and do not reach the national average level. It should be emphasized that the potential of small business is not being fully utilized for territory development.
As should be noted, major influence of macro-economic factors on financial and economic situation in small business results in the deterioration of the relevant enterprises’ indicators. Thus, their performance in 2015 in the regional context can be considered as negative. In 37 regions, the number of registered small businesses1714 has decreased; in 61 regions, there is a decrease in the average number of the employed at small enterprises; turnover1815 decreased in 76
regions; investments in fixed assets1916 declined in 60 regions [6].
Thus, on the one hand, small business is mobile, responsive to changes in functioning conditions; on the other hand, it is dependent on market conditions, dynamics of socioeconomic and political conditions – external environmental factors.
External factors of small enterprise development
The influence of external factors on small business development is substantiated and proved in the works of domestic and foreign scientists [1, 3, 5, 15, 30, 35, 38, 40, 41, 42, 44, 48]. The present study [28] also confirms the significant dependence of small business development on environmental factors.
Analysis of external environment of small business development can be carried out based on the results of various international monitorings of entrepreneurship development, indices and monitorings of Russian business associations, as well as data of expert organizations: Global Entrepreneurship Monitor (GEM) [47]; Business Operations [45]; State of Business Environment and Enterprise Performance [43]; Index “OPORA Rossii” [11]; RSPP Business Environment Index [12]; the SME Bank Index of Quality of Conditions for Small and Medium Business [13]; Surveys of SMBs conducted by the autonomous non-profit organization “National Institute for System Studies of Entrepreneurship” [19], etc.
Although all these studies focus their attention on different aspects of activities, industry groups and SMB operation areas, generalization of results indicates the presence of the following key factors having a negative impact on small business development.
Instable legislation in SMB taxation. On the one hand, experts note the simpler taxation for companies, in particular: the number of payments in 2016 compared to 2006 decreased from 12 to 7; the average consumed time (hours per year) – from 168 to 448, and total tax rate as a percentage of profit fell from 60% to 47.1% ( Tab. 5 ).
On the other hand, the recent regulatory legal acts have aggravated the financial situation in the sector20.
Many entrepreneurs say that business planning is complicated given the unpredictability of changes in measures of
Table 5. Change in the procedure of taxation in Russia in 2006, 2016 [46]
|
Criterion |
Russia |
Europe and Central Asia |
OECD |
||
|
2006 |
2016 |
Δ 2016 to 2006 |
2016 |
||
|
Payments, numbers a year |
12 |
7 |
-5 |
19.2 |
11.1 |
|
Time spent on report preparation and submission, tax payment (deduction), hours a year |
448 |
168 |
-280 |
232.7 |
176.6 |
|
Total tax rate*, % of income |
60 |
47.1 |
-12.9 |
34.8 |
41.2 |
|
Income tax, % of income |
- |
8.9 |
- |
10.8 |
14.9 |
|
Salary taxes and payments, % of income |
- |
35.6 |
- |
20.4 |
24.1 |
|
Other taxes, % of income |
- |
2.6 |
- |
3.1 |
1.7 |
* Total tax rate shows the amount of tax and mandatory deductions which an enterprise is obliged to pay for the second operating year and is expressed as a share of its operating profit.
state fiscal policy even in the short term. Ultimately, this situation leads to the increase in employment in the informal sector of economy. According to Rosstat, from January to June 2013 (after the adoption of Federal law “On amendments to certain legislative acts on mandatory pension insurance”) the number of the employed in the informal sector increased by 13%. All in all, in 2013, the number of the employed in the informal sector accounted for 14.7 million people, which is 19.4% of the total economically active population.
Another key issue for SMB is difficult access to sources of funding. Despite a number of financial support program for small and medium enterprises implemented by the Ministry of Economic Development, institutions for development and other establishments the situation remains difficult.
Enterprises identify lack of own financial resources as a key factor limiting investment activity (52% of the surveyed enterprises) [16]; there is also high interest rate on commercial loans (29%) and the complex mechanism for obtaining loans for the implementation of investment projects (16%). It should be noted that this situation is largely a consequence of the general situation on financial markets.
Despite the fact that in recent years measures are being taken, primarily within the framework of the National Entrepreneurial Initiative [24], the high level of administrative barriers remains , as evidenced by the “Opora Rissii” research, data from the report of the Entrepreneur Protection Commissioner for the President of the Russian Federation [7].
According to ISEDT RAS surveys, the greatest difficulties of entrepreneurs
Table 6. Distribution of answers to the question
“Which of the following spheres of administrative regulation are the most difficult?”, % of respondents (respondents could choose several answers)
According to entrepreneurs, the most effective measures of eliminating administrative barriers and improving the situation are: reduction in requirements where possible (38%21), development of clear and streamlined procedures and algorithms for interaction of business and administrative and regulatory institutions (35%), transition from the permissive registration procedure to notification procedures (21%), reduction in the number of licensed activities (20%).
The main factors limiting production growth at small enterprises also include: 1) problems in finding markets for products due to impossibility of competition with large enterprises and difficult access to government contracts and procurement for natural monopolies, difficulty of foreign market entries; 2) economic uncertainty; 3) lack of own financial resources; 4) issues of human resourcing (access to labor resources with required qualifications); 5) issue of availability of land, real estate, etc.
Based on the selected issues of SMB development, the authors distinguish the main areas of sector support:
– improvement of strategic and tactical aspects of small and medium business development management, including objective evaluation of regulatory impact amid adoption of acts on taxation, amid adjustment of regulatory legal acts imposing additional financial burden on SMBs and introduction of mechanisms to guarantee stable conditions for development, etc.;
– development of a system of analysis of small and medium business degree of development and the effectiveness of the applied measures;
– implementation of financial support for SMB, which may have a multiplier effect; it is necessary to continue developing mechanisms such as micro-finance, factoring, leasing;
– reduction in unjustified administrative barriers (it is necessary to develop a system of evaluation of the actual impact of regulatory legal acts on business activity);
– improvement of mechanisms providing small businesses with the necessary resources;
– development of elements of small and medium business infrastructure support;
– improvement of efficiency of the system of public procurement, natural monopolies procurement and companies with participation of the state;
– expansion of support measures of export oriented SMBs;
– encouraging people to engage in entrepreneurship.
The implementation of complex measures in the framework of these areas will help achieve target indicators set in the Strategy of small and medium business development in the Russian Federation for the period up to 203022 [32] and, as a result, fully use the potential of small businesses for territory development by increasing its contribution to GDP from 20% to 40%, which will correspond to the level of developed countries.
References The current state and specifics of small business development in Russia
- Basareva V.G. Institutsional'nye osobennosti razvitiya malogo biznesa v regionakh Rossii . Available at: http://www.eerc.ru/default/download/creater/working_papers/file/19374bce1732702a9ed47f3b01b5679475a571c4.pdf..
- Borisov V.N., Budanov I.A., Moiseev A.K., Panfilov V.S. Neobkhodimye usloviya modernizatsii rossiiskoi obrabatyvayushchei promyshlennosti na primere tyazhelogo mashinostroeniya . Problemy prognozirovaniya , 2012, no. 1, pp. 20-38..
- Gerchikova I.N. Menedzhment: uchebnik . 3rd edition, revised and updated. Moscow: YuNITI, 2003. 501 p..
- Gosudarstvennaya podderzhka malogo i srednego predprinimatel'stva v 2016 g. . Ministerstvo ekonomicheskogo razvitiya RF . Available at: http://economy.gov.ru..
- Gulin K.A., Khamidulina E.A. Problemy i perspektivy razvitiya malogo predprinimatel'stva . Vologda: VNKTs TsEMI RAN, 2005. 76 p..
- Dinamika razvitiya malogo predprinimatel'stva v regionakh Rossii v 2015 g.: ezhekvartal'nyi informatsionno-analiticheskii doklad . Moscow: Natsional'nyi institut sistemnykh issledovanii problem predprinimatel'stva, 2016. 32 p..
- Doklad Prezidentu RF Upolnomochennogo pri Prezidente RF po zashchite prav predprinimatelei . Available at: http://doklad.ombudsmanbiz.ru/..
- Edinyi reestr sub"ektov malogo i srednego predprinimatel'stva . Available at: https://rmsp.nalog.ru/statistics.html..
- Zadolzhennost', v tom chisle prosrochennaya, po kreditam, predostavlennym sub"ektam malogo i srednego predprinimatel'stva v rublyakh, inostrannoi valyute i dragotsennykh metallakh . Available at: http://www.cbr.ru/statistics/UDStat.aspx?TblID=302-19&pid=sors&sid=ITM_3703..
- Ilyin V.A. Ekonomicheskaya politika Pravitel'stva RF v usloviyakh vnutrennego sistemnogo krizisa . Materialy zasedaniya Uchenogo soveta ISERT RAN . Vologda: ISERT RAN, 2016. 38 p..
- Indeks «OPORY» RSBI . Available at: http://opora.ru/projects/index
- Indeks delovoi sredy. Rossiiskii soyuz promyshlennikov i predprinimatelei . Available at: http://rspp.rf/library/section/5..
- Indeks kachestva uslovii dlya malogo i srednego biznesa . Available at: https://www.mspbank.ru..
- Itogi deyatel'nosti Ministerstva ekonomicheskogo razvitiya RF v 2012 g. i zadachi na 2013 g. Vystuplenie Ministra A.R. Belousova . Available at: http://economy.gov.ru/minec/press/news/doc20130429_04..
- Kuvalin D.B., Moiseev A.K. Rossiiskie predpriyatiya vesnoi 2015 g.: reaktsiya na valyutnyi shok i deyatel'nost' v usloviyakh ekonomicheskogo spada . Problemy prognozirovaniya , 2015. no. 6, pp. 146-161..
- Maloe i srednee predprinimatel'stvo v Rossii. 2015: stat. sb. . Rosstat . Moscow, 2015. 96 p..
- Maloe predprinimatel'stvo v Rossii. 2003: stat. sb. . Goskomstat Rossii . Moscow, 2003. 109 p..
- Minekonomrazvitiya zavershilo konkursnyi otbor sub"ektov RF dlya predostavleniya subsidii v ramkakh podderzhki MSB. . Ministerstvo ekonomicheskogo razvitiya RF . Available at: http://economy.gov.ru/minec/about/structure/depMB/20160513..
- Monitoringi . Natsional'nyi institut sistemnykh issledovanii problem predprinimatel'stva . Available at: http://nisse.ru/analytics/monitoring/..
- Novosti global'noi ekonomiki. 15-21 avgusta 2016 g. Sberbank . Available at: sberbank.ru..
- Ob"em kreditov, predostavlennykh yuridicheskim litsam-rezidentam i individual'nym predprinimatelyam v rublyakh, po vidam ekonomicheskoi deyatel'nosti i otdel'nym napravleniyam ispol'zovaniya sredstv . Available at: http://www.cbr.ru/statistics/UDStat.aspx?TblID=302-01&pid=sors&sid=ITM_27910..
- Ob"em kreditov, predostavlennykh sub"ektam malogo i srednego predprinimatel'stva v rublyakh, inostrannoi valyute i dragotsennykh metallakh . Available at: http://www.cbr.ru/statistics/UDStat.aspx?TblID=302-17&pid=sors&sid=ITM_33769..
- Ofitsial'nyi sait informatsionnogo agentstva «MFD-InfoTsentr» . Available at: http://mfd.ru..
- Ofitsial'nyi sait Agentstva strategicheskikh initsiativ. Natsional'naya predprinimatel'skaya initsiativa «Uluchshenie investitsionnogo klimata v Rossiiskoi Federatsii» . Available at: http://asi.ru..
- Ofitsial'nyi sait TsB RF . Available at: http://www.cbr.ru..
- Terebova S.V., Podolyakin O.V., Uskov V.S., Egorikhina S.Yu. Predprinimatel'stvo v regione: sostoyanie, perspektivy: monografiya . Vologda: ISERT RAN, 2011. 160 p..
- Klyuchevaya stavka i stavka refinansirovaniya TsB RF . Available at: http://base.garant.ru/10180094/#friends..
- Ilyin V.A., Terebova S.V., Uskov V.S. Postroenie mnogofaktornoi modeli razvitiya malogo i srednego predprinimatel'stva v regione: zaklyuchitel'nyi otchet o NIR . Vologda, 2013. 112 p..
- Rossiiskii statisticheskii ezhegodnik. 2015: stat. sb. . Rosstat . Moscow, 2015. 728 p..
- Solodkov M.V. Regional'nye osobennosti razvitiya malogo predprinimatel'stva: avtoreferat dissertatsii na soiskanie uchenoi stepeni kand. ekon. nauk: 08.00.05 . Irkutsk, 1998. 19 p..
- Statistika kreditovaniya malogo i srednego biznesa v Rossii: byulleten' Analiticheskogo tsentra. Avgust 2016 . MSB Bank. Available at: https://www.mspbank.ru/analiticheskiy_tsentr/issledovaniya_i_analitika..
- Strategiya razvitiya malogo i srednego predprinimatel'stva v Rossiiskoi Federatsii na period do 2030 goda: utverzhdena rasporyazheniem Pravitel'stva RF ot 2 iyunya 2016 g. №1083-r . Available at: http://government.ru/media/files/jFDd9wbAbApxgEiHNaXHveytq7hfPO96.pdf..
- Srednemesyachnaya nominal'naya nachislennaya zarabotnaya plata rabotnikov po polnomu krugu organizatsii v tselom po ekonomike Rossiiskoi Federatsii v 1991-2016 gg. . Available at: www.gks.ru..
- Terebova S.V. Malyi biznes kak faktor povysheniya urovnya zanyatosti i dokhodov naseleniya regiona . Ekonomicheskie i sotsial'nye peremeny: fakty, tendentsii, prognoz , 2013, no. 5, pp. 112-122..
- Tumilevich E.N. Faktory i formy razvitiya malogo predprinimatel'stva v regione . Available at: http://www.vipstd.ru/nauteh/index.php/-ep12-01/343..
- Federal'naya sluzhba gosudarstvennoi statistiki: ofitsial'naya statistika . Available at: www.gks.ru..
- Federal'naya nalogovaya sluzhba: ofitsial'naya statistika . Available at: https://www.nalog.ru/rn77/news/archive/3776431/..
- Hosking A. Kurs predprinimatel'stva: per. s angl []. Moscow: Mezhdunar. otnosheniya, 1993. 350 p.
- Tsentrobank. Usloviya kreditovaniya kommercheskikh bankov []. Availble at: http://www.cbr.ru/
- Bartik T.J. Small business start-ups in the United States; Estimates of the effects of characteristics of states. Southern Economic Journal, 1989, pp. 1004-1018.
- Blanchflower D.G., Oswald A.J. What makes an entrepreneur? Journal of Labor Economics, 1998, no. 16, pp. 26-60.
- Baumol W.J. Entrepreneurship: productive, unproductive, and destructive. Journal of Political Economy, 1990, pp. 216-234.
- Business Environment and Enterprise Performance Survey. Available at: http://ebrd-beeps.com
- Coase R.H. The Nature of the Firm. Economica, New Series, 1937, vol. 4, no. 16, Nov., pp. 386-405.
- Doing Business. World Bank Group. Available at: http://www.doingbusiness.org/
- Doing Business in Russian Federation -World Bank Group. Available at: http://www.doingbusiness.org/data/exploreeconomies/russia/
- Global Entrepreneurship Monitor. Available at: http://www.gemconsortium.org/
- Moyes A., Westhead P. Environments for new firm formation in Great Britain. Regional Studies, 1990, pp. 123-126.
