The development of the stem (science, technology, engineering, and mathematics) attitude and motivation survey towards secondary school students
 attitude and motivation survey towards secondary school students")
Author: Tolga Gok
Journal: International Journal of Cognitive Research in Science, Engineering and Education @ijcrsee
Section: Original research
Article in issue: 1 vol.9, 2021.
Free access
The purpose of the research was to determine the secondary school students’ attitude and motivation toward STEM. For this purpose, two field studies for developing a survey were conducted. The first field study, pilot study, was performed for collecting the research data and making statistical analysis of the research data. After completing statistical analysis procedures (Explanatory Factor Analysis and Confirmatory Factor Analysis) of the pilot survey, the reliability and validity of the pilot survey was calculated. The statistical results indicated that the pilot survey was reliable and it also had four sub-factors. The second field study, main study, was performed for comparing and discussing the research data. The research was applied to 2912 students at different 14 secondary schools during the academic year of 2018-2019 at Izmir, Turkey. The students’ results in the metropolitan and suburban regions of the city were compared. The results indicated the decrease in the attitude and motivation of students at higher levels in both regions toward STEM. When the results of the research were evaluated in terms of the sub-factors, the science and engineering values of secondary school students in the suburban were higher than the values of the students in metropolitan. It was not found a significant difference between the students’ technology and mathematics values for both metropolitan and suburban. There was a significant difference between the 7th grade students’ science, technology, engineering, and mathematics values instructed in metropolitan and suburban in favor of the students instructed in suburban. It was calculated that there was not a significant difference between the 6th and 8th grade students’ all values for both the regions. It was only calculated that there was a significant difference between the 5th grade students’ mathematics value. Investigations on gender factors showed that the female students’ science, technology, engineering, and mathematics values were generally lower than the male students’ values for both the regions.
Attitude, integrated stem education, motivation, secondary school
Short address: https://sciup.org/170198615
IDR: 170198615 | UDC: 159.947.5-057.874(560)"2018/2019" | DOI: 10.23947/2334-8496-2021-9-1-105-119
Text of the scientific article The development of the stem (science, technology, engineering, and mathematics) attitude and motivation survey towards secondary school students
All countries need a broader and more coordinated teaching strategy in science, technology, engineering, and mathematics (STEM) at all levels from primary to university education. The teaching strategy in all the STEM disciplines should be to “address the need for greater diversity in the STEM professionals for a workforce with deep technical and personal skills, and for a STEM-literate citizenry prepared to address the grand challenges of the 21st century” ( Bybee, 2010a, p.996 ). Sanders (2009, p.21) defined STEM education as “approaches that explore teaching and learning between/among any two or more of the STEM subject areas, and/or between a STEM subject and one or more other school subjects”. Kelley and Knowles (2016, p.3) determined “integrated STEM education as the approach to teaching the STEM content of two or more STEM domains, bound by STEM practices within an authentic context for the purpose of connecting these subjects to enhance student learning.” Brown et al. (2011, p.6) defined STEM education as “a standards-based, meta-discipline residing at the school level where all teachers, especially science, technology, engineering, and mathematics (STEM) teachers, teach an integrated approach to teaching and learning, where discipline-specific content is not divided, but addressed and treated as one dynamic, fluid study”. At this point it is essential to focus on integrating different disciplines in modern education settings. Breiner et al. (2012) reported that it is difficult to concentrate with different disciplines in contemporary curricu lum programs, these disciplines are not independent majors therefore

© 2021 by the authors. This article is an open access article distributed under the terms and conditions of the Creative Commons Attribution (CC BY) license .
each discipline is able to be thought of as a cluster. Educators and researchers can focus on combining four disciplines and bridging the relationships among four disciplines in today’s technological world ( Sanders, 2009 ; So et al., 2018 ).
The main purpose of STEM education is to foster qualified and skilled manpower ( Luo et al., 2019 ). Also the purposes of STEM education are to develop industry and technology, to raise welfare levels, to increase literacy rates, etc. ( Christensen, Knezek and Tyler-Wood, 2015 ; Hanson and Krywult-Albanska, 2020 ; Unfried et al., 2015 ).
Bybee (2011, p.6) determined that integrated STEM education focuses on eight factors which are “asking questions and defining problems, developing and using models, planning and carrying out investigations, analyzing and interpreting data, using mathematics and computational thinking, constructing explanations, designing solutions, engaging in argument from evidence, obtaining, evaluating, and communicating information”. Students may begin to learn by becoming aware of the eight fundamental factors. Students may understand how to improve the design, inquiry, and analysis process and how to combine innovation and technology in a true STEM education environment. Students are able to study on projects and laboratory investigations with the STEM curriculum in cooperative learning groups. Besides, teachers may explain to students what they are to do and how they are taught in these education settings in order to develop deeper and richer understandings and abilities ( Hasanah, 2020 ; Li et al., 2020 ; Margot and Kettler, 2019 ).
STEM helps students improve 21st century skills covered flexibility, adaptability, creativity, information resources management, media and technology literacy, self-management, social skills etc. and specifically ensures that students are sensitive citizens about energy efficiency, air and environmental pollution, climate change, use of natural sources, national security, personal healthy, economics, politics, and cultural values, personal, social and global issues, etc. STEM also makes significant contributions to the importance of science, the emphasis of technology, and the recognition of engineering in all school programs ( Bybee, 2010b ; Sanders, 2009 ).
STEM will play an important role in students’ career choices nowadays and in the near future. Many students will generally focus on STEM-based jobs instead of natural sciences, medical fields, engineering jobs. Employers in industries will also consider qualified workers with STEM-related skills for filling empty and critical positions ( Abe and Chikoko, 2020 ; Brown et al., 2011 ). Therefore determining and guiding students’ academic choices are quite important at the primary and/or secondary school levels in today’s world. The academic choices of students have lately been begun to investigate in depth by researchers ( Craig et al., 2018 ; Maltese and Tai, 2011 ; Sadler et al., 2012 ; Unfried et al., 2015 ).
Integrated STEM education plays an important role in improving students’ problem solving skills, creative thinking, social skills, communication and collaboration skills, self-management skills, critical thinking, and analytical thinking ( Brown et al., 2011 ). When integrated STEM education based on constructivist ( Bransford, Brown and Cocking, 2000 ; Sanders, 2009 ) will be applied at schools or universities, it will pave the way for some radical changes according to the present education systems such as teaching methods (inquiry-based learning, project-based learning, problem-based learning, design-based learning, etc.) and assessment of materials, teacher training, class environment, etc. However, these kinds of radical changes are also responsible fortaken responsibility time, effort, support and financial commitment ( Leung, 2020 ; Merrill, 2001 ; Sanders, 2009 ). Integrated STEM education contributes rediscovering present scientific knowledge based on learning science and mathematics, developing engineering and technological design processes, thinking about real world issues, enhancing analytical thinking, seeking solutions toward social, economic, and environmental issues, and contributing to the establishment of interdisciplinary relations of students at all grade levels.
The most important feature that distinguishes this study from other studies is the determination of secondary school students’ tendencies towards science, technology, engineering and mathematics. After the STEM trends of the secondary school students are determined, program development experts will need to create a curriculum according to the determined trends. Teachers will need to determine alternative teaching strategies in order to achieve the goals determined according to the curriculum prepared. School administrations will need to provide the necessary equipment and materials to enable teachers and students to carry out activities based on research, project, collaboration, etc. The study is mainly focused on the tendency of the secondary school students. The other results of the research are focused on attracting the attention of school administrators, curriculum development experts and teachers.
STEM Education in Turkey
In Turkey, science and mathematics classes are taught to the students at the secondary school level by using traditional educational approaches rather than integrated STEM education which are expressed together with science, technology, engineering and mathematics ( Cevik, 2017 ; Yamak, Bulut and Dundar, 2014 ). In this approach many science teachers just teach the students the area course without thinking about different disciplines, and they usually do not mention science applications toward engineering and technology at their own classes. The students have science, mathematics, computers, etc. classes but these classes are separately taught to the students by using traditional education which is focused on one discipline (e.g., science, mathematics). Therefore they may not synthesize instructed subjects, they might easily forget independent of taught knowledge, they may not be interested in STEM subjects, and they might not choose a STEM career, they can graduate from secondary and/or high schools with lower science and/or mathematics. Besides, the students are not taught engineering and technology classes in their own school curriculum and the national educational programs.
The primary goal of the present study is defining the attitude and motivation of the secondary school students by thinking Turkish students’ demographic characteristics with a developed STEM attitude and motivation survey with the support of the Ministry of National Education. It is expected that this developed STEM survey in the research will fill the gap in the literature for thinking countries like us.
Materials and Methods
The present research covered two sections. The first section examined the pilot survey development procedures. The section consisted of conducting literature review, creating a large pool of the pilot survey items, taking expert opinions for items of the pilot survey, and performing factor analysis based on “exploratory factor analysis” and “confirmatory factor analysis”. The second section contained the application of the survey developed for attitude and motivation toward STEM. This section discussed the findings of the developed survey.
The Pilot Survey Development Procedures
The literature on STEM surveys ( Faber et al., 2013 ; Kier et al., 2014 ; Tyler-Wood, Knezek and Christensen, 2010 ) measured the attitude and motivation of the students toward STEM disciplines was reviewed by using of ERIC, Google Scholar, and Science Direct. Volunteer 30 students were asked to write their own views on the integrated STEM education item by item. The similar expressions were considered based on students’ perspectives. Examined surveys and written views helped to determine items of the pilot survey and made a significant contribution of the pilot survey with 69 items. The pilot survey was sent to the five STEM specialists and six science, mathematics, and computer teachers working in STEM education for assessing the content validity. According to the expert recommendations, the pilot survey with 69 items on the five-point Likert scale was reviewed for each item. The items were scaled from strongly agree “5” to strongly disagree “1”.
Participants
The data of the pilot survey were collected from 1335 students in seven public secondary schools during the academic year of 2018-2019 in the third largest city (İzmir) of Turkey. The schools had not ever implemented integrated STEM education program. The pilot study was performed in two regions of Izmir in order to generalize the obtained findings of the research. The first region was metropolitan. The region covering two districts were randomly chosen by thinking of time and budget of the research. The second region was suburban. The region was close to the city center and was the author’s workplace. All of the students were voluntary in the research. The students were anonymously asked to fill the survey and the surveys were coded randomly.
The pilot survey of 192 students who filled the survey incorrectly and/or incompletely were not evaluated. Therefore the statistical analysis of the pilot survey was conducted on 1143 students. Six hundred and thirty-four of 1143 students were female and the rest of them were male. Table 1 indicates the demographic variables of the students. The 5th grade students were not taken part in the research. Because they went through the adaptation period for transition from primary to secondary school.
Table 1
Demographic variables of the students
|
Female |
% |
Male |
% |
Total |
% |
|
|
6th grade |
202 |
57.7 |
148 |
42.3 |
350 |
30.6 |
|
7th grade |
234 |
55.1 |
191 |
44.9 |
425 |
37.2 |
|
8th grade |
198 |
53.8 |
170 |
46.2 |
368 |
32.2 |
Students were approximately given ten minutes to fill out the pilot survey in their own class time. Before handing out the pilot survey, the explanatory information about the pilot survey were briefly presented to the students.
Data Analysis
The statistical analysis of the pilot survey was examined in two subtitles which are Explanatory Factor Analysis (EFA) and Confirmatory Factor Analysis (CFA). EFA was performed by SPSS Statistics 25 while CFA was conducted on AMOS 25 Graphics program.
Explanatory Factor Analysis (EFA) of the Pilot Survey
The pilot survey according to EFA consisted of 34 items. All items in the pilot survey were positive statements. Some statistical analysis data concerning the pilot survey were given as follows: Bartlett’s test of sphericity was measured as 20429.593, df=561, p<.001, KMO (Kaiser-Meyer-Olkin) value was calculated as .91, total explained variance value was measured as 57.94% and Cronbach’s Alpha value was calculated as .84. The obtained statistical data showed that the factor analysis for the pilot survey was appropriate ( Hair et al., 2014 ). The pilot survey found four sub-factors. The sub-factors were named considering the content of the research. The first factor consisted of 7 items and was called “Science” (S). The second factor comprised 8 items and was called “Technology” (T). The third factor consisted of 10 items and was called “Engineering” (E). The last factor comprised 9 items and was called “Mathematics” (M). Figure 1 indicates the relationship between the items and eigenvalues of the pilot survey. The factor loadings of the items (see in Appendix 1) are over .65 and the eigenvalues of sub-factors were above “1”. When the examined studies ( Hair et al., 2014 ; Tabachnick and Fidell, 2012 ) in the literature were evaluated, it could be said that the values obtained from explanatory factor analysis are “high” and “acceptable”.
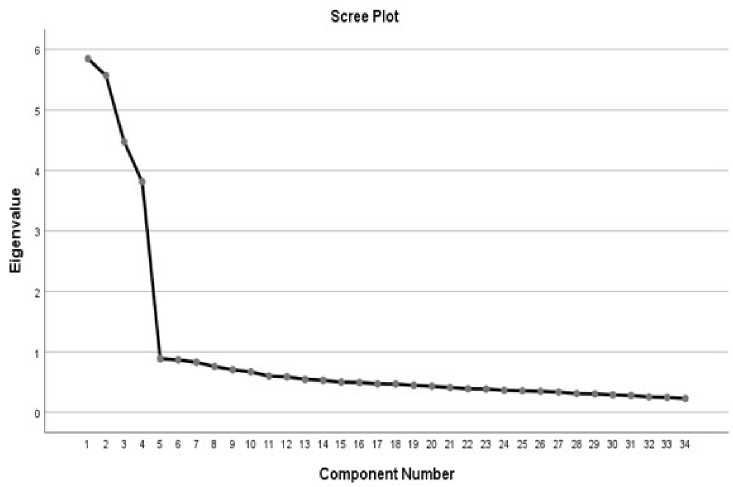
Figure 1. The relationship between the items and eigenvalues of the pilot survey
Confirmatory Factor Analysis (CFA) of the Pilot Survey
CFA was conducted to support EFA results of the pilot survey. CFA’ values are expected results between “acceptable fit” and “good fit”. After the statistical analyses were performed, the modification index values were observed between “acceptable fit” and “good fit”. Table 2 illustrates the CFA measurement values.
Table 2
The fit indexes of CFA
