The effect of applying the Six Sigma approach on the costs of activities of the General Company for Textile and Leather Industries

Author: Shaymaa Dheyaa Jasim ALobaidi, Thair Sabri Mahmoud Kazem ALghabban
Journal: Science, Education and Innovations in the Context of Modern Problems @imcra
Article in issue: 4 vol.4, 2021.
Free access
The General Company for Textile and Leather Industries, a subsidiary of the Ministry of Industry and Minerals, plays a prominent role in reviving the national economy given its specific status. However, it is currently suffering from several problems, including the high costs of its activities, and a decrease in the accuracy of its production processes. These issues were reflected in the high percentage of defective production and a decline in the rate of proper production. Accordingly, the method of Six-Sigma came to help analyse production activities through the application of the Define, Measure, Analyse, Improve and Control (DMAIC) approach to identify cost-depleting activities that are not offset by the benefit and to prevent the defective production from the beginning instead of addressing it later and at a level of (3.4) defect per million opportunities. Employing the abovementioned company as the research sample, several conclusions have been reached, the most important of which is the presence of several sources of waste and loss such as value-adding activities and processes , which resulted in high costs. This is in addition to the company's failure to use modern cost-effective methods that help in i) continuously improving production processes and its outputs, ii) identifying the root problems of high costs, iii) eliminating sources of waste and loss, and iv) decreasing the quality of its products.
DMAIC, Six-Sigma
Short address: https://sciup.org/16010114
IDR: 16010114 | DOI: 10.56334/sei/4.4.03
Text of the scientific article The effect of applying the Six Sigma approach on the costs of activities of the General Company for Textile and Leather Industries
The textile and leather industry occupies great importance, being the only industry in the Iraqi environment that produces wool, cotton and leather products, which constitute one of the main needs of customers. The profit-making of these industries is linked to the extent to which the customer accepts their products in terms of price, quality, designs, etc.. This signals the the importance of conducting a study that analyses the production activities of this industry in a manner consistent with its nature. Accordingly, this study, which used the Six-Sigma method, was conceived with the aim of developing solutions to the problems that the company suffers from.
Research methodology and previous studies
2.1 Research methodology
2.1.1 Research problem
2.1.2 Research Aim
Various sectors in the Iraqi environment in general and the industrial sector in particular face obstacles to achieving the planned goals. This is ascribed to the reliance on traditional cost accounting systems to provide information for decision-makers and hence their inability to diagnose, analyse and address weaknesses from the stage of product design or service to the stage of offering it to the customer.
Based on the above, the research problem can be summarised through the following questions to avoid deficiencies in the traditional systems applied in the industrial sector units and as follows:
Does the adoption of the Six-Sigma method help guide the administration of the unit to the reasons that led to the high cost of productive activities?
ISSN 2790-0169 / E-ISSN 2790-0177
Does the Six-Sigma method rationalize the cost of activities through the DMAIC approach?
The research aims to achieve the following objectives:
Introducing the method of Six-Sigma as one of the modern cost methods that contribute to improving the cost of activities.
Preventing the occurrence of defects from the outset instead of addressing them later and up to almost zero defects.
Using the methods of analysis and measurement of comparisons, cause and effect chart, Burrito and others to help determine where improvement begins.
Improving the value of the product and the process by identifying the causes of fundamental deviations and addressing them and making continuous improvements to them.
2.1.3 The Importance of Research
The importance of research can be summarised in the following points:
Addressing criticism of traditional systems applied by the company sampled in this research in identifying indicators of any problem or defect in the product or production process.
Focusing on production processes and identifying and measuring their defects with the aim of improving them by making performance efficiency up to 3.4 defects per million opportunities where they operate in an organized methodology that helps to identify the root causes of the problems of high costs and propose appropriate solutions and make continuous improvements under effective operational control.
Eliminating waste of resources such as damage, loss, recycling and others.
ISSN 2790-0169 / E-ISSN 2790-0177
2.1.4 Research Hypothesis
The research is based on the following hypothesis:
The Six-Sigma method contributes to influencing the production activities in a way that raises their efficiency and reduces their costs.
2.1.5 Research Limits
The limitations of the research are as follows:
Spatial limits: The General Company for Textile and Leather Industries – Al Sofia Factory was chosen as our research site. This was due to the fact that most of the factory’s factories did not keep pace with the technological developments that the world has reached in terms of manufacturing, designing and controlling. This consequently resulted in high costs, high prices, poor quality products, and weak competitive position.
Time limits: - The financial statements and cost reports for the years 2019-2020 were chosen to provide the required data in a way that facilitates studying them and identifying the most important problems that the company suffers from and proposing solutions to them, and thereby achieving the research objectives.
2.1.6 Research Methodology:
The inductive approach was relied upon to accomplish the theoretical aspect by consulting the literature related to the subject of the research as well as the descriptive analytical approach to accomplish the practical aspect by collecting and analysing the data.
2.1.7 Previous studies
Previous studies related to the Six-Sigma method can be presented in Table (1) below.
Table (1): Studies related to the Six-Sigma method
The study of Hussein (2018)
ISSN 2790-0169 / E-ISSN 2790-0177
|
Title |
The effect of applying Six-Sigma technology in reducing costs and improving the quality of banking service |
|
Type |
A letter submitted to the Council of the College of Administration and Economics - Al-Mustansiriya University, which is part of the requirements for obtaining a master’s degree in accounting sciences |
|
Aim |
Apply the Six sigma technique to the banking sector in order to reduce errors and costs resulting from providing banking services and developing performance by focusing on improving the quality of these services |
|
The most |
The Six-Sigma technique has proven its success and its ability to improve |
|
important |
the quality of the operations of the economic units that it has adopted, |
|
conclusion s |
whether industrial, service or other sectors. |
2- Study of Al-Khayyat (2017)
|
Title |
Reducing costs by using the techniques of target cost and Six-Sigma for economic units operating in the Iraqi environment |
|
Type |
Applied research in Financial Links General Trading Company |
|
Aim |
Reaching the best contemporary techniques to manage the costs of the commercial economic units operating in the Iraqi business environment in light of the current economic conditions, which can be applied to similar cases in other countries, by: Showing the dimensions of the cost reduction process through the techniques of target cost and Six-Sigma and the practical application of the procedures of the target cost techniques and Six-Sigma, and to clarify their role in reducing costs while maintaining the quality of service provision. |
ISSN 2790-0169 / E-ISSN 2790-0177
|
The most important conclusion s |
The company's adoption of the field of research depends on traditional cost systems in managing its costs, despite the obvious shortcomings in the work of those systems. The company neglects the field of research for the issue of cost control in the periods when the activity is booming. The profits are achieved according to satisfactory ratios, and the stability of its market share forgetting the rapid changes in the modern business environment. The importance of increasing the market share or at least maintaining it by making low costs an advantage that contributes in its continuity. |
|
3- Study of Yassin (2017) |
|
|
Title |
The effect of Six-Sigma application requirements in reducing the cost of poor quality |
|
Type |
A case study on the ship's captain factory in Najaf |
|
Aim |
Explanation of the impact of the requirements for the application of Six-Sigma in reducing the cost of poor quality in the Rabban al-Safina factory in Najaf by i) providing a theoretical framework on the requirements for the application of Six-Sigma and the concepts related to the cost of poor quality, and ii) identifying the availability of requirements for the application of Six-Sigma and the level of cost of poor quality in the factory above, while determining the impact of the requirements of Six-Sigma. The application of Six-Sigma approach in reducing the cost of poor quality. |
|
The most important conclusion s |
The presence of the effect of the requirements of Six-Sigma in reducing the cost of poor quality at the Rabban al-Safina factory in Najaf. This means the ability of the requirements of Six-Sigma to improve performance and develop work mechanisms that are reflected in reducing |
ISSN 2790-0169 / E-ISSN 2790-0177
|
and reducing the cost of poor quality and work hard to offer goods that live up to international standards, capable of attracting more customers |
4- study of Adili (2014)
|
Title |
The possibility of applying the Six Sigma method and its role in reducing costs and strengthening competitiveness |
|
Type |
An applied study in the Advanced Technologies Company for the remanufacturing of consumables. |
|
Aim |
To demonstrate the role of the Six-Sigma technique in reducing defective production, maximizing profits, increasing production efficiency, and its impact on reducing costs and increasing the competitiveness of the unit. |
|
The most |
The application of the Six-Sigma technique according to sound scientific |
|
important conclusion |
foundations leads to the transfer of the unit from the lower levels to a higher level of six-sigma, which leads to a decrease in the percentage of |
|
s |
defective production and an increase in the quality of products with a decrease in quality costs, in addition to achieving savings and profits for the unit. This leads to an increase in its capacity competitiveness. |
Six-Sigma and activity costs
-
3.1 The Concept :
In light of the intense competition witnessed by all sectors, the units strive to achieve a competitive advantage. This is in order to ensure that they maintain a market share by achieving a high level of quality of their products, which was considered by many units as a source of concern as they need considerable material and human resources. The units in general and the American ones in particular, relied on the method of comprehensive quality checking, that is, p. 71
October, 2022, Baku, ISSUE IV
ISSN 2790-0169 / E-ISSN 2790-0177
(product checking by 100%). This method is an ineffective one in light of the production of large quantities, which makes the checking process uneconomic. This in turn obliged the units to search for modern methods in processes to achieve competitive advantage, and Six-Sigma approach is one of those methods (Eckes, 2001, pp.1-3). The main objective is to reduce defects to 3.4 defects per million opportunities (Furphy, 2010, p. 23). Table (2) below shows the Six-sigma levels, the number of units performed and the level of performance that correspond to each level, and as follows:
Table (2): Six-Sigma levels and performance and their relationship to the
|
Six-Sigma level |
Number of defective units |
performance level |
|
1 |
691,500 |
30.85 |
|
2 |
308,300 |
69.15 |
|
3 |
67,000 |
93.32 |
|
4 |
6,220 |
.99.38 |
|
5 |
233 |
99.977 |
|
6 |
3.4 |
99.99966 |
Source : (Thompson, 2007, p. 40)
3.1 2 Principles of Six-Sigma Approach.
Table (3): The principles on which the Six-Sigma method is based.
ISSN 2790-0169 / E-ISSN 2790-0177
|
Details |
sequence |
|
First principle |
Focus on customer satisfaction by studying their requirements and desires. |
|
Second principle |
Rely on facts to clarify the criteria that will be used to evaluate performance. |
|
Third principle |
Effective management that is based on advance planning to address problems and focus on prevention. |
|
Fourth principle |
Unlimited cooperation between workers at various administrative levels and improving teamwork performance |
|
Fifth principle |
Continuous improvement to reduce deviations, maintain quality and increase productivity by adopting new methods. |
|
Sixth principle |
Participation and teamwork as well as emphasizing the importance of decentralized communications and horizontal communications. |
|
Seventh principle |
Prevention rather than examination, which drains human and financial resources. |
3.1 .3 Elements of Six-Sigma approach
The following elements taking into account when working on the adoption and application of the Six-Sigma method and as follows:
ISSN 2790-0169 / E-ISSN 2790-0177
The support and commitment of the senior management to the Six-Sigma method is a condition for the success of its application as a strategic process.
Changing the culture of the unit towards its reliance on motivating and directing employees in making decisions and urging teamwork.
Linking the Six-Sigma method to accounting and management information systems.
Linking the system of promotions and incentives for the human resources working in the programs of Six-Sigma projects.
Focusing on internal processes that require prior planning and departure from reaction management to problem management before they occur.
3.1 4 Organizational Structure of the Six-Sigma Working Group:
The belt system is important for the application of the Six-Sigma method. Once the administration intends to adopt the Six-Sigma method, the implementation of the work becomes the responsibility of multiple work teams. The skills of these teams and their leaders are called different names, such as: the main black belt, the black belt, the green belt and these responsibilities and tasks escalate from one administrative level to another (Al-Baghdadi, 2018, pp. 161-162).
3.1.5 Six-Sigma Methodologies
Six-Sigma has two working methodologies as follows (Al-Titi, 2011, p. 170):
(DMAIC) approach: It is used in projects that aim to improve their current business operations, and it consists of five steps (Define, measure, analyse, improve, and control). In the event that the unit for this approach failed to raise the level of performance, it applies the next approach, that is DMADV.
The (DMADV) approach: It is a method used in projects that aim to produce new products or design new processes, and it consists of the following steps (define, measure, analyse, design,
ISSN 2790-0169 / E-ISSN 2790-0177
and verify). The DMAIC (Problem Solving) approach is better than others for the following reasons: (Al-Nuaimi and Sweiss, 2008, pp. 86-87)
Measuring the problem: it is not limited to defining the problem, but working to prove its credibility with facts.
Focusing on the external and internal customer.
Verification of the basis of the problem by means of facts that prove that this factor alone is the cause of the problem.
Eliminating previous habits, the solutions resulting from this method must generate real change and not simple changes.
Risk management is an essential part of this method and is considered logical.
Measuring results, the realistic impact of our solutions, supported by facts.
Continuous follow-up.
3.1.6 Tools used in applying the Six-Sigma method:
A set of tools is used with the application of the Six-Sigma method. Cause and effect analysis, process mapping, benchmarking, process capability analysis, burrito analysis are among the most widely used tools when applying it. There are also another group of tools that are less used than the first group, as shown in Table (4) and as follows: (Shah, 2016, p. 916).
Table (4): The most and least used tools when applying the Six-Sigma method
(Setter, 2018, p. 206)
|
Most used tools and techniques |
Ratio% |
Less used tools and techniques |
The ratio% |
|
|
1 |
Cause and Effect |
76% |
ISSN 2790-0169 / E-ISSN 2790-0177
|
Analysis |
||||
|
2 |
Operations Flow Diagram |
52% |
Quality Function Deployment |
30% |
|
3 |
reference measurement |
50% |
Experiment Design |
18% |
|
4 |
Burrito analysis |
47% |
||
|
5 |
Process capacity analysis |
47% |
3.1.7 The relationship between the Six-Sigma method and quality costs
Quality costs are defined as the sacrifice incurred by the unit due to the production of a good or service that does not conform to specifications from the first time (Al-Azzawi, 2012, p. 22). It is associated with achieving or not achieving product or service quality. Accordingly, it is divided into two parts:
good quality costs (prevention, evaluation) which is borne by the company in order to ensure the development and success of the product or service.
The costs of poor quality (internal and external failure) borne by the unit as a result of its knowledge of the defects that occurred in the product or service to make it acceptable to the customer (Al-Antari, 2020, p. 33).
Blocher et al. (2010, pp. 759-760) divided it into the following:
Prevention costs: are the sacrifices incurred by the unit to prevent the occurrence of quality defects from the beginning.
ISSN 2790-0169 / E-ISSN 2790-0177
Evaluation costs: are the sacrifices made to determine the extent to which the outputs match the target specifications.
Internal failure costs: are the sacrifices related to defective processes or products that have been discovered before they reach the customer.
External failure costs: these are the sacrifices associated with quality defects that were discovered after delivering the defective product or service to the eventual customer.
The relationship between the Six-Sigma method and quality costs can be illustrated through the following table:
Table (5): The relationship between Six-Sigma level and quality costs
|
Six-Sigma levels SS |
Ratio of quality costs and according to diffraction levels |
|
1 |
unmeasured |
|
2 |
Above 40% |
|
3 |
25% to 40% |
|
4 |
15% to 25% |
|
5 |
5% to 15% |
|
6 |
Less than 1% |
Source: (Setter, 2018, p. 123).
ISSN 2790-0169 / E-ISSN 2790-0177
It can be noted from Table (5) that the relationship between the Six-Sigma level and quality costs is a direct one. As far as these costs fall, they are associated with the number of units that the unit is the level of the unit (2), the quality costs will be high as more than 40% of total sales. At the level of (6), the failure costs are less than 1% of the total sales as the level of the limit rate decreased and therefore the costs decreased (Al Yamour, 2010, p. 11). Rawal et. al (2021), Poongodi M et. al(2022), Poongodi M et. al (2021), Dhiman P et.al (2022), Sahoo S.K et.al (2022), K.A et. al(2022) , Dhanraj R.K et. al (2020), Poongodi M et. al (2019), Poongodi M et. al (2020), M. M. Kamruzzaman et. al (2014), M. M. Kamruzzaman et. al (2021), Md Selim Hossain et. al (2019), Mingju Chen et. al (2019).
Achieving quality and its continuous improvement will lead to attracting the largest number of satisfied customers and consequently a decrease in the cost of the produced unit as a result of the increase in the number of units sold. (Al-Ajili et al ., 2016, p. 64).
The relationship between the Six-Sigma method and the reduction of quality costs is mainly focused on the desire to prevent defects before they occur, leading to the completion of operations in the correct manner from the beginning. When the administration is able to identify and measure the number of defects in production processes, it will certainly be able to take the right measures to reduce them by up to 3.4 defects per million opportunities. This is consistent with the modern view of quality based on the concept of continuous gradual improvement of quality and the resulting reduction in the cost of internal and external quality to the lowest possible level. Therefore, in order to reduce the costs of internal and external failure, unit administration should focus its attention on prevention and evaluation activities (cost of confirmation and quality assurance), as the discrepancy in the target specifications of both products and processes will result in an unjustified increase in quality costs. Thus, directing the unit’s attention and focus on reducing the number of defects in its production processes and outputs will result in a significant reduction in the cost of internal and external quality with a slight increase in the cost of prevention and evaluation. This will begin to decline while improving the quality of operations and reducing its defects, thereby achieving the optimal quality level (Hilton, 1999, p. 499).
ISSN 2790-0169 / E-ISSN 2790-0177
-
4. The practical side: steps of applying the Six-Sigma method
-
4.1 The definition
-
It includes identifying production defects according to their type and number to be a basis for measuring the level of diffraction with which the company operates. Before starting to identify the causes of defects in production, the product will first be described and the activities of production operations will be identified as follows:
The carpet is an interwoven fabric structure consisting of three dimensions (Z Y X), as its manufacturing requires three basic raw materials that overlap in texture to form the textile structure of the mechanical carpet as follows:
weft yarn in X direction (weft): to fix the pile threads and to tie the warp threads together with a single textile structure, as the main material used in weft yarn is jute.
Pile in Y direction: The pile yarn is distinguished from the upper shape of the rug, and it is possible to use various types of yarn as loose yarns that are included in the textile process such as silk, wool, acrylic, polypropylene, polyester, or other yarns.
Warp yarn in Z direction: Warp yarn is used in many types of textile materials such as polyester, polypropylene and polyamide, but the most commonly used material in warp yarn is divided into two parts:
-
A: Filling warp: These threads preserve the texture of the two carpets separately.
-
B: Weaving warp: These threads connect the weft threads with the filling warp to form the floor of the mechanical carpet.
latex, water, steam.
The following section is dedicated to determining the type and number of defects in the mechanical carpet product in the light of which it is possible to measure and determine the level of diffraction with which the company operates, as in Tables (6) and (7) and as follows:
ISSN 2790-0169 / E-ISSN 2790-0177
Table (6): Types of defects in the products of the General Company for Textile and Leather Industries - mechanical carpets
Defect type
Histological defects
Design defects (patterns and colors)
Confusion
Finishing
Product weight does not match specifications
Inaccurate measurements
Softness and smoothness
Source: Based on field visits to the laboratory
Table (6) shows the most frequent defects that totalled (7) defects and will be adopted when applying the equation for calculating the level of diffraction. Table (7) includes the classification of the actual production quantity for 2020, which amounted to (1230 m2) depending on its condition and as follows:
Table (7): Types of products distributed according to their proper and flawed quantities and proportions: Mechanical Carpet Woollen Factory / General Company for Textile and Leather Textiles for 2020
|
Product Type |
Total product ion |
Proper production |
Proper production |
Quantity of production |
The proportion of defective |
ISSN 2790-0169 / E-ISSN 2790-0177
|
quantity |
ratio |
quantity |
defects |
production |
|
|
Baghdad acrylic carpet 3×4 |
288 |
0% |
0 |
288 |
100% |
|
Baghdad acrylic carpet 3×5 |
90 |
0% |
0 |
90 |
100% |
|
Baghdad antique acrylic carpet 1.25×1 |
219.5 |
10% |
21.5 |
198 |
90% |
|
Babel Polypropylene Carpet 2×3 |
140 |
14% |
20 |
120 |
86% |
|
Red Acrylic Ceremony Carpet |
195 |
5% |
10 |
185 |
95% |
|
Baghdad acrylic carpet 2×3 |
104 |
4% |
4 |
100 |
96% |
|
Baghdad acrylic carpet 3×1 |
60 |
17% |
10 |
50 |
83% |
|
Baghdad acrylic carpet 1×2 |
116 |
5% |
6 |
110 |
95% |
|
Bubble Polypropylene Carpet 2.5×3.5 |
17.5 |
49% |
8.5 |
9 |
51% |
|
Total |
1230 |
7% |
80 |
1150 |
93% |
Source: Based on field visits to the company
Table (7) reveals that the amount of defective production increased to (1150 m2), representing 93% of the total production amount (1230 m2), which is very high, as some production runs were in total as defective as Baghdad acrylic carpets measuring (3×4) and (3×5).
ISSN 2790-0169 / E-ISSN 2790-0177
Percentage of defects per unit = quantity of production defects x 100%production quantity
Defect ratio per unit =1150 m2x 100% = 93%
1230 m2
Accuracy ratio of operations = 1 – defects per unit
Accuracy percentage of operations = 1 - 93% = 7%
Defects per million opportunities = The amount of defects
Production quantity x types of defects
Defects per million opportunities =1150 m2=1150 m2= 0.13356562137
1230 m2x 7 8610 m2
0.13356562137 x 1000000 = 133,566 defects
From the above equations, it can be noted that the percentage of defects per unit has increased, reaching (93%), offset by a significant decrease in the percentage of accuracy of operations, which reached (7%). The probability of defects appearing per million opportunities is (133,566) opportunities, and to determine the level of deviation, the table for Six-Sigma levels is referred to as follows:
Table (8): Six-Sigma for the State Company for Textile and Leather Industries - Mechanical
Carpets
133,566
ISSN 2790-0169 / E-ISSN 2790-0177
|
Six-sigma level |
Number of defective units |
Performance level |
|
1 |
691,500 |
30.85 |
|
2 |
308,300 |
69.15 |
|
3 |
67,000 |
93.32 |
|
4 |
6,220 |
.99.38 |
|
5 |
233 |
99.977 |
|
6 |
3.4 |
99.99966 |
From Table (8), it can be seen that the number (133,566) lies between the level (2) and (3).
Based on the above results, it is necessary to search for the main reasons that led the company to this poor level of performance.
The ratio of quality costs can be determined through the relationship between levels of diffraction and quality costs, as shown in Table (9) and as follows:
Table (9): Determining the percentage of quality costs in light of diffraction levels Mechanical carpet .
|
Six-Sigma level |
Number of defective units |
Quality costs |
|
|
1 |
691,500 |
unmeasured |
ISSN 2790-0169 / E-ISSN 2790-0177
|
2 |
308,300 |
Above 40% |
|
3 |
67,000 |
25% to 40% |
|
4 |
6,220 |
15% to 25% |
|
5 |
233 |
5% to 15% |
|
6 |
3.4 |
Less than 1% |
It can be noticed from Table (9) that the percentage of quality costs that correspond to the level of diffraction with which the company operates is located between the first and second levels is (25%-40%), i.e. the rise in quality costs (internal failure, external failure) and the detailed analysis will be done in the analysis stage to determine the first cause.
Therefore, the following paragraph will include a detailed analysis of the production problems that the company suffers in order to identify the main causes as follows:
-
4.2: The two stages of analysis and measurement
The aim of these stages is to search for the possible causes of the production problems that the company suffers from and listed in Table (5), which led to a decrease in production and sales levels and a rise in production costs accompanied by a decrease in the quality of products, and the achievement of successive losses, the amount of which can be shown for the last three years as in Table (10) and as follows:
Table (10): Result of current operations activity.
Year Amount of losses in dinars
2018 11,235,532,000
ISSN 2790-0169 / E-ISSN 2790-0177
11,443,993,160
11,694,211,250
Source: Based on the financial statements of the research site.
Accordingly, the cause and effect diagram will be relied on to identify the root causes of the problems as follows:
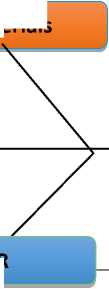
Figure (1): Cause and Effect Analysis Chart (Effect)
Processors Delivery Type
Efficiency training Specialization HR
Materials
Machines and the equipments
The condition
Not updated
Follow up Efficiency Phas
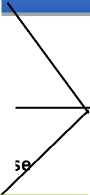
Processes
The problem of high costs, low production, high defects, high inventory of all kinds, low sales, weak competitive
-
Figure (1) shows four main components for the possibility of the emergence of production problems represented by machines and equipment, processes, human resources, raw materials, then the sub-components will be entered for the main reasons as follows:
The first reason: Machines and equipment: In this paragraph, the analysis will be done through the following:
A review of the types, specifications and year of manufacture of the machines used in the production process, as well as the type of product produced by the machine and its measurements, as shown in Table (11) as follows:
ISSN 2790-0169 / E-ISSN 2790-0177
Table (11): Types and specifications of the machines used in the production process.
|
Number of machine s |
Machine type |
Manufacturing year |
Origin |
Product type |
Machine location |
|
|
1 |
5 |
3m width carpet weaving machine with rapier system |
1985 |
Belgian MICHEL VAN DE WIELE |
Baghdad carpet production 25 knots / cm2 |
textile line |
|
2 |
2 |
Carpet weaving machine, width 4m2It works with the rapier system |
1985 |
Belgian MICHEL VAN DE WIELE |
Baghdad carpet production 25 knots / cm2 |
|
|
3 |
2 |
Carpet weaving machine, width 2m2Shuttle system |
1975 |
German textema |
Baghdad carpet production 26 knots / cm2 |
|
|
4 |
2 |
Carpet weaving machine, width 2.5 |
1975 |
German textema |
Babylon carpet production 13.86 |
ISSN 2790-0169 / E-ISSN 2790-0177
|
m2Shuttle system |
knots/cm2 |
|||||
|
5 |
1 |
Carpet weaving machine, width 2m2Shuttle system |
1975 |
German textema |
Babylon carpet production 13.86 knots/cm2 |
|
|
6 |
1 |
Belgian spinning machine |
1990 |
Belgian VAN DE WIELE |
Smoothing the back of the product |
complement line |
|
7 |
1 |
carpet trimmer |
2014 |
German textema |
Carpet face trimming |
|
|
8 |
1 |
Rosary machine |
1984 |
Belgian titan |
Tailoring rosary |
|
|
9 |
1 |
Stitching machine |
1976 |
German union special |
Stitching the hem |
|
|
10 |
1 |
Stitching machine |
2014 |
Taiwan liberty |
Stitching the hem |
Source: Based on the company data
It can be noted from Table (11) that the machines used in the production of carpets are largesized machines with different production measurements. They were introduced for production in p. 87
October, 2022, Baku, ISSUE IV
ISSN 2790-0169 / E-ISSN 2790-0177
the early 1970s and late 1980s. Some of them operate the shuttle system, which is one of the old systems in production imported from the German company TextEma in the early 1970s, including the newer machines operating the Reiber system, which was imported from Michel van de WIELE of Belgium at the end of the 1980s, and its production measurements are 3m-4m-2.5m-2m-2m.
In general, machines with old technology are considered, and most of the industrialized countries of the world today do not use these systems (shuttle system and mechanical engraving system by cartoon). Rather, they use machines with electronic systems and high production capacities and speed and accuracy of control of inscriptions, colours and measurements as well as lack of need for maintenance.
Measuring the capacity of operations: The capacity of operations was measured by dividing the actual production volume of 2020 by the actual capacity of the same year and as in Table 12 below:
Table (12): Measuring the capacity of carpet completion line machines
|
Machine capacity % Actual ÷ scheme |
Planned production capacity For the year 2020 |
Total actual power For the year 2020 |
T |
|
|
1 |
Textile line |
50000 |
1230 |
2.46% |
|
2 |
Completion line |
50000 |
1230 |
Source: Based on company data
Table (12) reveals the decrease in the capacity of the textile line and the completion line, with a capacity of 2.46%. One of the reasons that led to the failure to achieve the plan, which was
ISSN 2790-0169 / E-ISSN 2790-0177
determined during interviews with production engineers, is that the company planned a larger amount Of the actual capacity of its machines. The actual capacity here is only (5%) of the planned 50,000 m2, equivalent to (2500 m2) assuming the use of (7) hours per day and the absence of sudden interruptions as power outages, or maintenance.
-
B) The second reason: operations:
Analysing the processes more clearly will be based on the technological path of the mechanical carpet product will help in identifying activities and problems that affect the production process as well as the type and cost of value and non-value adding activities and as in Figure (2) as follows:
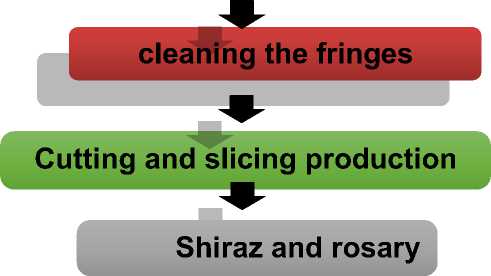
Figure (2): The technological path and the cost of its activities.
Design department
Yarn preparations
Mecha cal weaving

Carpet ringe trimming

I production Brushing and cleaning
I p.
ISSN 2790-0169 / E-ISSN 2790-0177
ecking

Source: Based on the company’s convicted visits
The carpet industry process goes through several stages of production, from the design phase to the numbering and packaging of the product. Table (13) shows the cost of each activity with a definition of value-adding activities and as follows:
Table (13): Cost of production activities
|
Activity name |
Total cost of activities |
Non-adding value |
|
designs |
167,435,666 |
80% 133,948,533 |
ISSN 2790-0169 / E-ISSN 2790-0177
|
preparations |
55,675,021 |
55,675,021 |
|
fabric |
1,106,028,438 |
20% 221,205,688 |
|
nurture |
315,058,851 |
0 |
|
Brushing |
12,602,354 |
4% 12,602,354 |
|
Trimming |
31,505,885 |
10% 31,505,885 |
|
cleaning |
15,752,943 |
5% 15,752,943 |
|
Cutting |
12,042,240 |
12,042,240 |
|
Stitching and rosary |
38,282,964 |
0 |
|
Checking |
32,868,000 |
32,868,000 |
|
Fixing |
126,443,520 |
126,443,520 |
|
Numbering and packaging |
25,318,056 |
0 |
|
Total |
1,879,152,756 |
642,044,184 |
Source: Based on the company’s cost reports
ISSN 2790-0169 / E-ISSN 2790-0177
It can be seen from Table (13) an increase in the costs of activities, as their total cost amounted to (1,879,152,756) dinars, of which (642,044,184) dinars are for the costs of non-value adding activities. These activities, which caused the high cost, were identified during field visits to the company and inquiries directed to production engineers. The checking process is carried out once at the end of the production process, i.e. after the error and defect have occurred and cannot be avoided and therefore the cost of the production is high.
-
C) The third reason: working human resources: The working human resources will be analysed by their numbers, costs, and classifications, as in Table (14).
Table (14): Number, type and cost of manpower in the mechanical carpet factory for the period from 1/1 – 31/12/2020
|
Type |
Number |
Salary |
Percentage |
|
Full-Time Employees |
223 |
1,134,805,287 |
|
|
Contracted Employees |
6 |
25,200,000 |
|
|
Total |
229 |
1,160,005,287 |
|
|
Non-participatants in the process |
160 |
812,003,701 |
70% |
|
Participants in the production process |
69 |
348,001,586 |
30% |
|
Total |
229 |
1,160,005,287 |
100% |
Source: Manpower List for the year 2020.
ISSN 2790-0169 / E-ISSN 2790-0177
The number of workers classified as non-participants in the production process was (160) workers, i.e. 70% of the total workers and at a cost (812,003,701) dinars. This constitutes a burden on the production process, i.e. the existence of a cost that is not offset by benefit and hence a significant increase in the cost of production. In addition, the company appoints employees to the owners of contracts despite a surplus of workers, accounting for (2%) of the total number of employees and at a cost of (25,200,000) dinars.
-
D) Fourth reason: Raw materials: Through field visits to technical laboratories to determine the efficiency of raw materials, it was found that the yarn used to produce carpets with different lengths. Also, cutting the upper and lower carpets on the fabric machine leads to the fall of loose bristles on the surface of the two carpets produced and more on the lower carpet. The release of short bristles depends on the type of yarn, especially the specification of softness, the length of the bristle as well as the number of suitable bristles for yarn and the type of yarn technology. Another major reason for the higher production cost was the purchase and storage of large quantities of yarn in the company’s warehouses, a large proportion of which was damaged by poor storage. Table (15) shows the cost of raw materials and as follows:
-
4.3 The stage of improvement :
Table (15): Raw materials supply cost
|
Directory no. |
Warehouse type |
The cost in dinars |
Change amount in Dinar |
|
|
Year 2019 |
Year 2020 |
|||
|
131 |
Raw materials and raw materials |
3,091,141,35 0 |
3,444,593,134 |
353,451,784 |
Source: Based on the company’s financial statements
It can be seen from Table (15) that the cost of raw materials supply increased, as it reached (3,444,593,134) dinars and (3,091,141,350) dinars for the years 2020 and 2019 respectively with an increase for the year 2020 of (353,451,784) dinars. This indicates the company’s
ISSN 2790-0169 / E-ISSN 2790-0177
reliance on the traditional methods of the cost accounting system and the failure to apply modern methods of timely purchasing. This results in a waste of resources as a result of storing large quantities, and the damage of a large part of them resulting from the lack of a sound storage environment.
It includes developing solutions to the problems that the company suffers from depending on the results of the analysis stage and by linking the causes and roots of the problem to the appropriate solutions to it as follows:
Introducing modern manufacturing technology through the purchase of (3) textile machines with the following specifications:
Two modern weaving machines type (RCE02 – 400) with a production width of (4 m2), to produce patterned carpets of multiple colours and with various types of yarn (polypropylene – acrylic – wool) and with a 2-stroke (1/2 V) textile structure.
A Modern fabric machine (RCI 03-400) (1) with a production display (4 m2) of carpet of different yarns (polypropylene – acrylic – wool), in colours and structure of nuclei 3 run (2/3 v).
The machines should be of a reliable European origin. This is because the technology of carpet manufacturing is a specialized technique, and that the use of approved weaving machines from these sources will be more efficient in terms of production, maintenance costs, operation and consumption, as well as the useful life of the machine.
As for the technical specifications of the machine type (RCE02 – 400) and type (RCI 03-400), they run as follows:
The possibility of forming a variety of textile structures and multiple options in terms of accuracy, textile smoothness, and weight per square meter instead of a fixed weight and textile composition. This is in addition to an advantage in production speed compared to the machines currently used.
ISSN 2790-0169 / E-ISSN 2790-0177
The design is based on electronic systems (software) that works with a multi-coloured engraving that adds beauty and clarity of details in the patterns of the produced carpets with the speed of completion of designs unlike the approved machines that work with the mechanical jacquard system, which is riddled with malfunctions.
It operates with a central control panel that controls all functions, i.e. the examination is carried out during the production process. This helps to avoid defects before they occur, unlike the used machines, which are checked at the end of the production process.
Cutting the hem is done automatically and regularly instead of the approved mechanism for cutting the hem manually, which causes problems in terms of inaccuracy and regularity of measurements.
It can be seen from the above that the Six-Sigma method contributed to identifying the root causes that were represented by the presence of non-value adding activities that affected the quality, cost, time, customer satisfaction and developing appropriate solutions to eliminate them. Table (16) illustrates this.
Table (16): Classification and measurement of costs of activities.
|
Activity name |
Non-adding value |
adding value |
Total cost of activities |
|
Designs |
80% 133,948,533 |
20% 33,487,133 |
167,435,666 |
|
preparations |
55,675,021 |
0 |
55,675,021 |
|
fabric |
20% 221,205,688 |
80% 884,822,750 |
1,106,028,438 |
ISSN 2790-0169 / E-ISSN 2790-0177
|
nurture |
0 |
255197669 |
315,058,851 |
|
Brushing |
4% 12,602,354 |
0 |
12,602,354 |
|
Trimming |
10% 31,505,885 |
0 |
31,505,885 |
|
cleaning |
5% 15,752,943 |
0 |
15,752,943 |
|
Cutting |
12,042,240 |
0 |
12,042,240 |
|
Stitching and rosary |
0 |
38,282,964 |
38,282,964 |
|
Checking |
32,868,000 |
0 |
32,868,000 |
|
Fixing |
126,443,520 |
0 |
126,443,520 |
|
Numbering and packaging |
0 |
25,318,056 |
25,318,056 |
|
Total |
642,044,184 |
1,237,108,572 |
1,879,152,756 |
It can be seen from Table (16) that the costs of non-value adding activities have increased, reaching (642,044,184) dinars, which is equivalent to (34%).
-
4.4 Control stage :
ISSN 2790-0169 / E-ISSN 2790-0177
It is a continuous stage that the company must be keen to implement in every joint of the production process in order to discover deviations and predict them before they occur to ensure that the necessary precautions are taken and any problem is addressed as soon as it occurs, that is, to avoid the error before it occurs and this is what the Six-Sigma method seeks through working methodology.
From the foregoing, the effect of the Six-Sigma method on production activities can be shown by improving the quality of production processes by excluding value-adding activities and have a significant impact on the cost of carpets, as shown in Table (17) as follows:
Table (17): The effect of applying the Six-Sigma method on the cost of production
|
Activities |
Activities costs |
Activities costs |
|
Before applying the Six- |
After applying the Six-Sigma |
|
|
Sigma method |
method |
|
|
designs |
167,435,666 |
33,487,133 |
|
preparations |
55,675,021 |
|
|
fabric |
1,106,028,438 |
884,822,750 |
|
nurture |
315,058,851 |
255197669 |
|
brushing |
12,602,354 |
|
|
trimming |
31,505,885 |
|
|
cleaning |
15,752,943 |
|
|
cutting |
12,042,240 |
ISSN 2790-0169 / E-ISSN 2790-0177
|
Stitching and rosary |
38,282,964 |
38,282,964 |
|
checking |
32,868,000 |
|
|
fixing |
126,443,520 |
|
|
Numbering and packaging |
25,318,056 |
25,318,056 |
-
5. Conclusions and Recommendations
-
5.2 Recommendations
ISSN 2790-0169 / E-ISSN 2790-0177
The conclusions
The factory still depends on machines with outdated production systems that countries in the developed world no longer use.
The high percentage of defects per unit is offset by a significant decrease in the accuracy of operations and a low level of performance in which the company operates.
Existence of non-value adding activities that contribute to raising production costs.
The decrease in the number of participants in the production process with an increase in the number of workers classified among the non-participants in the production process, that is, the existence of a cost that is not matched by a benefit, and hence a significant increase in production costs.
The high cost of the stock of raw materials as a result of the company’s reliance on the traditional methods of the cost accounting system, which results in a waste of resources as a result of the grief of large quantities, and the damage of a large part of it resulting from the lack of a sound storage environment
Introducing modern technology in the Iraqi carpet industry by adopting machines with advanced systems.
Improving the accuracy of operations to contribute to reducing the number and proportion of the diffraction and in accordance with the distance level of the Iraqi mechanical carpet laboratory.
Working on eliminating non-value-adding textile activities.
Reorganizing and distributing the human resources working in the mechanical carpet factory. This includes everyone's contribution to the production process, each according to his/her specialization.
Reducing supply costs by applying modern methods of on-time purchasing.
