The Effects of Beta-I and Fractal Dimension Neurofeedback on Reaction Time

Author: Reza Yaghoobi Karimoi, Azra Yaghoobi Karimoi
Journal: International Journal of Intelligent Systems and Applications(IJISA) @ijisa
Article in issue: 11 vol.6, 2014.
Free access
In this paper, we evaluate the effects of neurofeedback training protocols of the relative power of the beta-I band and the fractal dimension on the reaction time of human by the Test of Variables of Attention (TOVA) to show which of these two protocols have the great ability for the improving of the reaction time. The findings of this research show that both protocols have a good ability (p < 0.01) to improving of the reaction time and can create the significant difference (as mean dRT = 37.3 ms for the beta-I protocol and dRT = 19.6 ms for the fractal protocol) in the reaction time. Of course, we must express, the Beta-I protocol has the more ability to improving of the reaction time and it is able to provide a faster reaction time.
Neurofeedback, Reaction Time, Test of Variables of Attention (TOVA), Electroencephalogram, Relative Beta-I Power, and Fractal Dimension
Short address: https://sciup.org/15010625
IDR: 15010625
Text of the scientific article The Effects of Beta-I and Fractal Dimension Neurofeedback on Reaction Time
Published Online October 2014 in MECS
Quality of individual’s performance depends on the way of his interaction with environment and the amount of mastery on his tasks. In addition, it seems that these two factors depend on the individual's behaviors, and their correction can improve the individual's behaviors. Hence, researchers [1-4] using different indexes such as reaction time and error rate are trying to correct these factors. The reaction time is an important index that is usually used in the tests of human performance such as Simple Reaction Time test (SRT) [5], Diagnostic Reaction Time test (DRT), Choice Reaction Time test (CRT) [5, 6], Continuous Performance Task (CPT) [7], Test of Variables of Attention (TOVA) [8, 9], Attention Network Test (ANT) [9-11] and Wisconsin Card Sorting Test (WCST) [1]. In fact, this index is applied for measuring the amount of normality (e.g. addiction [12, 13]), intelligence [14], memory [15, 16], speed of decision-making [17], attention and concentration [7, 8], and level of alertness [18]. In result, the providing an efficient method for correction of the reaction time can make a big change in human behavior.
One of these efficient methods is the training of human brain (or natural neural network) [7, 8, 19] that is able to change the reaction time. Of course, remember that learning of the natural neural network is a complex problem, and depends on the training method. Therefore, development a training method compatible with the natural neural network can create an outstanding transformation in this field. Hence, we need to a suitable model from the natural neural network! which it seems that artificial neural networks (ANN) are the best case for this model.
Scrutiny of the ANN [20] shows that these networks needs to repetitive information and constant for the learning. In fact, they use a train set, while this set is constant during training [20]. Therefore, the repetitive information and constant is essential for ANNs learning process. Also, remember that the ANNs are the primitive structure type from the natural neural networks. Therefore, it seems that above-mentioned training procedure is a good theory for training of the natural neural networks. Now, one method that can actualize this theory is neurofeedback, which could offer the significant results [7, 8, 19, 21] for the decrease of the specific indexes such as the reaction time.
The conducted researches [7, 22] in attention and concentration field especially in children with attention deficit hyperactivity disorder (ADHD) show that the energy of EEG bands (delta, theta, alpha, and beta) has significant different compared to normal children. In other words, the energy amplitude of the delta and theta band in the ADHD children is comparatively higher than that in the normal children while the energy amplitude of the alpha and beta band in the ADHD children is comparatively lower than that in the normal children [23, 24]. In the other, the studies [8] in the neurofeedback field for the increase of attention show the training of beta-I band power can provide a faster reaction time compared to other protocols such as the training of SMR band. Hence, researchers believes this band have an acceptable correlation with the reaction time [8].
Some other of the researches [25, 26, 27] in neurofeedback field for improving of the brain-computer interfaces (BCI) and the data-mining on the ADHD children show that fractal dimension of EEG signal have a good relationship with attention and concentration, and that the fractal dimension reduced in brain signals of the ADHD children.
According to above studies, both the beta-I band power and the fractal dimension have the adequate correlation to the reaction time and they are able to the improving of attention and concentration in human. Therefore, in this work, we using neurofeedback training of these two quantities check the change rate of reaction time after a training course. In fact, we are going to know, is brain able to control these quantities (Relative Power of the Beta-I Band and Fractal Dimension)? Are these quantities can adjust the brain function for the improving of the reaction time? How much is amount of improving of the reaction time for each these quantities? To this end, we will focus on the processing of TOVA data of before and after neurofeedback training for two groups: beta-I and fractal dimension.
-
B. Data acquisition
A neurofeedback training course depends on conditions and the amount of research precision can be included the different steps of the data acquisition. Nevertheless, for various reasons is usually reduced these steps by prober.
A neurofeedback training course in this study was included three steps: 1) testing by TOVA 2) training by neurofeedback 3) testing by TOVA, which its details are in Fig. 3. As seen in the figure the subjects (depend on their groups) were trained for 12 sessions of 15 minutes after testing by the TOVA. Upon completion of the neurofeedback training sessions in thirteenth session again by TOVA were tested the subjects .
II. M ATERIALS AND METHODS
A. Subjects
ME ≈ AF
MH ≈ HN
MG ≈ MS
MR ≈ LH
Fractal group
Beta-I group
MM ≈ MF Mean
LH
Fig. 1. The score T of Global Severity Index (GSI) for subjects of two groups: beta-I and fractal dimension.
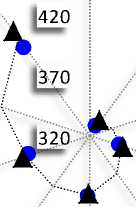
Fig. 2. The regimentation of the participants into two groups of five persons according to the reaction time index of TOVA recorded before the neurofeedback training.
Subject
Subject
Evaluate reaction time
Fractal group Beta-I group
Number of sessions: 12
Training time per session:
Total: 15 min
First half: 7.5 min
Second half: 7.5 min
Neurofeedback learning
For regimentation of the participants into two groups of five persons, and make the same conditions between participants of the two groups from the reaction time index of Test of Variables of Attention (TOVA) was recorded before the neurofeedback training has been used. This regimentation method (Fig. 2) causes the subjects with the reaction times close together do not place in a group. Generally, we named these groups as following: 1) the neurofeedback training protocol of the relative power of beta band-I (band-I group), 2) the neurofeedback training protocol of the fractal dimension (fractal group).
The number of sessions per week: 3
Beta-I protocol
Beta-I band: 12-18 Hz
Fractal protocol
Higuchi method [30] Kmax: 10
Fig. 3. A neurofeedback training course
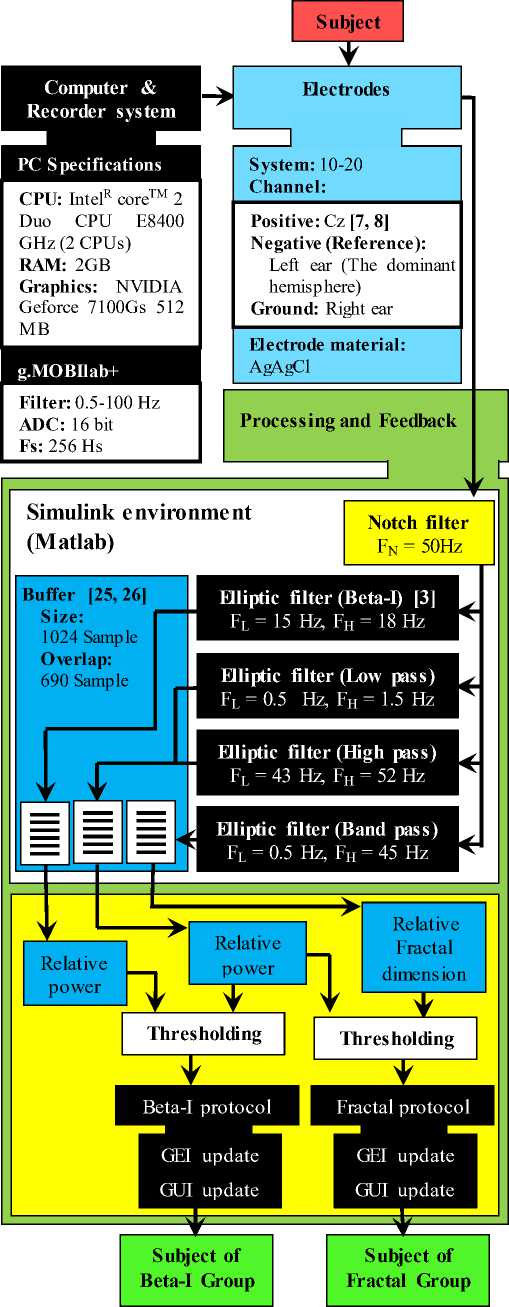
Fig. 4. The Neurofeedback System
-
C. Visual Test of Variables of Attention (V-TOVA)
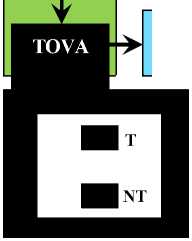
The reaction time is a measurable index that usually for evaluation of the attention changes is used. Currently, this index by continuous performance tests is measured. A simplified type of the continuous performance tests is Visual Test of Variables of Attention (V-TOVA) [8, 31] that it is a useful clinical tool to test the hyperactivity [32]. The V-TOVA is a computerized visual go/no-go task (Fig. 3), which is included two types the non-alphanumeric stimulus: 1) Target (T-square), which subject should answer to the stimulus by pressing a special key, 2) NonTarget (NT-square), which subject should not answer to the stimulus.
Generally, in two steps (four quarters) is recorded the V-TOVA. Table 1 shows the stimuluses distribution of the target and the non-target of the V-TOVA that we used for this study. The first step of the V-TOVA measures the reaction time of subject. Therefore, the ratio of target to non-target in the quarters of first step is 1 to 3.5. The second step of the V-TOVA measures impulsivity of the subject and the ratio of target to non-target in the quarters of it is 3.5 to 1.
Table 1. the stimuluses distribution of the target and the non- target to Visual test of Variables of Attention
|
Steps |
First |
Second |
|||
|
Quarters |
First |
Second |
Third |
Fourth |
Total |
|
Target |
36 |
36 |
126 |
126 |
324 |
|
Non-target |
126 |
126 |
36 |
36 |
324 |
|
Time (min) |
5.4 |
5.4 |
5.4 |
5.4 |
21.6 |
|
Index |
Reaction time |
impulsivity |
|||
-
D. Neurofeedback system
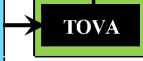
Fig. 4 shows the diagram block of our neurofeedback system. This system is included two parts: 1) Hardware part for the brain signal (Cz channel) acquisition 2) Software part for processing, thresholding, and feedback. As seen in this figure, the EEG signal of Cz channel is acquired by a g.MOBIlab+ 1 recorder, first. Then, the feedback quantity (the relative power of the beta-I band or the fractal dimension) is calculated to each subject depends on his group. Finally, this quantity and threshold are displayed as a visual feedback to the subject. Fig. 5 shows the visual feedback used in this study, which it includes a yellow index (the feedback quantity) and a green index (threshold) and a film.
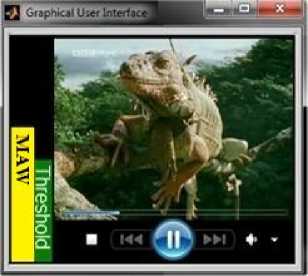
Fig. 5. The visual feedback or graphical user interface (GUI)
The yellow index is proportional to the changes in brain functions of the subject and green index by training providers is determined. Hence, the subjects in both the beta-I and fractal group had to keep the yellow index higher than the determinate threshold during the training sessions. In the other words, the subjects of beta-I group had to increase the relative power of the beta-I band and the subjects of fractal group had to increase the fractal dimension of the EEG signal .
-
E. Moving Average Window (MAW) and Thresholding
Thresholding method in this work is based on the brain's ability to increase the feedback quantity. As seen in Fig. 6, the MAW signal by the mean of sliding window values of 120 samples on feedback quantity is produced (Fig. 6a). So, the 30 seconds (120 samples or first window) after the start of the training session is calculated the percentage of the MAW signal that has been higher than the initial threshold (Fig. 6b). This percentage for the sliding window is successively calculated, and it as a number on the graphical expert interface is displayed (GEI). Therefore, the training providers can adjust the threshold using this percentage.
Overall, the experimental values of the thresholding values during training show 60% for the threshold approximately equal to the brain power of subject for the increase of the feedback quantity in each session. In fact, a higher threshold (above 60%) take the more power from brains that causes fatigue, lack of attraction and the reduction the subject's motivation for learning. The other hand, a lower threshold (down 60%) takes the less power from brains. In this case, the training would be futile.
a
CD
CD CD
5 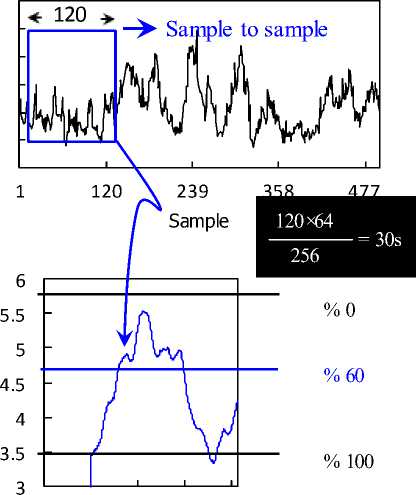
1 120 239 358 477
b
Sample
Fig. 6. Thresholding: a) the feedback quantity and the sliding window of 30 seconds, b) Moving average window (MAW) and Threshold
-
F. Standard Scores
In some of the cases cannot show a raw quantity as direct or compare it. Because, the mendacious changes (very large or small changes) of the raw quantity causes parasite in the comparison and the showing of the raw data. Also, the comparison of the raw quantities with different reference is difficult. So, we need to the standard scores such as Z and T score. These standard scores are able to show position of the raw quantity then a certain mean.
Z score
Z score is a standard scores that it show the raw quantify deviation from the its mean. So, if the raw quantify vector is X = {x1, x2, …, xn}, and its mean and standard deviation are µ and σ respectively. Then, Z score is equal to:
z = X - ^
a
T score
The Z score is positive, negative, and decimal . Then still, the understanding and interpretation of these scores is difficult. T score is able to lessen these problems. To this end, a fixed number (S) is multiplied the Z scores for delete digits after two decimal points. Finally, it is summed a fixed number (M) for remove the negative sign. Therefore, the T score is equal to:
T = SZ + M
In this work, the S and the M are equal to 10 and 50 respectively.
Table 2. The results of reaction time (RT) and reaction time variability (RTV) extracted the TOVA data of before and after a neurofeedback training course.
|
RT (ms) |
RTV (ms) |
|||||
|
Beta-I Group |
||||||
|
Subject |
Before |
After |
Diff (RT) |
Before |
After |
Diff (RTV) |
|
MG |
329.2 |
308.9 |
20.4 |
2.32 |
1.22 |
1.10 |
|
MM |
370.2 |
346.1 |
24.2 |
4.62 |
2.95 |
1.67 |
|
MR |
346.0 |
318.1 |
28.0 |
4.67 |
2.21 |
2.46 |
|
ME |
371.6 |
335.2 |
36.6 |
3.61 |
1.31 |
2.30 |
|
MH |
409.5 |
332.1 |
77.4 |
6.63 |
3.25 |
3.38 |
|
Mean |
365.3 |
328.0 |
37.3 |
4.40 |
2.21 |
2.18 |
|
Fractal Group |
||||||
|
Subject |
Before |
After |
Diff (RT) |
Before |
After |
Diff (RTV) |
|
AF |
377.1 |
373.7 |
3.4 |
4.00 |
2.13 |
1.87 |
|
LH |
349.8 |
344.9 |
4.9 |
1.47 |
2.19 |
-0.72 |
|
MS |
334.8 |
326.3 |
8.6 |
2.88 |
1.08 |
1.80 |
|
MF |
367.6 |
334.4 |
33.2 |
3.49 |
1.56 |
1.93 |
|
HN |
427.0 |
379.3 |
47.7 |
9.08 |
3.47 |
5.61 |
|
Mean |
371.3 |
351.7 |
19.6 |
4.18 |
2.08 |
2.10 |
its new average. In front, the changes of commission and omission error in table 3 were less than the RT and the
Table 3. The results of the commission and the omission error extracted the TOVA data of before and after a neurofeedback training course.
Commission error Omission error
|
Beta-I Group |
||||||
|
Subject |
Before |
After |
Diff (RT) |
Before |
After |
Diff (RTV) |
|
MG |
4.17 |
4.17 |
0 |
2.33 |
0 |
2.33 |
|
MM |
2.78 |
4.17 |
-1.39 |
0 |
0 |
0 |
|
MR |
2.78 |
2.78 |
0 |
0 |
0 |
0 |
|
ME |
5.56 |
0 |
5.56 |
0 |
0 |
0 |
|
MH |
0 |
0 |
0 |
0 |
0 |
0 |
|
Mean |
3.06 |
2.22 |
0.83 |
0.47 |
0 |
0.47 |
|
Fractal Group |
||||||
|
Subject |
Before |
After |
Diff (RT) |
Before |
After |
Diff (RTV) |
|
AF |
6.94 |
1.39 |
5.56 |
0 |
0 |
0 |
|
LH |
6.94 |
2.78 |
4.17 |
0 |
0 |
0 |
|
MS |
5.56 |
0 |
5.56 |
0 |
0 |
0 |
|
MF |
0 |
0 |
0 |
0 |
0 |
0 |
|
HN |
8.33 |
2.78 |
5.56 |
0 |
1.39 |
-1.39 |
|
Mean |
5.56 |
1.39 |
4.17 |
0 |
0.28 |
-0.28 |
RTV and almost are negligible.
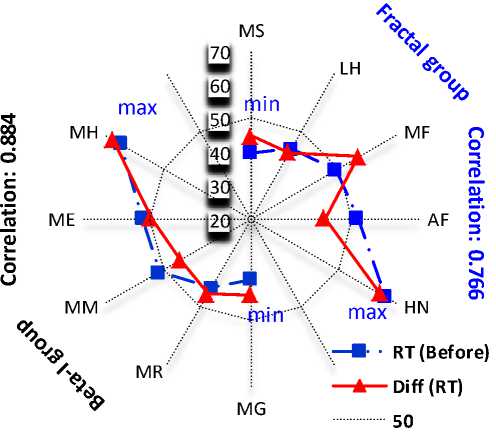
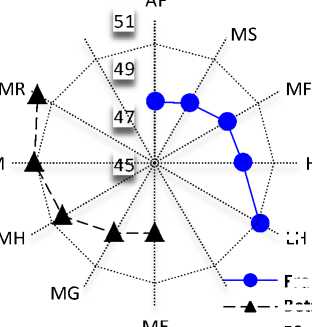
Fig. 7. The T score of the initial reaction time and the difference of the reaction time for after a neurofeedback training course
-
III. E XPERIMENTAL R ESULTS
As explained in section II. B, a part of collected data is related to the testing of two protocols of neurofeedback training. Hence, in this paper, we will focus on the processing of TOVA data.
Fig. 7 shows the T score of initial reaction time (IRT) and difference of the reaction time (DRT) for the subjects of the two groups. Similarly, Fig. 8 shows the T score of initial reaction time variability (IRTV) and difference of the reaction time variability (DRTV) for the subjects of the two groups. These figures show the amount of the created difference in the RT and the RTV depend on the IRT and the IRTV of the subjects. In fact, the subjects that have a slower IRT can improve their RT more than subjects that have a faster IRT. In the other hand, the comparison of the charts in these figures show that correlation (Pearson) of the DRT and the RT for the beta-I group (Corr = 0.884) is more than the fractal group. In front, the comparison of the DRTV and RTV show that correlation of the DRTV and the RTV for the fractal group (Corr = 0.969) is more than the beta-I group.
Table 2 shows the reaction time (RT) and the reaction time variability (RTV), and table 3 shows commission (errors resulting from responding to non-target) and omission error of the TOVA data for two groups. The values of the table 2 show that the reaction time for subjects of two groups were significant (p < 0.01). Of course, this difference in Beta-I group was greater (dRT = 37.3 ms). In other hand, the reaction time variability had decrease in each two groups. This means that subjects had a good focus on their new reaction times and that they could decrease the reaction time fluctuations around
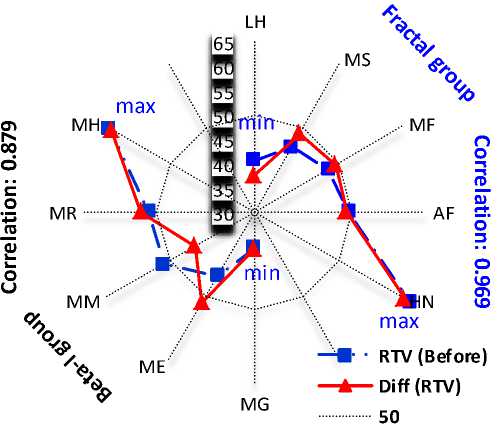
Fig. 8. The T score of the initial reaction time variability and the difference of the reaction time variability for after a neurofeedback training course.
-
IV. D ISCUSSION
Many studies have been conducted using neurofeedback to increase reaction time especially for the ADHD patients . According to current research findings and experiences in the field of the neurofeedback, we like to remind the following research:
-
1) Egner and et al. [8] in part of their work compare the influence amount of neurofeedback training protocols: the sensor motor rhythm (SMR) and beta-I on the reaction time. In this work, they expressed the changes of the reaction time only in beta-I group was
significant (p = 0.01). Also, they reported a significant margin (p = 0.05) for the reaction time variability of the two groups, and that the reason for this margin was the neurofeedback training. Finally, they reported a faster reaction time for the beta-I protocol.
-
2) Qiang and et al. [25, 26, 27] suggested a Brain
Computer Interface (BCI) based on game and using neurofeedback-training protocols of the fractal dimension. In this study, the fractal dimension of a hard-filtered signal (2-42 Hz) after thresholding as a game is provided to subjects. Finally, they express the concentration level has a good relationship with the reaction time and almost all subjects can recognize two states: concentration and relaxation.
-
3) Bashashati and et al. [33] use the theta band power and the fractal dimension of the EEG for the neurofeedback training. In sum, they express the fractal dimension can be controlled by a person and used in brain computer interface systems.
Howbeit, the results of above researches were promising. Nevertheless, the papers that used the fractal dimension were conducted for specific purposes such as BCI. Therefore, they just are able to answer to a question. Is brain able to control the Fractal Dimension of the EEG? But, they are not able to answer, which are the Fractal Dimension of the EEG in a biofeedback can adjust the brain function for the improving of the reaction time? Then, we cannot generalize these results for neurofeedback training. In the other hand, the
Egner, his colleagues and some other researchers [34] could answer that the brain not only can control the Relative Power of the Beta-I Band of the EEG, rather the Relative Power of the Beta-I Band of the EEG in a biofeedback can adjust the brain functions for the improving of the reaction time.
In this work, we tried to show that the brain is able to control both the Fractal Dimension and the Relative Power of the Beta-I Band of the EEG. Also, we show that both Fractal Dimension and the Relative Power of the Beta-I Band of the EEG are able to adjust the brain functions for the improving of the reaction time. In addition, we could answer to another question. How much is amount of improving of the reaction time for each these training protocols? Answer of this question provided in section III.
-
V. C ONCLUSION
Reviews of previous researches show that neurofeedback is a way to improve human behaviors. Hence, the comparison and correction of training protocols in this field can be a great help to improve indexes depend on the human behaviors such as the reaction time. So, we in this study tried to analyze the TOVA data of before and after neurofeedback training for two group: the beta-I and the fractal dimension. As a whole, the findings of this study show that both the neurofeedback-training protocols can improve the reaction time. Of course, the beta-I protocols can provide a faster reaction time, which its reason is related to the Relative Power of the beta-I. In fact, this feature has a partial view of the signal. With this vision, the returned (feedback) information to the brain is more constant and more repetitive. In front, the fractal dimension has a whole view of the signal. With this vision, Replication and stability of the feedback information are not completely guaranteed. Therefore, it seems that the constant and repetitive information is a good theory for the neurofeedback. According to this, we hope we can prove this theory in the next studies by analyzing the EEG signals achieved in the neurofeedback-training step.
References The Effects of Beta-I and Fractal Dimension Neurofeedback on Reaction Time
- Wang L, Kakigi R and et al. Neural activities during Wisconsin Card Sorting Test MEG observation. Cognitive Brain Research. 2001. 12(1): 19-31.
- Missonnier P, Hasler R and et al. EEG anomalies in adult ADHD subjects performing a working memory task. Neuroscience. 241(0): 135-146.
- Gooch D, Snowling M J and et al. Reaction Time Variability in Children with ADHD Symptoms and/or Dyslexia. Developmental Neuropsychology. 2012. 37(5): 453-472.
- Antonini T N, Narad ME and et al. Behavioral correlates of reaction time variability in children with and without ADHD. Neuropsychology. 2013. 27(2): 201-209.
- Stuss D T, Stethem L L and et al. Reaction time after head injury: fatigue, divided and focused attention, and consistency of performance. Journal of Neurology, Neurosurgery & Psychiatry. 1989. 52(6): 742-748.
- Donoghue O A, Horgan N F and et al. Association Between Timed Up-and-Go and Memory, Executive Function, and Processing Speed. Journal of the American Geriatrics Society. 2012. 60(9): 1681-1686.
- Cho B H, Kim S and et al. Neurofeedback training with virtual reality for inattention and impulsiveness. Cyberpsychology & behavior : the impact of the Internet, multimedia and virtual reality on behavior and society. 2004. 7(5): 519-526.
- Egner T and Gruzelier J H. EEG Biofeedback of low beta band components: frequency-specific effects on variables of attention and event-related brain potentials. Clinical Neurophysiology, 2004. 115(1): 131-139.
- Berger I and Cassuto H. The effect of environmental distractors incorporation into a CPT on sustained attention and ADHD diagnosis among adolescents. Journal of Neuroscience Methods. 2014. 222(0): 62-68.
- Fan J, McCandliss B D and et al, Testing the Efficiency and Independence of Attentional Networks. Journal of Cognitive Neuroscience, 2002. 14(3): 340-347.
- Jeffrey W M, Lawrence MA and et al. Appraising the ANT: Psychometric and theoretical considerations of the Attention Network Test. Neuropsychology. 2011. 24(5): 637-651.
- Arcurio L R, Finn P R and et al. Neural mechanisms of high-risk decisions-to-drink in alcohol-dependent women. Addiction Biology: 2013. 1-17.
- Dalley J W, Everitt B J and et al. Impulsivity, Compulsivity, and Top-Down Cognitive Control. Neuron. 2011. 69(4): 680-694.
- Iuculano T, Lee M R and et al. Brain Organization Underlying Superior Mathematical Abilities in Children with Autism. Biological Psychiatry. 2014. 75(3): 223-230.
- Wang J R. and Hsieh S. Neurofeedback training improves attention and working memory performance. Clinical Neurophysiology. 2013. 124(12): 2406-2420.
- Escolano C, Aguilar M and et al. EEG-based upper alpha neurofeedback training improves working memory performance. in Engineering in Medicine and Biology Society, EMBC, 2011 Annual International Conference of the IEEE. 2011. 2327 – 2330.
- Rüter J, Sprekeler H end et al. The silent period of evidence integration in fast decision making. PloS one. 2013. 8(1): e46525.
- Nieuwenhuis S and Kleijn R. The impact of alertness on cognitive control. Journal of Experimental Psychology: Human Perception and Performance. 2013. 39(6): p. 1797-1801.
- Steiner N J, Frenetteet E C and al. Neurofeedback and Cognitive Attention Training for Children with Attention-Deficit Hyperactivity Disorder in Schools. Journal of Developmental & Behavioral Pediatrics, 2014. 35(1): 18-27.
- Gupta M M, Jin L and et al. In Static and Dynamic Neural Networks. John Wiley & Sons, 2005.
- Jasinska A J, Steina E A and et al. Factors modulating neural reactivity to drug cues in addiction: A survey of human neuroimaging studies. Neuroscience & Biobehavioral Reviews. 2014. 38(0): 1-16.
- Ogrim G, Kropotov J and et al. The quantitative EEG theta/beta ratio in attention deficit/hyperactivity disorder and normal controls: Sensitivity, specificity, and behavioral correlates. Psychiatry research. 2012. 198(3): 482-488.
- Woltering S, Jung J and et al. Resting state EEG oscillatory power differences in ADHD college students and their peers. Behavioral and brain functions : BBF, 2012. 8: 1-9.
- Yener G G and Basar E. Brain oscillations as biomarkers in neuropsychiatric disorders: following an interactive panel discussion and synopsis. Supplements to Clinical neurophysiology. 2012. 62: 343-363.
- Wang Q, Sourina O and et al. Fractal dimension based neurofeedback in serious games. The Visual Computer. 2011. 27(4): 299-309.
- Van Der Laan L, Van Spaendonck K and et al. The Symptom Checklist-90 Revised Questionnaire: No Psychological Profiles in Complex Regional Pain Syndrome-Dystonia. Journal of Pain and Symptom Management, 1999. 17(5): 357-362.
- Derogatis L R. SCL-90-R: Symptom Checklist-90-R : Administration, Scoring, and Procedures Manual. NCS Pearson. 1996.
- Higuchi T. Approach to an irregular time series on the basis of the fractal theory. Physica D: Nonlinear Phenomena. 1988. 31(2): 277-283.
- Robert A L, Greenberg L. M. and et al. T.O.V.A.® Professional Manual: Test Of Variables of Attention Continuous Performance Test. 2007: 1-108.
- Forbes G B. Clinical utility of the test of variables of attention (TOVA) in the diagnosis of attention-deficit/hyperactivity disorder. Journal of Clinical Psychology, 1998. 54(4): 461-476.
- Bashashati A, et al. Fractal dimension-based EEG biofeedback system. in Engineering in Medicine and Biology Society, 2003. Proceedings of the 25th Annual International Conference of the IEEE. 2003. 3: 2220 – 2223.
- Bakhshayesh A, Hänsch S and et al. Neurofeedback in ADHD: a single-blind randomized controlled trial. European Child & Adolescent Psychiatry. 2011. 20(9): 481-491..
