The Effects of "Preferentialism" on a Genetic Algorithm Population over Elitism and Regular Development in a Binary F6 Fitness Function

Author: Julia Naomi Rosenfield Boeira
Journal: International Journal of Intelligent Systems and Applications(IJISA) @ijisa
Article in issue: 9 vol.8, 2016.
Free access
Mating preferentialism among animals is the natural form of elitism that has a higher genetic variance and a shorter number of interactions. This concept refers to fact that most animals cannot breed indefinitely – this is the case of elitism - and suffer DNA degradation. In this paper, two types of preferentialism were analyzed (mutation and second best); in both cases we found evidence of improvements over no-preferentialism or elitism. The best number of generations for preferentialism was determined to be 5, from a group of 3 to 20, with the smallest average of iterations and the most consistent average fitness. A sequencing of 0 to 7 was selected and used in association with mutation preferentialism in order to determine the best number of generations. In the case of BinaryF6, mutation preferentialism has a higher average best fitness (ABF) (0.9986) and a lower number of interactions (2259). Second best preferentialism has a better average last fitness (ALF) (0.6070) and a little higher number of interactions (3956). These results reveal that the two suggested form of preferentialism exhibit significant improvements in terms of time and result quality when they are compared with elitism (ABF of 0.9981, ALF of 0.6005 and an average number of interactions of 18197) or with no-preferentialism (ABF of 0.9982, ALF of 0.5177 and average number of interactions of 181088.
Genetic Algorithms, Preferentialism, Elitism, BinaryF6, Natural Elitism
Short address: https://sciup.org/15010856
IDR: 15010856
Text of the scientific article The Effects of "Preferentialism" on a Genetic Algorithm Population over Elitism and Regular Development in a Binary F6 Fitness Function
Published Online September 2016 in MECS
In many animals, male success in mating is strongly dependent on their rank dominance over other members of their group. Elements as their ability to fight [1], their reproductive routines [2], their kin selection [3] and their singing for territorial gain and aggressive show [4]. Many females can copulate with numerous males and generate an offspring only with those males they consider the most fitted [5]. In chimpanzees (Pan Troglodytes), male preference for mating is oriented towards older females. This behavior was explained by Muller as a consequence of a lack of long-term relations and menopause in females, despite their promiscuous activities [6]. Male competition among elephant seals is dependent on (i) the number of males present, (ii) the number of females in the harem, (iii) the copulation frequency, (iv) the existence of three consecutive generations of dominant breeding and (v) the occurrence of low lifespan after the breeding age [7]. Socially dominated dwarf mongooses usually don’t breed (lower fitness), leaving reproduction to the most dominant mongooses (higher fitness) [8]. Studies suggest that reproduction can be costly, especially for females [9], resulting in short term elitism among animals [10].
Pathological inflammation is controlled by a limited network of immune genes. The effects of a pathology such as the chronic inflammatory and autoimmune diseases have a negative effect in the reproductive fitness [11]. When the genome is imprinted from a crossing-over of one generation to the other [12], the immune genes are passed to the next generation, resulting in a low reproductive fitness [12, 11].
The evolutionary algorithms were inspired by the biological aspects and helped to formulate a special class called genetic algorithm (GA) [10]. Most GAs were derived from the analysis of the bacterial reproductive behavior and of the natural selection fitness to which bacteria are subjected [13] [14] and of the binary bee colony [15]. Nowadays, GAs have been split in many fields, of which the most important are (i) the engineering tools and (ii) the research of scientific models of evolutionary process [16] [17].
The bacteria foraging optimization algorithm (BFOA) assumes that the less healthy or fitted bacteria will die and the more healthy or fitted will split in two. Therefore, those healthy bacteria will gain a selective advantage of reproduction over the less healthy ones [13]. BFOAs and GAs are specially used for optimization problems, specially for structural and economics optimization and for allocation and location problems [14]. Elitism is a method inspired in the dominant animal system; it preserves the most fitted individual to the successive generations until a more fitted appears. The problem with this method is that elitism has a slow variance development, which may require more time to find the optimal solution. However this method assures an increased fitness growth [18] [19] [10, 16].
-
II. T HEORY
Genetic algorithms are based on the system theory of evolution, a theory according to that each individual is a particular chromosome and is part of an environment which includes other individuals. In this system the crossing-over selection can be distributed among all individuals, but the preferentialism and the elitism hypotheses guarantee that at least one special individual will be selected [20] [21] [22]. This process of selection is conducted by a fitness function (1).
The most common representation of genes is the binary genes combination for a specific chromosome [23] [24]. The Binary F6 function is a simple function of a set population of chromosomes with 44 binary genes. Its aim is to have all genes converted to zero, resulting in a fitness of 1. The fitness function (1) is described by Davis as follows [25]:
F6(x,у) = 0.5 -
(sin 7у2 +y2)2-0.5 1,0+0.001 (z2+y2 )2
As described in introduction, elitism is a safe method which can guarantee a growing fitness population, but its use can be very time consuming and it has a lower variability [18]. To solve this problem, the concept of short term elitism (referred to in this article as “preferentialism”) is introduced as a method of variance guarantee.
-
III. M ETHODS
Two GA functions were used in this article. The first is used to determine the best number of preferred crossovers, employing the sequencing algorithm presented in Reeves article, in which the objective is to have a chromosome with an ordered sequence of integer. Reeves proposes two kinds of crossing-overs: the fixed and the random point crossover. He also proposes two kinds of mutations: the gene exchange position and the gene shift. As for mutation rates, he suggests using variable rates, instead of using this suggestion we decided to keep methods similar to those used in the second GA function: the fixed point crossover and the shift gene mutation at a fixed mutation rate. Reeves states that shift mutation [26] had better performance in this case. The selection method used was tournament. Its initial population set was of 70 (as indicated in Reeves results) with a selected chromosome size of 8 genes, from 0-7. The fitness function was established to be minus the square difference of the gene number and the gene position, and minus 50 for each equal gene [27]. Mutation rate was set at 30%.
The second GA function used is a well-known GA function, the Binary F6. In this case, a fixed number of maximum crossovers will occur, as in the case of the seals male reproductive system [7] and in the male preference for mating with older females in the example of chimpanzees [6]. We supposed that this reproductive system should be limited due to the aging and the inability to breed in older mammals such as female humans in the post menopause state [28]. Therefore, a sample of a maximum of 5 generations must be selected, a choice which is in accordance with the sequencing results.
In contrast to the mongoose example mentioned above, in which the less fitted individuals were not able to breed [8], this study will give a chance for all individuals to breed, on the basis of their fitness and in accordance with the roulette algorithm [29].
When crossover reached five interactions with the same best fitted chromosome, two methods for selecting the new best fitness were used: (i) the choice of the second best, and (ii) the pressure exerted on the best to mutate, based on the DNA degradation system [30]. In the case of the second method, it will be mutate the gene between 0 and 1, changing the previous value for degradation purposes.
For this purpose a population of 100 chromosomes was defined, each chromosome having 44 binary genes, attending to Paul’s concepts of population [31], instead of a variable population, as presented by Ma [32]. The fitness function is the same as the one proposed by Davis [25]. The crossover was based on the single point method described by Shakarneh and the mutation and the implementation of the genetic algorithm [33], in accordance with Russels’ model [18] and Chitra [34].
The sequencing function was analyzed in three stages: First, in order to complete the algorithm a maximum fitness of zero must be obtained. If is not obtained at 3 million iterations it will break and exhibit the results. Second, no preferentialism, elitism, and mutation preferentialism were analyzed to establish the subsequent preferred generation crossovers: 3, 5, 8, 12, 20. Finally, a table for the results of each simulation was designed, in which the number of interactions to reach a fitness equal to 0, and the average fitness of the population were integrated.
The final analysis for the Binary F6 function was based on the average number of interactions for each method (no preferentialism, elitism, mutation preferentialism and second best preferentialism) in order to reach a fitness of 0.995 and an average fitness for the final population with chromosome of fitness 0.995. A fixed rate of 100000 interactions was analyzed for every case in which the algorithm did not reach a fitness of 0.995, even with enough interactions. A final comparison between the best fitness and the fitness average of the population was also provided.
-
A. Fitness Variance
Fitness variance is an important method to determine the population sizing, the presence of noise and the population variability. There are two methods to describe the fitness variance: equation 2 for a wide range of fitness and equation 3 for a narrow range [35]. In this paper, we used equation 3 [26], which later in this paper is referred to as equation 2.
The Effects of “Preferentialism” on a Genetic Algorithm Population over Elitism and Regular
Development in a Binary F6 Fitness Function
-
B. Pseudo Code for BinaryF6
Begin
Classes:
Population; //contains 100
Cromossomes
Cromossome; //contains 44 binary genes and fitness values p = New Population();
p.initialize(); //sets all genes to 1 or 0
p.setX(); p.setY();
p.calculate Fitness(); //binary function describe in equation 1
while (best Fitness <= 0.995)
p.crossover(); //uses roulette() (16)
/* Here methods elitism(), second Best Preferentialism() and mutate Preferencialist() are used*/ p.mutate(); //(16) p.calculate Fitness();
p.best Fitness();
counter = counter + 1;
print (p.best Gene()+counter)
end. [20] [18] [23]
-
IV. R ESULTS
The results of the simulations for the Binary F6 function (no preferentialism, elitism, mutation preferentialism, and second best preferentialism) are described in the following tables and discussed in the following paragraph.
Table 1. Results of no preferentialism.
|
N |
Best Fitness |
Average Fitness at Last Interaction Count Interaction or 100.000 count |
Fitness at 100.000 Interactions |
|
|
1 |
0.9999995407* |
0.4905040971 |
102 |
- |
|
2 |
0.9959261526 |
0.5495576188 |
76319 |
- |
|
3 |
0.9995487192 |
0.5220177796 |
407147 |
0.5007522008 |
|
4 |
0.9993623879 |
0.5050493220 |
594506 |
0.5003315612 |
|
5 |
0.9993383876 |
0.5048583804 |
59422 |
- ^^ |
|
6 |
0.9968485892 |
0.5040122626 |
8935 |
- |
|
7 |
0.9970252047 |
0.5483801677 |
121187 |
0.50103876 |
|
Av. |
0.9982927118 |
0. 5177685184 |
181088 |
- |
|
The symbol * |
represents the best fitness. |
Table 2. Results of elitism. |
||
|
N |
Best Fitness |
Average Fitness at Last Interaction |
Interaction Count |
|
|
1 |
0.9998498202 |
0.6366116360 |
13746 |
|
|
2 |
0.9976110518 |
0.6886430743 |
46488 |
|
|
3 |
0.9976238008 |
0.5639077002 |
37163 |
|
|
4 |
0.9989485456 |
0.5443986381 |
350 |
|
|
5 |
0.9964885361 |
0.5467223782 |
189 |
|
|
6 |
0.9998776141* |
0.5726900045 |
13232 |
|
|
7 |
0.9968727902 |
0.6509046164 |
16212 |
|
|
AV |
0.998181737 |
0.6005540069 |
18197 |
|
|
The symbol * |
represents the best fitness. |
Table 3. Results of mutation preferentialism. |
||
|
N |
Best Fitness |
Average Fitness at Last Interaction |
Interaction Count |
|
|
1 |
0.9993046833 |
0.5164356583 |
158 |
|
|
2 |
0.9994105874 |
0.5345024858 |
229 |
|
|
3 |
0.9988578692 |
0.5240233534 |
127 |
|
|
4 |
0.9962270644 |
0.5323966275 |
5876 |
|
|
5 |
0.9980866565 |
0.4428624165 |
2897 |
|
|
6 |
0.9999178929* |
0.5194976068 |
2375 |
|
|
7 |
0.9985651515 |
0.5278760150 |
4150 |
|
|
AV |
0.9986242722 |
0.5139420233 |
2259 |
|
The symbol * represents the best fitness.
Table 4. Results of second best preferentialism.
|
N |
Best Fitness |
Average Fitness at Last Interaction |
Interaction Count |
|
1 |
0.9999303115 |
0.5460101333 |
4219 |
|
2 |
0.9999243659 |
0.5649431455 |
236 |
|
3 |
0.9982902740 |
0.6921079032 |
4545 |
|
4 |
0.9999772627* |
0.6449569603 |
17255 |
|
5 |
0.9980163823 |
0.6643604328 |
352 |
|
6 |
0.9960599815 |
0.6034833184 |
134 |
|
7 |
0.9955440570 |
0.5333832171 |
953 |
|
AV |
0.9982489478 |
0.6070350158 |
3956 |
The symbol * represents the best fitness.
Table 5. Fitness variance.
|
Method |
Best Fitness |
Worst Fitness |
Variance (.10-3) |
|
No Preferentialism |
0.9999995407 |
0.9959261526 |
2.03669 |
|
Elitism |
0.9998776141 |
0.9964885361 |
1.69454 |
|
Second Best Preferentialism |
0.9999772627 |
0.9955440570 |
2.21660 |
|
Mutation Preferentialism |
0.9999178929 |
0.9962270644 |
1.84541 |
The ensuing tables use the following symbols to the best results, ** for the overall best result, # for the represent the results of the sequencing algorithm: * for worst results, and ## for the overall worst results.
Table 6. No preferentialism or elitism.
|
N |
Interaction Count |
Average Fitness (max = 0) |
|
1 |
884085 |
-35 |
|
2 |
11537400 (3 Mi+) ## |
-29 |
|
3 |
737116 |
-44 |
|
4 |
6557871 |
-34 |
|
5 |
5364* |
-43 |
|
6 |
3648556 |
-28* |
|
7 |
10970 |
-31 |
|
8 |
5431439 |
-51# |
|
Average |
3601600 |
-37 |
|
Table 7. Elitism. |
||
|
N |
Interaction Count |
Average Fitness (max = 0) |
|
1 |
110674 |
-31 |
|
2 |
1442461 |
-33 |
|
3 |
14785* |
-37 |
|
4 |
21397 |
-52# |
|
5 |
1732203# |
-33 |
|
6 |
487227 |
-43 |
|
7 |
425954 |
-29* |
|
8 |
228043 |
-47 |
|
Average |
557843 |
-38 |
|
Table 8. 3 generations mutation preferentialism. |
||
|
N |
Interaction Count |
Average Fitness (max = 0) |
|
1 |
3 mi+## |
-38 |
|
2 |
7836* |
-33* |
|
3 |
3 mi+## |
-42 |
|
4 |
29504 |
-37 |
|
5 |
778517 |
-46# |
|
6 |
1954844 |
-42 |
|
7 |
548704 |
-41 |
|
8 |
1770644 |
-39 |
|
Average |
1386256 |
-40 |
Table 9. 5 generations mutation preferentialism.
|
N |
Interaction Count |
Average Fitness (max = 0) |
|
1 |
31665 |
-31 |
|
2 |
40317 |
-38 |
|
3 |
33601 |
-28* |
|
4 |
90595 |
-34 |
|
5 |
10065* |
-41 |
|
6 |
16074 |
-36 |
|
7 |
16277 |
-44# |
|
8 |
738268# |
-34 |
|
Average |
122102 |
-36 |
|
Table 10. 8 generations mutation preferentialism. |
||
|
N |
Interaction Count |
Average Fitness (max = 0) |
|
1 |
1585737 |
-25* |
|
2 |
7325** |
-41 |
|
3 |
20596 |
-45# |
|
4 |
2655858# |
-41 |
|
5 |
23658 |
-39 |
|
6 |
42889 |
-36 |
|
7 |
17778 |
-45# |
|
8 |
1390776 |
-31 |
|
Average |
718077 |
-38 |
|
Table 11. 12 generations mutation preferentialism. |
||
|
N |
Interaction Count |
Average Fitness (max = 0) |
|
1 |
3 mi+## |
-30 |
|
2 |
12708 |
-31 |
|
3 |
14297 |
-46# |
|
4 |
10847* |
-40 |
|
5 |
911626 |
-35 |
|
6 |
3 mi+## |
-38 |
|
7 |
181258 |
-38 |
|
8 |
57627 |
-28* |
|
Average |
898545 |
-36 |
|
Table 12. 20 generations mutation preferentialism. |
||
|
N |
Interaction Count |
Average Fitness (max = 0) |
|
1 |
987850 |
-42 |
|
2 |
32803* |
-31 |
|
3 |
3 mi+## |
-52## |
|
4 |
375678 |
-33 |
|
5 |
55683 |
-27 |
|
6 |
746676 |
-36 |
|
7 |
1656905 |
-24** |
|
8 |
2337578 |
-45 |
|
Average |
1149147 |
-36 |
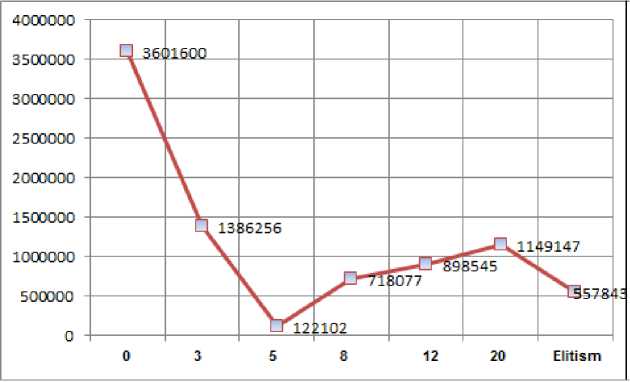
Fig.1. Average interaction count for each generation count of preferentialism.
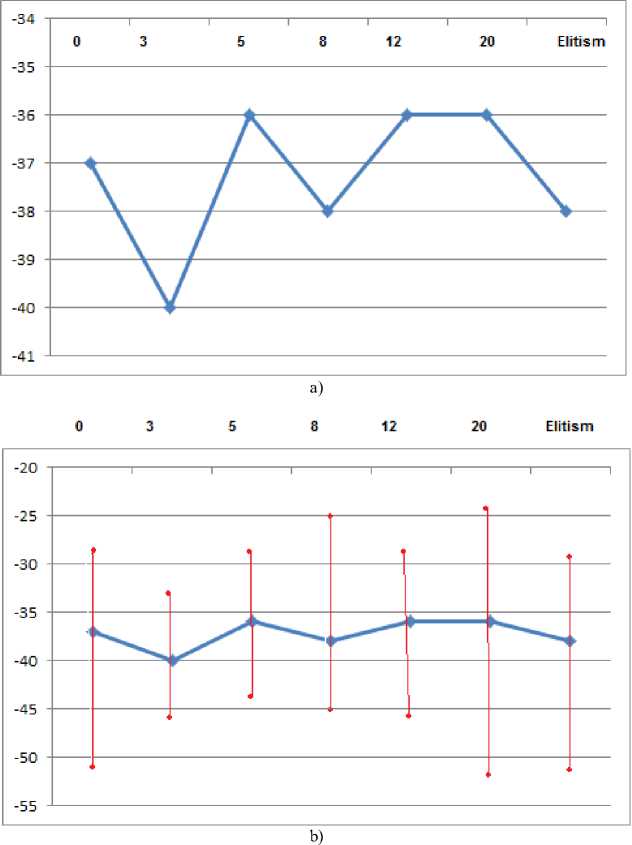
Fig.2. a) Average population fitness for each generation count of preferentialism, b) with higher and lower values.
-
V. D ISCUSSION
The analysis of Fig. 1 makes clear that the 5 generations preferentialis m has by far the least number of interactions for optimal fitness. It is also clear that the 8 and the 12 generations preferentialism have greater results than no preferentialism and their results are similar to elitism. As Sinclair shows for hyenas, continuous reproductive success can be influenced by the social rank of female hyenas. The social rank causes a stable linear hierarchy, which means that the best chromosomes will eventually come from the best mothers [36]. Another interesting fact that can be related to hyenas reproductive success is the negative results obtained when the algorithm extrapolates 3 million iterations. Usually this value is stable at a fitness of -6. This may mean that high ranked chromosomes were passing their genes to others high ranked chromosomes and the mutation rate was too small to cause an effect [36].
Fig. 2.a shows that the average fitness for preferentialism, no preferentialism and elitism is stable, except for the 3 generations preferentialism. This is credited to the fact that highest ranking primate alpha males have high levels of testosterone and stress hormone [37], which in tum explains the short term reproductive cycle as very stressful, as it happens to the highly stressed marsupials that usually die of stress after the mating cycle [38]. Dellagostin’s study on pork suggests that the presence of stress genes, which are passed by crossing-overs, have bad effects on the quality of the pork meat, in addition to many other problems [39]. This line of arguments can be used to explain the bad average result found in the 3 generations preferentialism. The 3 generation preferentialism has the worst iterations count for preferentialism systems, a result which may indicated the bad quality of genes due to the stress mentioned above.
Fig. 2.b states that the 3 and the 5 generations preferentialism have the smallest difference between the best, the average and the worst population average results. It should also be noted that the 3 generations preferentialism has the worst results overall, while the 5 generations preferentialism seems to have consistently present the best results. Although we have already discussed the negative/bad results of short term preferentialism, it is also important to mention that the 5 generation preferentialism performed better than the long term preferentialism and elitis m. The answer may be that if a chromosome has a bad gene, even if it is the best fitted chromosome, those bad genes will be passed on and if no mutation stops them, they will generate a long cycle of bad effects [11] [12].
It becomes clear after the analysis of tables 1 to 4 that, without any method of saving the best result, the BinaryF6 function takes much longer to reach the selected fitness value (181088 interactions). Yet it reaches the highest fitness, 0.9999995407, in the shortest number of interactions, 102. This fact that can be considered some kind of noise or a skewed distribution attributable to the much higher average of interactions and to the similar average of fitness results when compared to the other systems. Goldberg [35] says in his paper that a genetic algorithm operating its crossover in a tournament system can be considered a deterministic environment. In the present article the roulette systems used can also be considered deterministic [40, 35] and the population fitness is assumed to have a normal distribution. Therefore, the noise can be considered very low, even if some skewed (non-normal) distribution can occur for specific individuals [35].
In addition to the skewed result which appears in table 1, it is also noticeable that the interaction counts for the preferentialism hypothesis (2259 and 3956) are much lower than the interaction counts from elitism (18197) and the no preferentialism or elitism (181088). That may mean a significant increase in time efficiency. However, this case is different from a super computer running the algorithm, in which case the algorithm would be processed in a much shorter time. It is also different from improvements in memory allocation algorithms [41]. However, the idea of time reduction is certainly adequate to computing problems [42]. The best fitness in the preferentialism algorithms were also much higher than in the cases of elitism and no preferentialism if we exclude the skewed result with a lower interaction count, as exemplified by the variance shown in table 5.
Preferentialism as a modification of elitism [40] can significantly improve fitness variance, as established by the method examined by Goldberg [35] below (2). A comparison with the results of table 5 makes this clear.
of =
(fmax -fmin) 2
The variance to be considered is among the best fitnesses obtained. Both preferentialism methods examined (2.21660 and 1.84541) have a higher variance than elitism method (1.69454), a result that shows a significantly improvement in variance, a fact mentioned by Goldberg [35]:
-
• Generation error and ultimate convergence;
-
• Population sizing;
-
• Convergence is aided by higher fitness variance;
Fitness variance was higher in second best preferentialism than in no preferentialism (2.03669) a result which indicates a good sign for convergence [35] and a greater sign for optimal solution, since it is significantly better than elitism in number of interactions [43]. This remark can be qualified for both methods of preferentialism: since they both have a higher fitness variance than elitism, a smaller number of interactions and a higher average fitness. Those results qualify them as a better choice than elitism and a great option for replacing regular genetic algorithms. [35] [43]
-
VI. C ONCLUSION
The overall results show that preferentialism can be the best quality method and the fastest way for evolution. However, the generation length of the preferentialism can have a bad influence in the outcome. Short term generations can have unsatisfactory results in terms of their offspring and in the quality of genes they pass on. Similarly, if the generations have an extended lifetime, there is no clear advantage over elitism, making it unnecessary. As an overall result, preferentialism is certainly better than a no preferentialism system, as exemplified by the sequencing function and by the binary F6 function.
The results make clear that preferentialism can reach greater fitness values with a smaller number of interactions than no preferentialism methods. It is also clear that when we consider either the variance or the fitness/interaction number, preferentialism method is better than elitism. As a natural procedure for a reproductive system, the preferentialism has shown that it is also superior as a computing method.
References The Effects of "Preferentialism" on a Genetic Algorithm Population over Elitism and Regular Development in a Binary F6 Fitness Function
- S. Alberts, H. Watts and J. Altmann, "Queuing and queue-jumping: long-term patterns of reproductive skew in male savannah baboons, Papio cynocephalus," Animal Behavior, vol. 65, no. 4, 2003.
- C. Parker, "Male dominance and reproductive activity in Papio anubis," Animal Behavior, vol. 27, 1979.
- S. Hrdy, The Langurs of Abu: Female and Male Strategies of Reproduction, Boston: Harvard University Press, 1980.
- M. Ramenofsky, R. Hegner, A. Dufty and J. Wingfield, "Testosterone and Agression in Birds," American Scientist, vol. 75, no. 6, 1987.
- J. Pemberton, T. Clutton-Brock, J. Smith and D. Coltmann, "Male reproductive success in a promiscuous mammal: behavioural estimates compared with genetic paternity," Molecular Ecology, vol. 8, no. 7, 1999.
- M. Muller, M. Thompson and R. Wrangham, "Male Chimpanzees Prefer Mating with Old Females," Current Biology, vol. 16, no. 22, 2006.
- B. Le Bouef, "Male-male Competition and Reproductive Success in Elephant Seals," Amer. Zoo., vol. 14, no. 1, 1974.
- S. Creel and K. Rabenold, "Inclusive fitness and reproductive strategies in dwarf mongooses," Behavioral Ecology, vol. 5, no. 3, 1994.
- A. De Loof, "Longevity and aging in insects: Is reproduction costly; cheap; beneficial or irrelevant? A critical evaluation of the “trade-off” concept," Journal of Insect Physiology, vol. 59, no. 1, 2011.
- L. Amaral and E. Hruschka Jr, "Transgenic: An evolutionary algorithm operator," Neurocomputing, vol. 127, no. 15, 2014.
- L. Barreiro and J. Brinkworth, "The contribution of natural selection to present-day susceptibility to chronic inflammatory and autoimmune disease," Current Opinion in Immunology, vol. 31, 2014.
- C. Sapienza, E. de la Casa-Esperon and F. de Villena, "Natural selection and the function of genome imprinting: beyond the silenced minority," Trends in Genetics, vol. 16, no. 12, 2000.
- A. Biswas, S. Das, A. Abraham and S. Dasgupta, "Stability analysis of the reproduction operator in bacterial foraging optimization," Theoretical Computer Science, vol. 411, no. 21, 2010.
- B. Niu, J. Wang and H. Wang, "Bacterial-inspired algorithms for solving constrained optimization problems," Neurocomputing, vol. 148, no. 19, 2015.
- C. Ozturk, E. Hancer and D. Karaboga, "A novel binary artificial bee colony algorithm based on genetic operators," Information Sciences, vol. 297, no. 10, 2015.
- M. Mitchell, "L.D. Davis, Handbook of Genetic Algorithms*," Artificial Intelligence , vol. 100, 1998.
- M. Gibbs, H. Maier and G. Dandy, "Using characteristics of the optimisation problem to determine the Genetic Algorithm population size when the number of evaluations is limited," Environmental Modelling & Software, vol. 69, 2015.
- S. Russel and P. Norvig, Artificial Inteligance, USA: Prentice Hall, 2010.
- M. Nayeem, M. Rahman and M. Rahman, "Transit network design by genetic algorithm with elitism," Transportation Research, vol. 46, 2014.
- M. Wibig, "Dynamic Programming and Genetic Algorithm for Business Processes Optimisation," I.J. Intelligent Systems and Applications, vol. 1, pp. 44-51, 2013.
- H. Mühlenbein, "Parallel genetic algorithms, population genetics and combinatorial optimization," Parallelism, Learning, Evolution, vol. 565, 2005.
- J. Wang, O. Ersoy, M. He and F. Wang, "Multi-offspring genetic algorithm and its application to the traveling salesman problem," Applied soft Computing, vol. 43, 2016.
- M. Kuhn, T. Severin and H. Salzwedel, "Variable Mutation Rate at Genetic Algorithms: Introduction of Chromosome Fitness in Connection with Multi-Chromosome Representation," International Journal of Computer Applications, vol. 752, no. 17, 13.
- Y. Yun, "Hybrid genetic algorithm with adaptive local search scheme," Computers & Industrial Engineering, vol. 51, no. 1, 2006.
- L. Davis, Handbook of genetic algorithms, New York: Van Nostrand Reinhold, 1991.
- L. Zang and T. Wong, "An object-coding genetic algorithm for integrated process planning and scheduling," European Journal of Operational Research, vol. 244, no. 2, 2015.
- C. C. Reeves, "A Genetic Algorithm for Flowshop Sequencing," Computers Ops Res., vol. 22, no. Pergamon, 1995.
- S. Austad, "Menopause: An evolutionary perspective," Experimental Gerontology, vol. 29, no. 3-4, 1994.
- A. Lipowski and D. Lipowski, "Roulette-wheel selection via stochastic acceptance," Physica A: Statistical Mechanics and its Applications, vol. 391, no. 6, 2012.
- R. Zbieć-Piekarska and W. Branicki, "Examination of DNA methylation status of the ELOVL2 marker may be useful for human age prediction in forensic science," Forensic Science International: Genetics, vol. 14, 2015.
- P. Victer Paul, N. Moganarangan, S. Kumar, R. Raju and P. Dhavachelvand, "Performance analyses over population seeding techniques of the permutation-coded genetic algorithm: An empirical study based on traveling salesman problems," Applied Soft Computing, vol. 32, 2015.
- Z. Ma, "Chaotic populations in genetic algorithms," Applied Soft Computing, vol. 12, no. 8, 2012.
- A. Shakarneh, "A Review of Genetic Algorithm Optimization: Operations and Applications to Water Pipeline Systems," International Journal of Mathematical, Computational, Physical and Quantum Engineering, vol. 7, no. 12, 2013.
- C. Chitra and P. Subbaraj, "A nondominated sorting genetic algorithm solution for shortest path routing problem in computer networks," Expert Systems with Applications, vol. 39, no. 1, p. 1518–1525, 2012.
- D. Goldberg and B. Miller, "Genetic Algorithms, Tournament Selection, and the Effects of Noise," Complex System, 1995.
- A. Sinclair and P. Arcese, Serengeti II - Dynamics, Management and Conservation of an Ecosystem., Chicago and London: The Chicago University Press, 1995.
- L. Gesquiere, N. Learn and J. Altmann, "Life at the Top: Rank and Stress in Wild Male Baboons," Science, vol. 333, 2011.
- A. Bradley, I. McDonald and A. Lee, "Stress and mortality in a small marsupial (Antechinus stuartii, Macleay)," General and Comparative Endocrinology, vol. 40, 1980.
- O. Dellagostin, R. Bastos and J. Deschamps, "Efeito do Gene do Estresse Suíno sobre Características de Quantidade e Qualidade de Carcaça," Rv. Bras. Zootec., vol. 30, 2001.
- D. S. Weile and E. Michielssen, "Genetic Algorithm Optimization Applied to Electromagnetics: A Review," TRANSACTIONS ON ANTENNAS AND PROPAGATION, vol. 45, no. 3, 1997.
- T.-W. Lam, K. Sadakane and W.-K. Sung, "A Space and Time Efficient Algorithm for Constructing Compressed Suffix Arrays," Computing and Combinatorics, vol. 2387, 2002.
- X. Huang and W. Miller, "A time-efficient, linear-space local similarity algorithm," Avances in Applied Mathmatics, vol. 12, no. 3, 1991.
- T. Meyarivan, S. Agarwal, A. Pratap and K. Deb, "A Fast and Elitist Multiobjective Genetic Algorithm: NSGA-II," IEEE TRANSACTIONS ON EVOLUTIONARY COMPUTATION,, vol. 6, 2002.
