The first settlers of Novosibirsk: the demographic structure of Krivoshchekovo, Western Siberia, in the 18th and early 19th centuries

Author: Chikisheva T.A., Salnikova I.V.
Journal: Archaeology, Ethnology & Anthropology of Eurasia @journal-aeae-en
Section: Anthropology and paleogenetics
Article in issue: 2 т.49, 2021.
Free access
Sex and age were determined in a skeletal sample from an 18th to early 19th century cemetery at Krivoshchekovo, a rural center since the mid-1790s. Historical records mention the area as the Krivoshchekovo Ob region. The village was founded by immigrants from European Russia. Archival sources concerning the demography of Krivoshchekovo were analyzed, mortality tables were constructed, proportions of various age groups were calculated, and average age of death was estimated for adults. Limitations of the study stem from the fact that the population of Krivoshchekovo was not stationary. The results of the paleodemographic analysis are compared with information from two archival sources: confessional lists and parish registers of St. Nicholas Church, where births, marriages, and deaths were recorded over the period from 1763–1841. Comparative material relates to Russian old residents and the local Tatar population of the Omsk Irtysh region in the 1600s–1800s. Sex and age were estimated in a skeletal sample of 462 individuals—one third of the number of deaths during 1763–1841, when people were buried at the graveyard. Child mortality was lower than among old residents, immigrants, or natives of the Middle Irtysh. The most vulnerable group in the Krivoshchekovo population were young women and children aged 1–4. The findings of the skeletal study agree with those derived from archival sources, and likely mirror the real situation.
Paleodemography, mortality tables, parish registers, immigration, Russian first settlers, Krivoshchekovo population
Short address: https://sciup.org/145146262
IDR: 145146262 | DOI: 10.17746/1563-0110.2021.49.2.144-153
Text of the scientific article The first settlers of Novosibirsk: the demographic structure of Krivoshchekovo, Western Siberia, in the 18th and early 19th centuries
In September and October 2018, the Department of Conservation and Rescue Archaeology at the Institute of Archaeology and Ethnography (IAET) SB RAS carried out a rescue excavation at the site named “A sector of the cultural layer of Krivoshchekovo village”. The site was located in the building area of a bridge crossing the Ob River at the entrance to Ippodromskaya Street in Novosibirsk. According to written sources, Krivoshchekovo was the first settlement of subjects of the Russian Empire in the area. By the middle of the
18th century, after the construction of St. Nicholas Church, Krivoshchekovo had become a village and the center of the volost (district) of the same name.
The excavation unearthed the basement of stone St. Nicholas Church*, built in 1881. This basement
overlapped a flat-grave burial ground, which suggests that the church was built on the territory of a graveyard of the 18th to early 19th centuries. The first mention of a church at Krivoshchekovo is found in the eighth section of the historical-geographical description by G.F. Miller (Elert, 1988: 79). The territory was probably occupied earlier by a wooden church built in 1746, surrounded by a graveyard. According to K.A. Golodyaev, in 1824, “the village community, “on shares” with the residents of neighboring villages, built a new wooden church in the name of Saint and Wonderworker Nicholas of Myra, a rural municipality, and a police station in Krivoshchekovo” (2016: 90). As was traditional, the new cathedral was erected in the place of an older church. The excavation revealed human skeletal remains from 384 burials, which became the object of the present paleodemographic study.
Paleodemography emerged as the section of demography that employs mortality tables based on skeletal determinations of the sex and age of the deceased for building models of the natural movement of the population. The latter is defined as the changes in the size, sex, or age structure of the population in terms of sociobiological, socioeconomical, and sociocultural factors (Borisov, 2001: 6–7).
Modern methods make it possible to assess such demographic parameters of populations as size, mortality in various age cohorts, the lifespan of adults of both sexes, sex ratio of adults, fertility, and child mortality (Acsadi, Nemeshkeri, 1970; Weiss, 1973; Chamberlain, 2001; Paleodemography…, 2002; Alekseyev, 1972; Alekseyeva, Bogatenkov, Lebedinskaya, 2003). On the basis of these parameters, researchers are able to reconstruct crisis consequences of epidemics, interpopulation and intrapopulation conflicts, patterns of family life, and specific physical activity. However, in practice, paleodemographic research is typically restricted to an analysis of mortality tables. More sophisticated reconstructions are rare because of the limited employment of archaeological and ethnographic data for the interpretation of observed demographic events by anthropologists. And vice versa : archaeologists do not pay proper attention to anthropological data. In this study, we set out to expand the subject field by placing paleodemographic data into the context of the data related to a particular population for which a bulk of historical information is available.
One of the issues obstructing the creation of reliable models of paleodemographic events is the breaking of such an important rule of data collecting as the fullest possible preservation of information on the age composition of skeletal samples. The most typical pitfall is the distortion of the proportion of subadult individuals, infants in particular. Weakly calcified subadult remains are more prone to degradation (owing to the physical and chemical agents in the soil) than adult skeletons. The child remains often get lost in museum collections, as they are barely used for analyses by classical anthropological methods, and thus receive less attention from curators. This latter issue does not apply to the sample from Krivoshchekovo, because all the remains found at the site were carefully collected, and the sex and age determination was carried out immediately in the field. Not only complete or almost complete skeletons were studied, but also single bones and bone fragments. The subadult remains were the object of particularly careful scrutiny.
One of the most hotly debated topics in paleodemography is the question of whether the actual demographic structure of past populations can be modeled on the basis of the mortality rates of osteological samples (Hoppa, 2002). But for Krivoshchekovo and several neighboring villages, the parish registers were available; thus, we were able to cross-check the results of the osteological analyses using the information from two archive sources: confessional lists and parish registers, recording acts of civil status (birth, marriage, death). As a result, we have demonstrated that the studied osteological sample well represents the actual population of Krivoshchekovo, and that some critical demographic features of the sample (e.g. increased mortality in some age cohorts) can be related to the traditions of family life and social events.
Material and methods
Sex and age were determined for 462 individuals, which is 93.1 % of the total number of the buried (496 skeletons). The paleodemographic characteristics calculated for such a representative sample provide a robust approximation of the demographic structure of the parish of St. Nicholas Church. All the settlements belonging to the parish were using the same graveyard. Taking into account regular administrative and territorial transformations due to the growing population and the emergence of new settlements, T.S. Mamsik, who studied the history of the Upper Ob region in the 18th to 19th centuries, sometimes referred it to as the Krivoshchekovo Ob region (2012: 65). We will also use this term further on.
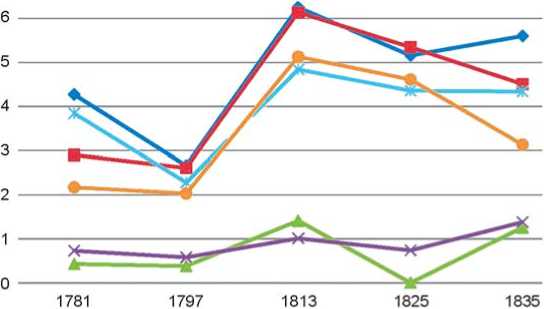
The demographic data for the actual population of Krivoshchekovo were obtained from the parish documentation (GANO. F. 156, Inv. 1, D. 2814–2818; State Archive of the Tomsk Region (GATO). F. 264, Inv. 1, D. 22). This information covers the period from 1764 to 1841. The calculation of the main parameters of the natural movement of the population (coefficients of fertility, mortality, and natural increase) was carried out for 1781, 1797, 1813, 1825, and 1835, i.e. at approximately equal intervals, spanning 54 years. These calculations clearly suggest that the fertility coefficient steadily and significantly exceeded the mortality rates (Table 1, Fig. 1). This does not fit a stable or a stationary demographic situation for which the modeling equations employed in paleodemography are calculated (Angel, 1969; Weiss, 1973: 8–10). Thus, the most important parameters of population structure (the probability of death and life expectancy for different age cohorts, population size, family size, etc.) cannot be reliably estimated in this case. Achieving stability can take some 50–100 years in pre-industrial populations closed to immigration (Chamberlain, 2001). But the size of the population of the Krivoshchekovo Ob region was progressively increasing, owing not only to natural reproduction but also to immigration (Mamsik, 2012: 67). Settling of the
Table 1. Indicators of the natural movement of the population
|
Year |
Group |
Total number |
Number of births |
Number of deaths |
Total coefficient of fertility, % |
Total coefficient of mortality, % |
Coefficient of natural growth, % |
|
1781 |
Males |
702 |
30 |
3 |
4.27 |
0.43 |
3.84 |
|
Females |
689 |
20 |
5 |
2.9 |
0.73 |
2.17 |
|
|
Total |
1391 |
50 |
8 |
3.39 |
0.57 |
2.82 |
|
|
1797 |
Males |
1051 |
28 |
4 |
2.66 |
0.38 |
2.28 |
|
Females |
1032 |
27 |
6 |
2.61 |
0.58 |
2.03 |
|
|
Total |
2083 |
56 |
10 |
2.68 |
0.48 |
2.2 |
|
|
1813 |
Males |
1280 |
80 |
18 |
6.25 |
1.41 |
4.84 |
|
Females |
1318 |
81 |
14 |
6.14 |
1.01 |
5.13 |
|
|
Total |
2661 |
161 |
32 |
6.05 |
1.2 |
4.85 |
|
|
1825 |
Males |
1609 |
83 |
13 |
5.16 |
0.81 |
4.35 |
|
Females |
1756 |
94 |
13 |
5.35 |
0.74 |
4.61 |
|
|
Total |
3365 |
177 |
26 |
5.26 |
0.77 |
4.49 |
|
|
1835 |
Males |
1979 |
111 |
25 |
5.61 |
1.26 |
4.35 |
|
Females |
2169 |
98 |
30 |
4.52 |
1.38 |
3.14 |
|
|
Total |
4148 |
209 |
55 |
5.04 |
1.33 |
3.71 |
Years
—♦— а
-в- b
-*- c
d e f
Fig. 1. Distribution of the indicators of the natural movement of the studied population in 1781–1835.
a, b – fertility coefficient: a – males, b – females; c, d – mortality coefficient: c – males, d – females; e, f – natural growth: e – males, f – females.
area by the Russians began from the establishment of a “market-village” called Krivoshchekovo by some 20 families of settlers from various Tobolsk slobodas in 1707 (Ibid.: 50–51). The village was located at the boundary of the so-called Teleut land around the Siberian Tract—the territory occupied by the “White Kalmyks”, subjects of Dzungaria. By the 1790s, the Krivoshchekovo Volost was established, which included 35 small settlements, and by 1823, 38 settlements (Ibid.: 68).
Assuming that the factor of migration had some effect on the formation of the demographic structure of the Krivoshchekovo population, and that this effect cannot be assessed quantitatively, we calculated only the main paleodemographic parameters using the mortality tables. Their commonly accepted symbolic designations and formulae (Weiss, 1973: 1–10; Alekseyeva, Bogatenkov, Lebedinskaya, 2003: 21) are given in Table 2. We obtained the distribution of the individuals between age and sex cohorts, calculated the mean life expectancy (disregarding the subadult mortality), and analyzed the percent ratios of subadults, males, and females in different age classes.
The standard grouping for the description of the age structure of the population, accepted in all demographic documents and calculations of the UN, includes one-year intervals from 0 to 4 years and five-year intervals from 5 to 85 years. The last interval is open: 85 and older (Borisov, 2001: 57–58). Such a classification is also employed for compiling mortality (life) tables and respective calculations in paleodemography, where subadults from 0 to 4 years of age are typically combined into a single cohort. In our tables, subadults that died during birth or immediately after birth were treated as a separate age cohort. This group is of particular interest, as it is numerous at the Krivoshchekovo cemetery, and the remains of these subadults are typically found in female burials. Thus, the age interval from 0 to 4 years was composed of two different groups: 0–1 and 1–4 years. The final age cohort employed in this study included individuals 55 years old and older.
Some of the existing approaches to the grouping of paleodemographic raw data into cohorts are based on the gradations of the main stages of ontogeny (Alekseyev, 1972; Pezhemsky, 2003, 2010). Such an approach can be successfully applied to our study sample, as the bulk of reference data on the Russian old residents and local Tatar populations of the Omsk Irtysh region of the 17th to 19th centuries AD was tabulated according to the stages of ontogeny (Yuzhakova, 2016, 2018).
Taking into account the large proportion of subadult remains in the Krivoshchekovo sample (201 individuals out of the total 462, or 43.5 %), we paid special attention to the natural movement of the subadult part of the historic population. The analysis of the movement was based on
Table 2. Paleodemographic indicators and the formulae used for their calculation (five year intervals)
|
Indicator |
Formula |
|
x. Age cohort X. Median of the age cohort х Dx. Number of individuals in the age cohort х Nr. Sample size Na (х). Number of adult individuals in the age cohort х Nf (х). Number of adult females in the age cohort х Nm (х). Number of adult males in the age cohort х Nc (x). Number of children in the age cohort х Сх. Proportion of the age cohort х in the total sample PSR (m or f). Total sex ratio in the sample PSR (х). Sex ratio in the age cohort х PSR (с–а). Proportion of children and adults in the sample (%) PCD. Child mortality (%) PCNB. Child mortality in the zero age cohort (%) PCB. Child mortality during the first year of life (%) AA. Mean age-at-death of adults |
– Х = [i + (i + 5)]/2, where i means the beginning of an age cohort – – – – – – (Dx/Nr) × 100 [N(m or f)/Na] × 100 The same for the age cohort х (Nс/Na) × 100 [∑ (0, 14) Dx/Nr] × 100 [∑ (0) Dx/Nr] × 100 [∑ (0–1) Dx/Nr] × 100 [∑ (15, 50+) XDx/Na] × 100 |
Table 3. Total mortality table for the sample from the Krivoshchekovo cemetery
|
Age cohort (х) |
Total sample |
Males |
Females |
|||
|
Number of individuals (Dx) |
Proportion of the sample (Cx) |
Number of individuals (Dx) |
Proportion of the sample (Cx) |
Number of individuals (Dx) |
Proportion of the sample (Cx) |
|
|
0 |
38 |
8.23 |
– |
– |
– |
– |
|
0–1 |
27 |
5.84 |
– |
– |
– |
– |
|
1–4 |
90 |
19.48 |
– |
– |
– |
– |
|
5–9 |
35 |
7.58 |
– |
– |
– |
– |
|
10–14 |
11 |
2.38 |
– |
– |
– |
– |
|
15–19 |
20 * |
4.33 |
2 |
1.59 |
17 |
12.69 |
|
20–24 |
24 |
5.19 |
8 |
6.35 |
16 |
11.94 |
|
25–29 |
39 |
8.44 |
15 |
11.90 |
24 |
17.91 |
|
30–34 |
22 |
4.76 |
9 |
7.14 |
13 |
9.70 |
|
35–39 |
51 |
11.04 |
30 |
23.81 |
21 |
15.67 |
|
40–44 |
39 |
8.44 |
23 |
18.25 |
16 |
11.94 |
|
45–49 |
32 |
6.93 |
21 |
16.67 |
11 |
8.21 |
|
50–54 |
15 |
3.25 |
7 |
5.56 |
8 |
5.97 |
|
55+ |
19 |
4.11 |
11 |
8.73 |
8 |
5.97 |
|
Total |
462 |
100 |
126 |
100 |
134 |
100 |
*Including one individual of undetermined sex.
the data on fertility and child mortality extracted from the parish registers ranging from 1763 to 1841 (GANO. F. 156, Inv. 1, D. 2814–2818; GATO. F. 264, Inv. 1, D. 22). Those books contain information regarding the cause of death as well.
Results and discussion
According to the principles described above, a mortality table for the population represented by the burials at the cemetery of the 18th to early 19th church in the Krivoshchekovo village was calculated. The distribution of age cohorts in the sample displays an increase in mortality in three intervals: 0–4; 25–29, and 35–39 years (Fig. 2). A notable feature of the graph is an elevated position of the female mortality curve with respect to the male curve in the interval from 15–19 to 25–29 years, though the general shape of both curves is similar. After the 30–34 years cohort, the position of the female and male curves changes. While female mortality is much higher from 15 to 30 years of age, an opposite picture is observed in older cohorts, from 25–39 to 55+ years. We do not mean to explain this trend by more favorable live conditions for mature females. Rather, the observed inversion of the mortality curves can be associated with a notable decrease in the number of individuals from the Maturus age cohort owing to frequent deaths of young females. The analysis of the factors that led to such a pattern was beyond the aims of the present study. It is of note, however, that such a cause of death as “fever” is often found in the parish registers for females. This can probably be interpreted as death from general sepsis accompanied by a very high temperature. Frequent parturitions, in the absence of qualified obstetrics and necessary hygiene, might determine the selective mortality of females from the Juvenilis and Adultus age cohorts.
The association between female mortality and labor is evidenced by the presence of numerous double burials of women and newborn or prenatal children at the Krivoshchekovo cemetery. Nine such cases were detected. The age composition of the deceased from those burials is quite wide: 16–18 (1), 18–20 (1), 25–29 (1), 35–39 (5), and even 55–60 (1). In two cases, the burials contained the remains of twins. Multiple pregnancies were probably frequent in the Krivoshchekovo population and can be considered a typical feature of this group. In general, six cases of the interment of two subadults of approximately the same age were observed: four pairs of newborns, and two pairs of older children (2.5–3
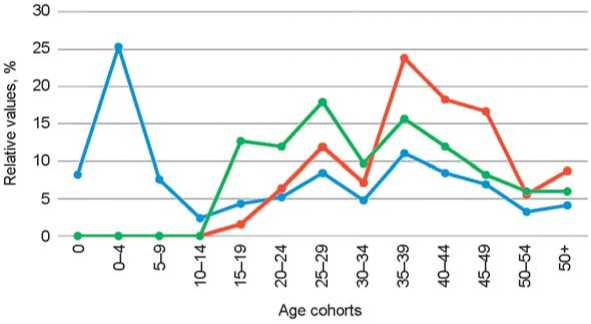
—♦— а
Fig. 2. Age distribution of adult individuals of the studied sample. a – all individuals; b – males; c – females.
b c
—♦— а
—в— b
c

Years
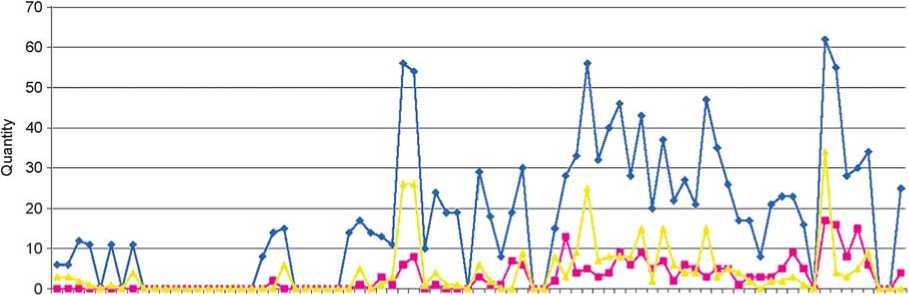
Fig. 3. Age distribution of the subadult individuals died in the Krivoshchekovo Volost in 1763–1841. a – all subadults; b – first year of life; c – 1–5 years.
and 3.5–4 years old). Our observations comply with the records in the parish registers, which also report births of twins.
The peak subadult mortality falls in the first year of life, and this result is similar between the osteological observations and the demographic data for the period from 1763 to 1841 (Fig. 3). In this graph, the mortality curve for 1–5 years is substantially higher than that for infants (0–1 years). Notably, in Krivoshchekovo Volost, children’s deaths were not being registered in the parish registers during quite long periods, i.e. from 1771 to 1781, and from 1785 to 1789. This is probably due to the absence of information for the respective years rather than to the real demographic situation in the population. The top four peaks of subadult mortality (1795–1796; 1810–1812; 1823, and 1834–1835) are associated with the smallpox epidemics in the region, which is also evident from the records in the metric books. The lower vulnerability of infants can be explained by a higher level of immunity due to breastfeeding. Weaning and the adoption of an adult diet, accompanied by an increase in physical and cognitive activity, in older children may explain their higher vulnerability to infectious agents. Adult mortality was rising in the epidemic years as well, which was accompanied by an increase in fertility: the highest number of births falls on the very same years as the highest mortality rates (Fig. 4). Clearly, the prevention of depopulation was achieved not only through immigration but also by increased fertility.
The plots of the distribution of the main parameters of natural movement of the population (see Fig. 1) display a lower amplitude of fluctuation of mortality coefficient in females than in males for five years during a 54-year-long period (at roughly equal intervals from 1781 to 1835). The coefficients of fertility and natural population growth show similar trends in both sexes till the terminal
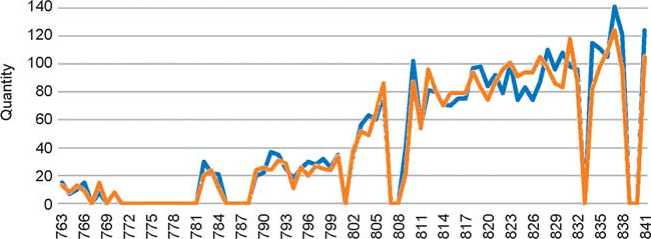
Fig. 4. Sex distribution of children born in Krivoshchekovo Volost in 1763–1841. a – males; b – females.
year of our analysis (1835), when the fertility coefficient substantially decreased in females but increased in males. A similar trend is observed for natural growth as well. The tendencies for the indicators of the natural movement display some similar characteristic features of the subadult fertility and mortality plots for 1763–1841. The highest, and almost equal for both sexes, fertility and natural growth coefficients are detected simultaneously with the maximal values of the mortality coefficient— in 1813. But in 1835, the increase of mortality rate as compared to 1825 common for both sexes has led to an increase in the coefficients of fertility and natural growth in males only, while the same indicators in females have substantially decreased. This observation may suggest that the formation of a balanced demographic structure in populations depends on many factors, the most salient of which for the Krivoshchekovo population was mortality. The response to its growth, especially in subadults, was an increase in the fertility rate.
The sex and age structure of the Krivoshchekovo population can be compared with the data on the old residents and migrants from the Izyuk village nearby Tara. The village was established by servicemen from Tara in 1701, almost simultaneously with Krivoshchekovo. An excavation of the local cemetery, referred to in archaeological literature as Izyuk I, revealed the remains of 264 individuals from 261 burials (Yuzhakova, 2018). The data on the Ayalyn Tatars from the Cheplyarevo village, taken from the 1625 census (Tomilov, 1981: 137), were available for comparative analysis as well. These data were represented by an osteological sample from the Cheplyarevo-27 burial ground, which was probably the cemetery belonging to the village (Yuzhakova, 2016). In the late 18th to early 19th centuries, the Ayalyn Tatars were a well-defined ethnic group of the Tara Tatars, displaying an endogamy coefficient as high as 65 % in 1795 (Tomilov, 1981: 138). Such a comparison of the paleodemographic indicators between a population open to immigration and a demographically isolated group is of particular interest (Table 4).
The first difference is the prevalence of females in the Krivoshchekovo sample, while for Cheplyarevo-27 and Izyuk I an opposite sex ratio is observed. The relatively higher mortality of females in the settlements of the Krivoshchekovo Ob region than in the Middle Irtysh region villages might be a result of the differences in social, living, and even environmental conditions, which determine the main pattern of occupational activity, and the ways of biological adaptation to these conditions.
The population of Krivoshchekovo had been formed by the servicemen who migrated mainly from the Russian North (Mamsik, 2012: 89). But the waves of immigrants from European Russia might have included the Belarusians, Malorussians (Ukrainians), Poles, and Lithuanians (Ibid.: 105). The migrants were initially trading with the Teleuts in the early 18th century, but later they began to specialize in driving livestock and transporting goods to the right bank of the Ob River, along with fishing and domestic crafts (Ibid.: 49). As a historically established crossing for cattle, this place was convenient, because the Ob is shallow and has several islands there. The new settlers were arriving in the Krivoshchekovo Ob region with their own families, though the possibility of marriages of the migrant men with the Teleut women cannot be ruled out.
The first eleven families at Krivoshchekovo were registered by the 1710 census (Russian State Archive of Ancient Acts (RGADA), F. 214, Inv. 5, D. 434). These included 19 males, 18 females, and 50 children from 0 to 19 years of age: the first generation of the Krivoshchekovo population. According to confessional records and historical sources, many of those families belonged to the class of commoners (Mamsik, 2012: 108; Minenko, 1990: 42), i.e. both husbands and wives were quite far from peasant labor. As trade was carried out by men only, peasant life fell mainly on the shoulders
Table 4. Main paleodemographic indicators of the population from the Krivoshchekovo necropolis and some cemeteries of the Omsk Irtysh region
|
Indicator |
Krivoshchekovo |
Izyuk I (Yuzhakova, 2018) |
Cheplyarovo-27 (Ayalyn Tatars) (Yuzhakova, 2016) |
|
PSR (m–f) |
48.5–51.5 |
39.3–60.7 |
58.5–41.5 |
|
PSR (m–f) Juvenilis (15–24) |
23.3–76.7 |
20.0–80.0 |
50.0–50.0 |
|
PSR (m–f) Adultus (25–34) |
39.3–60.7 |
33.3–66.7 |
55.6–44.4 |
|
PSR (m–f) Maturus I (35–44) |
58.9–41.1 |
41.2–58.8 |
58.8–41.2 |
|
PSR (m–f) Maturus II (45–54) |
59.6–40.4 |
42.1–57.9 |
55.6–44.4 |
|
PSR (m–f) Senilis (55+) |
57.9–42.1 |
50.0–50.0 |
100.0–0 |
|
С (55+) |
4.11 |
1.53 |
1.9 |
|
Cm (55+) |
2.38 |
0.77 |
1.9 |
|
Сf (55+) |
1.73 |
0.77 |
0 |
|
PCD |
43.72 |
69.1 |
60.2 |
|
PSR (с–а) * |
43.7–56.3 |
69.1–30.7 |
60.2–39.8 |
|
PCNB. Newborn mortality in the children age cohort (%) |
18.81 |
44.2 |
12.9 |
|
PCB. Mortality during the first year of life in the children age cohort (%) |
13.37 |
21.0 |
21.0 |
|
AA. Mean age-at-death of adults of the sample ** |
35.4 |
35.1 |
41.3 |
|
AA (m). Mean age-at-death of males ** |
39.4 |
38.3 |
42.0 |
|
AA (f). Mean age-at-death of females ** |
33.9 |
33.4 |
39.7 |
*Adolescent individuals (Juvenilis) were included in the adult age cohort (а). **The mean age-at-death for the final age cohort (55+) was set to 57.5 years.
of women. Since 1759, the male part of the population was assigned the manufactures of the Altai District and had to carry out additional duties (Minenko, 1990: 65) that tore men away from their families for a long time. This increased the already heavy physical load of their wives. Taking this into account, it can be assumed that at least the first two generations of Krivoshchekovo women could not be well adapted to the local environmental conditions and occupation.
The population of Izyuk, according to ethnographic data, was formed not only from the Russian migrants but also from baptized representatives of the local Finno-Ugric groups, and the population was well integrated with neighboring communities (Berezhnova, Korusenko, Novoselova, 2001). Girls from Izyuk married mostly men from the old-residents’ villages close by. These males might have been of a non-Russian ethnic origin, and their fathers belonged to the peasant and service classes (Ibid.). The Ayalyn Tatars buried at Cheplyarovo-27, in turn, had at least four centuries of adaptation to the local environment and the formation of an adequate structure of social relations. This is reflected by such a paleodemographic indicator as the mean age-at-death of adults, which is substantially higher at Cheplyarovo than in the Izyuk and Krivoshchekovo groups.
The reconstructed demographic profile of the paleopopulation of Krivoshchekovo is basically similar to that observed in migrants and old residents of the Izyuk village. The mean age-at-death is low and almost identical in both groups, females are prevalent and most vulnerable at adolescence. Nevertheless, unlike those of Cheplyarovo-27, both the Izyuk and Krivoshchekovo samples included elderly females. The archives of the Krivoshchekovo Volost provide information about people who lived up to 90 years old.
The mean age-at-death of the adults buried at Cheplyarovo-27 is substantially higher than in the Izyuk and Krivoshchekovo samples. The sex ratio is biased towards males, owing to their higher survival to mature and elderly ages. An almost equal sex ratio in the adolescent and young adult cohorts is peculiar to the Cheplyarovo paleopopulation.
The proportion of subadult individuals in all three groups can be considered typical of the rural population. Despite the high total number of subadults (200 individuals), the percentage of this cohort at Krivoshchekovo was the lowest among the three paleopopulations: 43.7 % as compared to 69.1 % at Izyuk and 60.2 % at Cheplyarovo-27. The mortality of newborns and infants (first year of life) was accordingly lower in the Krivoshchekovo population. Thus, the level of subadult mortality in the population of the Krivoshchekovo Ob region in the 18th to early 19th centuries was typical for migrant and old resident Siberian groups, and even lower as compared to the aborigines of the Middle Irtysh area.
Conclusions
The osteological sample obtained during the excavation of the cemetery at Krivoshchekovo represents five generations of the inhabitants of this and neighboring villages. The territory of the cemetery was uncovered almost completely, and the age and sex determinations were made immediately after the end of the excavations, in stationary conditions at the IAET SB RAS. Our analysis of paleodemographic indicators is based on a representative sample of the inhabitants of the Krivoshchekovo Volost. According to the parish registers of St. Nicholas Church, 1374 people died from 1763 to 1841, during the period of the frequent use of the cemetery. Age and sex determinations were made for 462 individuals, i.e. for approximately 1/3 of the total number of the deceased. Nevertheless, we did not find it justified to apply the formulae of paleodemographic analysis to the mortality tables of the Krivoshchekovo sample, as the written sources suggest that the real population of this village was open to immigration.
The basic indicators of the demographic structure of the sample are in good agreement with the sociocultural characteristics reconstructed using archival data. The Krivoshchekovo population was formed mainly by migrants from European Russia; thus, its first two generations had to adapt to new environmental and living conditions, as well as to changes in occupational activity. This was complicated by periodical outbreaks of natural smallpox, which had been striking Siberia since the early 17th century. Young females and children from 1 to 4 years of age were the cohorts most vulnerable in this population.
While general trends in the level and pattern of mortality at Krivoshchekovo were similar to other large settlements of the Middle Irtysh region, subadult mortality was lower in the studied sample. This observation can be explained by the specifics of the social stratum that gave rise to the Krivoshchekovo population. The representatives of the commoner class among the
Krivoshchekovo first settlers had some level of education, the experience of living in cities, and could use their knowledge to create relatively safe sanitary and hygienic conditions in their homes. Some of them might even have some medical knowledge, as evidenced by the records of the causes of death in the parish registers (smallpox, tumors, consumption, etc.).
Summing up the results of the analysis of the demographic structure of the Krivoshchekovo population, reconstructed on the basis of anthropological and archival data, it can be concluded that, taken together, these data reliably reflect the features of the paleodemographic processes in the Novosibirsk Ob region in the 18th to early 19th centuries.
Acknowledgement
This study was supported by the Russian Foundation for Basic Research, Project No. 19-49-54-0006.
References The first settlers of Novosibirsk: the demographic structure of Krivoshchekovo, Western Siberia, in the 18th and early 19th centuries
- Acsadi G., Nemeshkeri J. 1970 History of Human Life Span and Mortality. Budapest: Akademiai Kiado.
- Alekseyev V.P. 1972 Paleodemografi ya SSSR. Sovetskaya arkheologiya, No. 1: 3–21.
- Alekseyeva T.A., Bogatenkov D.V., Lebedinskaya G.V. 2003 Vlakhi: Antropo-ekologicheskoye issledovaniye (po materialam srednevekovogo nekropolya Mistikhali). Moscow: Nauch. mir.
- Angel J.L. 1969 The bases of paleodemography. American Journal of Physical Anthropology, vol. 30: 427–438.
- Berezhnova M.L., Korusenko S.N., Novoselova A.A. 2001 Logisticheskiy analiz odnogo postroyeniya: Kak istoriki sozdayut mify. In Integratsiya arkheologicheskikh i etnografi cheskikh issledovaniy. Nalchik, Omsk: Om. Gos. Ped. Univ., pp. 48–56.
- Borisov V.A. 2001 Demografi ya. Moscow: Nota Bene.
- Chamberlain A.T. 2001 Palaeodemography. In Handbook of Archaeological Sciences, D.R. Brothwell, A.M. Pollard (eds.). New York, London: John Wiley and Sons, pp. 259–267.
- Elert A.K. 1988 Istoriko-geograficheskoye opisaniye Tomskogo uezda G.F. Millera (1734 g.). In Istochniki po istorii Sibiri dosovetskogo perioda. Novosibirsk: Nauka, pp. 59–101.
- Golodyaev K.A. 2016 Nikolskaya tserkov s. Krivoshchekovo Tomskoi gubernii. In Balandinskiye chteniya, vol. XI. Novosibirsk: Novosib. Gos. Univ. arkhitektury, dizaina i iskusstv, pp. 91–96.
- Hoppa J.W. 2002 Paleodemography: looking back and thinking ahead. In Paleodemography: Age Distributions from Skeletal Samples, R.D. Hoppa, J.W. Vaupel (eds.). New York: Cambridge Univ. Press, pp. 9–28.
- Mamsik T.S. 2012 Pervoposelentsy Novosibirskogo Priobya: Po materialam XVIII – serediny XIX v. Novosibirsk: Izd. SO RAN.
- Minenko N.A. 1990 Po staromu Moskovskomu traktu. Novosibirsk: Kn. izd. Paleodemography: Age Distributions from
- Skeletal Samples. 2002 R.D. Hoppa, J.W. Vaupel (eds.). New York: Cambridge Univ. Press.
- Pezhemsky D.V. 2003Opredeleniye biologicheskogo vozrasta v paleoantropologii i problema vozrastnykh intervalov. In V Kongress etnografov i antropologov Rossii. Omsk. 9–12 iyunya 2003 g.: Tezisy dokl. Moscow: IEA RAN, p. 255.
- Pezhemsky D.V. 2010 Polovozrastnaya struktura naseleniya Petrovskogo kontsa srednevekovogo Pskova. In Arkheologiya i istoriya Pskova i Pskovskoi zemli. Pskov: Izd. IA RAN, pp. 47–54.
- Tomilov N.A. 1981 Tyurkoyazychnoye naseleniye Zapadno-Sibirskoi ravniny v kontse XVI – pervoi chetverti XIX v. Tomsk: Izd. Tom. Gos. Univ.
- Weiss K.M. 1973 Demographic Models for Anthropology. Washington: Society for American Archeology.
- Yuzhakova A.V. 2016 Paleodemografiya naseleniya lesostepnogo Priirtyshya XVII–XVIII vv. (mogilnik Cheplyarovo 27). Vestnik Tomskogo gosudarstvennogo universiteta. Istoriya, No. 5: 169–174.
- Yuzhakova A.V. 2018 Paleodemografi cheskaya kharakteristika starozhilcheskogo naseleniya Omskogo Priirtyshya XVII–XVIII vv. (po materialam pamyatnika Izyuk I). Izvestiya Irkutskogo gosudarstvennogo universiteta. Ser.: Geoarkheologiya. Etnologiya. Antropologiya, vol. 25: 162–175.
