The global competitiveness index of Central East European countries and its changes in the period between 2006 and 2014

Author: Lks Lszl, Szira Zoltn, Othman Ghazala, Tth-Lks Klra
Journal: Региональная экономика. Юг России @re-volsu
Section: Фундаментальные исследования пространственной экономики
Article in issue: 2 (16), 2017.
Free access
The fact according to which the small open market economics with developed public administration are capable of rapid growth has proved to be true in the third millennium, as well. It especially holds true for Singapore, Finland, the Netherlands, Switzerland, Ireland and Denmark which also have a prestigious position in the Global Competitiveness Index (GCI) of the World Economic Forum (WEF).The countries of Central and Central East Europe more or less similar to them could be characterised by an improving economic position following their change of the regime and a painful transitory period. This process was closely linked to the integration process of the Central European countries to the EU. At that point the international analyses examining the development of the countries in transition judged Hungary’s competitiveness situation to be the best (ranking 27th place due to the radical economic reforms carried out previously according to the analysts)...
Competitiveness, gdp, gci, analysis, correlation, ranking, country groups, multivariate method, microeconomic
Short address: https://sciup.org/149131178
IDR: 149131178 | UDC: 65.9(4/8) | DOI: 10.15688/re.volsu.2017.2.1
Динамика индекса глобальной конкурентоспособности стран Центральной и Восточной Европы в 2006-2014 годах
Утверждение, согласно которому экономика небольшой страны с открытым рынком и развитым государственным управлением способна к быстрому росту, оказалось актуально и в третьем тысячелетии. Это особенно характерно для таких стран, как Сингапур, Финляндия, Нидерланды, Швейцария, Ирландия и Дания, занимающих престижное положение в рейтинге «Global Competitiveness Index» (GCI) Всемирного экономического форума (WEF). Страны Центральной и Центрально-Восточной Европы примерно так же, как и они улучшили свое экономическое положение, преодолев болезненный переходный к рыночной экономике период. Этот процесс был тесно связан с процессом интеграции стран Центральной Европы в ЕС. В ряде международных исследований, посвященных развитию стран в переходный период, сделан вывод, что добиться лучших показателей роста конкурентоспособности смогла Венгрия (27-е место в рейтинге), а Словения, Чешская Республика и Польша несколько от нее отстали. Вхождение в Евросоюз позволило странам Центральной Европы достичь более высокой стадии экономического развития и привело к изменению условий конкурентоспособности...
Text of the scientific article The global competitiveness index of Central East European countries and its changes in the period between 2006 and 2014
DOI:
Dismantling trade barriers together with the free flow of goods, services, people and capital coupled by technological advancement have contributed a lot to create new opportunities in global economy. As a result, governments have come up with a friendlier business climate to assist private businesses. The question of competitiveness is significant factor in analysing the economy. Various authors have approached the topic from different angles [3; 4; 6; 9; 11; 12].
Factors that determine growth and productivity that derive from the aggregate growth rates have also been changed [2]. Competitiveness is determined by various factors including the sound macroeconomic environment for growth, innovation and technology, responsible fiscal policy or the legal background that regulates the business environment with property rights, curbing on corruption and fair judiciary. In addition, education, knowledge and skills are one of the growth engines of productivity. There are basically two approaches to reflect competitiveness: one provides complex ranks on the basis of comparative examinations, while the other analyses only the difference in the development level of individual countries [5].
However, countries differ based on their starting conditions and stage of development among others.
The World Economic Forum has been updating the methodology for assessing competitiveness with regard to the changes in the global business environment. Although the index of WEF, Global Competitiveness Index (GCI), has been in use since 2006, it had to be supplemented and necessary changes and adjustments were made.
GCI takes into consideration the institutions, infrastructure, macroeconomy, health, education, market efficiency, technology, business sophistication and innovation when it comes to assessing productivity and competitiveness. It is important to note that only the concerted efforts will lead to results and none of the factors alone can result in competiveness.
Regarding the GCI for 2006 we can see Switzerland’s leading position while it overtakes Finland and Sweden and replaces the USA that came sixth. According to the GCI for 2014-2015 dominated by six European economies among the top 10 and by the Asian tigers, it is again Switzerland that leads the top 10. The USA’s position improved with its climbing to 3rd place by 2014. Within the EU, Germany and the UK still held their privileged positions and ranked eighth and tenth, respectively in 2006. However, by 2014 Germany’s position weakened by one place to 5th position. The UK climbs one spot to the 9th place in 2014-2015. In 2006, Italy’s budget deficits and public debt resulted in a continuing downward trend and Poland remained the worst performer within the EU behind Greece, Estonia, the Czech Republic and Slovenia. In 2014-2015 a gap between the competitive northern and western parts of Europe and its less competitive southern and eastern parts can still be experienced. However, the Czech Republic goes forward nine places to 37th position. The situation of the Russian Federation and Ukraine also improves while Poland maintains its 43rd place and Italy its 49th position.
In Asia, Singapore is leading followed by Japan, Hong Kong and Taiwan. India is 43rd out of 125 due to innovation and technological research-development in 2006. Singapore ranks as the second most competitive economy in the world in 2014-2015. Japan climbs three ranks to 6th and Hong Kong SAR retains its 7th position. In 2006 China fell from 48 to 54 as progress in institutional environment is necessary. The rating of Brazil went down from 57th to 66th owing to its budget deficit. Mexico remained stable in contrast with many Latin-American countries. In the Middle East Algeria and Morocco moved up together with Tunisia, the United Arab Emirates, Kuwait and Qatar while Egypt and Jordan moved downward in 2006. By 2014 Taiwan dropped two places. A downward trend can be felt in Australia and the Republic of Korea while, on the other hand, the positions of New Zealand, China and Thailand improved. India losing 11 places ranked 71st in 2014.
According to some economists, competitiveness means prosperity that countries can sustain. While GCI (calculated for 125 countries) focuses on the macroeconomic , political, legal and social aspects of economy, the Business Competitiveness Index (BCI) ranks 121 countries by their microeconomic competitiveness identifying competitive strengths and weaknesses by incorporating business conditions and company operations and strategies. BCI measures GDP per capita adjusted for purchasing power while focusing on sustainable prosperity [10].
However, competitiveness still remains a sometimes dubious concept despite its widespread prevalence. In general, competiveness is a country’s share of world markets for its products while productivity defines prosperity and depends on the value of national products and services. Consequently, competitiveness is measured by productivity. If productivity improves, prosperity will also improve. Among others, it is all mobilised human resources can lead to productivity [13].
Consequently, the productivity of a country consists of the productivity of its companies but a lot depends on the national business environment as well as people, information, processes, infrastructure, suppliers, research etc. The business environment can better be understood by the quality of factor (input) conditions, the context for firm strategy and rivalry, the quality of local demand conditions, and the presence of the related and supporting industries arranged. These four interrelated areas are often referred to as a diamond. According to it, almost everything matters for competitiveness and a lot of improvements are required [7].
We must, however, note that what have been strengths or competitive advantages at earlier stages of development can become weaknesses later on because the level of productivity must be higher. Improving competitiveness over time is one of the greatest challenges that countries face. Multiple levels affect competitiveness: national, state and local. There are differences in economic performance even within countries, not just across countries. Economic cooperation and coordination is an important tool for expanding trade and investment, as well as improving the business environment itself [8].
In our study on changing competitiveness the countries belonging to East or Central East Europe with regard to geographical and regional situation and ‘catching up’ in an economic sense regarding economic development were analysed. The World Economic Forum with its headquarters in Switzerland has been publishing its so-called GCI since 1979 which has examined the competitiveness of 144 countries recently. Its central indicator, the Global Competitiveness Index (GCI) is made up by the 12 most important factors (pillars) that characterise the competitiveness of a national economy concerned. GCI is based on three main sub-indices taking the 12 pillars into account [14; 15].
The first sub-index takes into account the basic conditions or fundamentals including institutions, infrastructure, macroeconomic environment, healthcare and elementary education. The second sub-index also called an efficiency enhancer, embraces the quality of higher education and trainings, the efficiency of the goods market and the labour market, the development of financial markets, the availability of technologies and the size of the market. The third sub-index also termed as the sub-index of innovation and refinement analyses the elaborateness of innovation and business processes.
GCI is made up by taking all these 12 pillars into account which also makes the compilation of the competitiveness ranking of countries possible (before 2005 indicators different from those listed above were used to define competitiveness so there was a separate business competitiveness index or a market share index but today GCI exclusively serves as the basis).
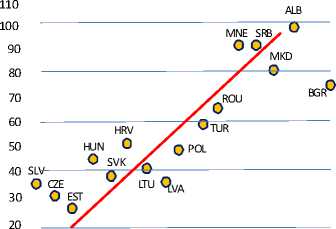
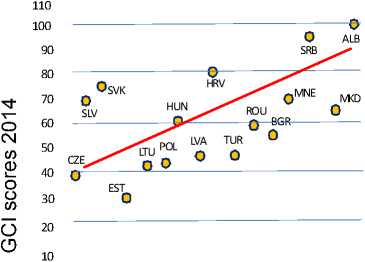
In our first examination correlations between the general GCIs based on the pillars as of GDP per capita and the WEF reports are analysed (Fig. 1).
By extending the examination this way it can be seen that in 2006 the correlation between GDP and GCI as tight ( r = 0.900). While examining 2014, this correlation became more loose and the value of the correlation coefficient was of medium strength ( r = 0.536). It also shows that in 2006 the value of GDP per capita marked the place in the competitiveness ranking by nearly 80 % ( r 2 = 81 %), which became only less than 30 % by 2014 ( r 2= 28.7 %).
The diagram on 2006 data shows that the leading countries on the basis of GDP per capita are usually also placed at the top of the competitiveness ranking with Slovenia, the Czech Republic and Estonia in the most favourable positions. In contrast, by 2014 the positions of GDP per capita and the competitiveness pillars became more differentiated. Regarding GDP per capita two countries (SVN, SVK) can still be counted to the leading ones while their position in the competitiveness ranking significantly deteriorated and the so-far visibly strong correlation seems to be broken here. Figure 2 presents the value of GDP per capita per country in the two periods, i.e. in 2006 and 2014 while Figure 3 illustrates the correlations between the GCIs of the periods concerned.
The values of GDP per capita in the two years (Fig. 2) show a very strong correlation ( r = 0.915).
Figure 2 also illustrates that taking the GDP per capita ranking into account the Czech Republic preserved its favourable position; Slovakia,
0 2 4 6 8 10 12 14 16
GDP per capita 2006
о
0 2 4 6 8 10 12 14 16
GDP per capita 2014
Fig. 1. Correlation between GDP per capita and GCI:
ALB – Albania; HUN – Hungary; ROU – Romania; BGR – Bulgaria; LTU – Lithuania; SRB – Serbia; CZE – the Czech Republic; LVA – Latvia; SVK – Slovakia; EST – Estonia; MKD – Macedonia; SVN – Slovenia; HRV – Croatia; MNE – Montenegro;
TUR – Turkey; POL – Poland
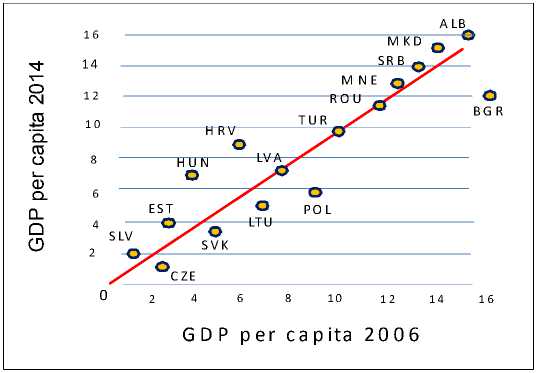
Fig. 2. The correlations between GDP per capita rankings in 2006 and in 2014
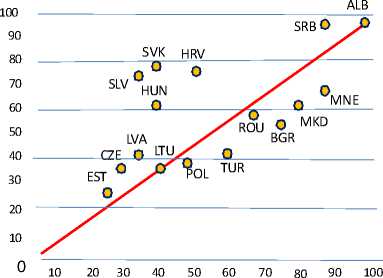
Lithuania, Poland and Bulgaria improved their situation while that of Estonia and Slovenia weakened to a small extent and Hungary, Croatia, Montenegro, Serbia and Macedonia to a great extent while leaving Albania at the end of the ranking. The position of Latvia, Turkey and Romania in the ranking of GDP per capita did not change during the examined period. All in all, there were only slight changes in the countries’ ranking while the GCIs of the two examined years (Fig. 3) showed significantly fewer similarities ( r = 0.639).
The stagnation of the GCIs within the period results in the formation of three groups of countries. The position of Hungary, Croatia, Slovakia, Serbia and Slovenia in the ranking significantly weakened while a little improvement could be seen in the case of Turkey, Bulgaria, Macedonia Montenegro, Romania and Poland. A little decline is noticeable in the Czech Republic and Estonia but excluding it, of the examined countries they kept their leading role. The changing positions of some countries in the ranking are a sign of improvement just like in the case of Romania, Macedonia, Montenegro, Bulgaria, Turkey and Poland.
All in all, it can be seen that the GCI, by signalling the unique changes in the period, is more and more loosely tied to the ranking of GDP per capita.
Our examinations have been extended in a unique aspect when the correlations between the GCI of 2006 and the GDP per capita ranking of 2014 were examined (Fig. 4).
An extremely strong correlation was found between the GCI of 2006 and the GDP per capita ranking of 2014 ( r = 0.941). The positions of the examined countries and the groups formed are nearly similar to the positions illustrated by Figure 2. Figure 5 examines the correlation between the GDP per capita ranking of 2006 and the GCI of 2014.
The GDP per capita rankings of 2006 and the GCI of 2014 are very weakly and non-significantly correlated ( r = 0.383). It can be seen that the position of two countries, Poland (POL) and (TUR), significantly improved by 2014, especially when taking the values of GDP per capita into account, which has justified our hypothesis, according to which during the examined period the positions in the GCI were less and less affected by the GDP per capita value of the country. It is worth summarising our comparisons in a table (Table 1).
Q О
GCI scores 2006
Fig. 3. Correlations between the GCIs of 2006 and 2014
ALB
__о
LVA
—о HUN
____° POL
LTU POL
MKD
° оSRB
BGR Q
ROU о MNE
TUR о
HRV 0 ______________
о
EST О
----О----------------------
SLV о SVK --
CZE о
10 20 30 40 50 60 70 80 90 100
GCI scores 2006
Fig. 4. Correlations between the GCI of 2006 and the GDP per capita ranking of 2014
Correlations ( r ) between GDP per capita (GDP/c) of 2006 and 2014 and GCI
|
GDP/c. 2006 |
GDP/c. 2014 |
GCI 2006 |
GCI 2014 |
|
|
1 |
GDP/c. 2006 |
|||
|
0.915 |
1 |
GDP/c. 2014 |
||
|
0.899 |
0.941 |
1 |
GCI 2006 |
|
|
0.383 (NS) |
0.536 |
0.649 |
1 |
GCI 2014 |
CXI
У)
CD
CD
О О
SLV
CZE
SVK HRV
HUN
о EST
SRB ALB
”o---CT
■ ' MNE
M KD
ROU о
—о-
LTU LVA POL О
О о V TUR
BGR
4 6 8 10 12 14 16
GDP per capita 2006
Fig. 5. Correlation between the GDP per capita ranking of 2006 and the GCI of 2014
Table 1
Our results give an opportunity to carry out further examination in which an answer is sought how the 12 competitiveness pillars are related to the positions typical of GDP per capita and GCI.
The competitiveness pillars were organised by the WEF in the following three sub-indices (factors).
A – the first four basic sub-indices-fundamentals ( Basic requirement )
B – efficiency enhancing sub-index ( Efficiency enhancers )
C – Innovation sub-index – innovation and complexity ( Innovation factors ).
These sub-indices are also worth being included in the examination to see how they are related to GDP per capita values and GCI. The results are summarised by Table 2, 3.
Data of the tables show that the correlation between the sub-pillars and GDP per capita values decreased to a smaller extent by 2014 in contrast with 2006 than it seemed in our examinations with the previous general GCI (Fig. 1).
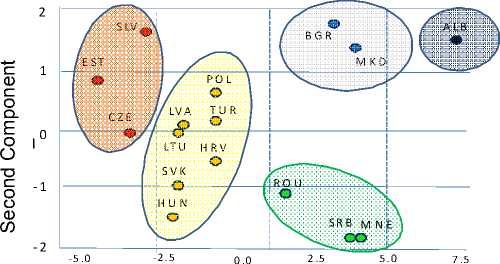
Analysing our data on GDP per capita and GCI by multi-variate method, based on the similarities in the data of the ranking by the 12 pillars the countries examined can be characterised by forming groups in 2006 (Fig. 6).
Base on the 2006 data the situation of the Czech Republic, Slovenia and Estonia are in the most favourable position followed by a more populous group of Hungary, Croatia, Lithuania, Latvia, Slovakia, Poland and Turkey. Three countries, namely Romania, Serbia and Montenegro follow them separated a bit lagging behind. Bulgaria and Macedonia can be regarded as significantly lagging behind and Albania can be found as the only tail ender.
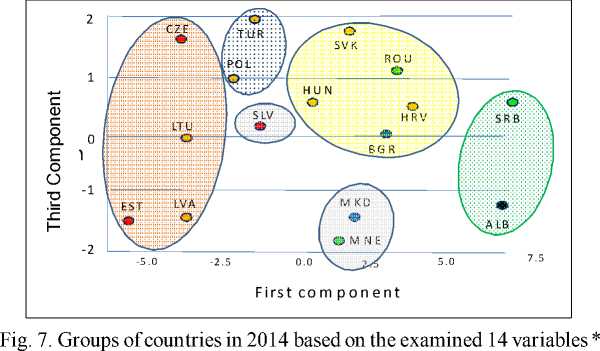
It is interesting to compare our data of 2006 with the formation of groups based on 2014 data (Fig. 7). By this time the leading group was extended to four countries: the Czech Republic with the three Baltic countries of Estonia, Latvia and Lithuania. Our analysis shows that Slovenia is no
Table 2
Correlations between GDP per capita ranking of 2006 as well as GCI and the sub-indices
|
2006 |
GCI ranking |
sub-index ‘A’ |
sub-index ‘B’ |
sub-index ‘C’ |
|
GDP pc |
0.899 |
0.786 |
0.91 |
0.899 |
Table 3
Correlations between GDP per capita ranking of 2014 as well as GCI and the sub-indices
|
2006 |
GCI ranking |
sub-index ‘A’ |
sub-index ‘B’ |
sub-index ‘C’ |
|
GDP pc |
0.536 |
0.674 |
0.695 |
0.778 |
First component
Fig. 6. Groups of countries in 2006 based on the examined 14 variables *
Note. * – together with the 12 pillars and values of GDP per capita and GCI.
Note. * – together with the 12 pillars and values of GDP per capita and GCI.
longer part of the leading countries and stands aloof to form the second most competitive group. The countries significantly improving their previous positions, i.e. Poland and Turkey follow Slovenia in the ranking. After them another populous group of five countries can be seen including Hungary, Croatia, Romania, Bulgaria and Slovakia.
Macedonia and Montenegro can be regarded as countries moderately weakening their positions while Serbia’s setback is significant with Albania coming as the tail ender.
Conclusions . Our analyses can be summarised by the groups of Figure 8. The figure illustrates the changes in the positions of the five
|
2 014 2006 |
1 |
2 |
3 |
4 |
5 |
|
1 |
CZE EST SLO |
||||
|
2 |
LVA LTU |
POL TUR |
HRV HUN |
||
|
3 |
ROM |
MNE |
SRB |
||
|
4 |
BGR |
MKD |
|||
|
5 |
ALB |
Fig. 8. Changes in the groups of countries based on GCI ranking changes countries in 2006 vertically and 2014 horizontally. Countries improving their GCI positions significantly are displayed in bold including Latvia, Lithuania and Bulgaria.
Countries that practically preserved their former positions are italicised including the Czech Republic , Estonia , Slovenia , Poland , Turkey , Romania , Macedonia and Albania .
Countries that weakened their GCI ranking compared to the previous period are circled in an oval shape including Hungary , Serbia , Slovakia , Montenegro and Croatia .
However, it is important to note that the stagnation, lagging behind or improving positions per country groups in the table are not consistent with the simple changes of data based on GCI rankings of the countries serving as the basis of the analysis. In addition to their different rate of economic growth the relative stagnation, lagging behind or improving positions of the examined countries are also due to the nature of their different economic development policies.
References The global competitiveness index of Central East European countries and its changes in the period between 2006 and 2014
- Aiginger K., Barentthaler S., Vogel S.J. Competitiveness under New Perspectives, WWW FOR EUROPE, WELFAREWELTWOR, Working Papers, no. 44, October 2013, THEME SSH. 2011.1.2-1. Socio-economic Sciences and Humanities Europe moving towards a new path of economic growth and social development. Collaborative project, 2013, pp. 1-97. (This paper can be downloaded from www.foreurope.eu).
- Berikou N. A Comparative Analysis of World Competitiveness Record and a Cost Projection resulting from the Lack of Competitiveness in Greek Economy. 3rd Hellenic Observatory PhD Symposium, Hellenic Observatory, European Institute, London School of Economics and Political Science, June 14-15, 2007, pp. 1-24. Available at: http://www.lse.ac.uk/europeanInstitute/research/hellenicObservatory/pdf/3rd_Symposium/PAPERS/BERIKOU_NEKTARIA.pdf.
- Hurduzeu G., Lazarn I. Analysis of Economic Growth, Competitiveness and Macroeconomic Imbalances in the European Union. The Romanian Economic Journal, 2015, no. 57, pp. 1-14.
- Mc. Arthurand J., Sachs J. The Growth Competitiveness Index: Measuring technological advancement and the stages of development. In The Global Competitiveness Report 2001-2002 (ed. by M.E. Porter, et al.). New York, Oxford University Press, 2001, pp. 28-51. Available at: http://earth.columbia.edu/sitefiles/file/Sachs%20Writing/2002/WorldEconomic Forum_2001-2002_GlobalCompetitivenessReport2001-2002_GrowthCompetitivenessIndex.pdf.
- Kа́poszta J., Nagy H. Gross Domestic Product as an indicator of regions’ competitiveness for plant-soil interrelations. Cereal Research Communications, Supplement, Akadйmiai Kiadу. Budapest, 2008, vol. 36. 2039 p.
- Kovacic A. Competitiveness as a Source of Development, Working Papers, no. 28, 2005. Institute for Economic Research, 2005, Ljubjana, March, pp. 1-30. Available at: http://www.ier.si/files/Working%20paper-28.pdf.
- Kovacic A., Stanovnik P. Measuring Competitiveness National Economies with Emphasis on Slovenia, Working Papers, no. 6, 2000. Institute for Economic Research, 2000, Ljubjana, September, pp. 1-29. Available at: http://www.ier.si/files/Working%20paper-31.pdf.
- Lall S. Competitiveness Indices and Developing Countries: An Economic Evaluation of the Global Competitiveness Report. World Development, Elsevier, 2001, vol. 29 (9), pp. 1501-1525. Available at: http://www. sciencedirect.com/science/article/pii/S0305750X01000511.
- Leichter J., Mocci C., Puzzuoli S. Measuring External Competitiveness: An Overwiew, MEF Working Papers, 2010, no. 2, April. Ministry of Economy and Finance, Department of the Treasury, pp. 1-55. Available at: http://www.dt.mef.gov.it/export/sites/sitodt/modules/documenti_it/analisi_progammazione/working_papers/WP_Competitiveness__280410_EN__final.pdf.
- Porter M., Sachs J., McArthur J. The Growth Competitiveness Index: Measuring technological advancement and the stages of development. The Global Competitiveness Report 2001-2002 (ed. by M.E. Porter, et al.). New York, Oxford University Press, 2001, pp. 28-51. Available at: http://sdnbd.org/sdi/issues/economy/ExecSumm-competitiveness-ranking-2001.pdf.
- Porter M. Business Competitiveness Index. World Economic Forum, the Global Competitiveness Report 2005/06. Palgrave Macmillan, pp. 1-598. Available at: http://www3.weforum.org/docs/WEF_Global CompetitivenessReport_2006-07.pdf.
- Porter M. The Competitive Advantage of Nations. New York, Free Press, 1990, pp. 1-58. Available at: http://94. 236.206.206/dohodi.net/books/en/Business% 20Books/Michael%20Porter/Michael.Porter.Competitive. Advantage.pdf.
- Squally J., Wilson K., Hogo S. An analysis of growth competitiveness, Economic Policy Research Unit. Working Papers. EPRU Zayed University Paper, 2006, no. 06-01, pp. 1-39. Available at: http://www.zu.ac.ae/research/images/06-01-web.pdf.
- The Global Competitiveness Report 2006-2007. World Economic Forum, Geneva, Switzerland, 2006, pp. 1-598.
- The Global Competitiveness Report 2014-2015. World Economic Forum, Geneva, Switzerland, 2015, pp. 1-565.
