The impact estimation of large mining projects using system dynamics methodology
Автор: Ariun-erdene D., Ochirbat B., Uuganbayar B.
Журнал: Вестник Бурятского государственного университета. Математика, информатика @vestnik-bsu-maths
Рубрика: Математическое моделирование и обработка данных
Статья в выпуске: 1, 2023 года.
Бесплатный доступ
Every year, countries around the world keep the economic and social balance and further prosper by implementing projects in all areas in accordance with their long-term and medium-term plans. Our country has planned a number of similar long-term and medium-term projects. For example, the ’Vision 2050 longterm development policy document of Mongolia’ envisages 157 projects with 9 basic objectives, and a number of medium-term projects planned for the five-year development plan for Mongolia in 2021-2025. This system dynamics model was developed to estimate the economic impact of 26 mega-projects in three sectors from these projects and to prioritize their implementation. Mining projects cannot be implemented on their own, and infrastructure projects (energy, roads, railways) need to be developed in parallel, so these large projects have been taken into consideration as well. For this model, the experimental simulation period will start in 2010 and will run until 2030. This means that a simulation analysis is made on general characterictics of the dynamics for the next 10 years based on the historical data and statistics from the previous 10 years. The system dynamics model for estimating the economic impact of the mega projects is built on 38 sectors consisting of 37 common differential equations with a total of more than 2,000 variable parameters that can generate and view some basic social, economic and environmental indicators of 21 aimags and the capital city of Mongolia individually. The model was developed using the system dynamics modeling method in the Vensim program, calculated using the Runge-Kutta 4th-order numerical method, and the social, economic, and environmental impacts of each of the major projects were demonstrated.
System dynamics, mega project, experimental simulation, economy, vensim program
Короткий адрес: https://sciup.org/148325904
IDR: 148325904 | УДК: 519.86 | DOI: 10.18101/2304-5728-2023-1-47-57
Текст научной статьи The impact estimation of large mining projects using system dynamics methodology
Mongolia ranks 92nd out of 177 countries in terms of human development, 99th out of 140 countries in terms of economic competitiveness, 74th out of 190 countries in terms of business environment, and 93rd in terms of corruption [3] . In many respects of development indicators, Mongolia is still below the regional average and the world average.
In conclusion, Mongolia’s future macroeconomic policy should be sustainable in the long-term, counter-cyclical, protected from adverse external market changes and self-sustaining by stabilizing the economy in the medium term through a detailed approach to debt burden and cost growth. There is a real need to focus on comprehensive policies that support economic growth, human development and middle-income people. The increase in investment in mega-pro jects is driven by a number of key factors, including the financial situation of major powers, scientific and technological advances, project implementation conditions and demand.
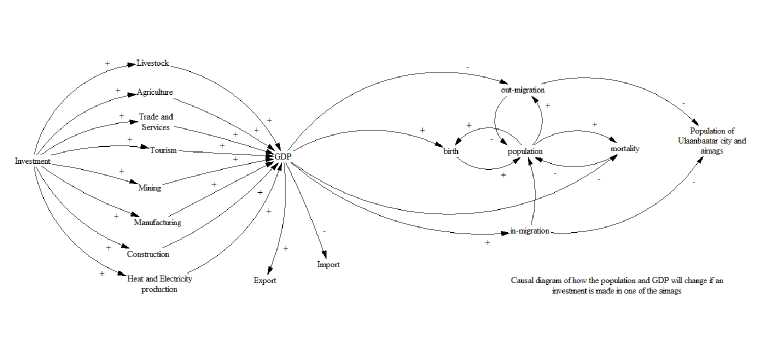
Figure 1: Causal diagram
Economic sectors are modeled into 8 sectors, namely Livestock, Agriculture, Trade and Services, Tourism, Manufacturing, Construction, Mining, and Heat and Electricity production and covered 21 aimags and Ulaanbaatar separately.
Of these, the Cobb-Douglas production function was used to model the Trade and Services, Tourism, Manufacturing, Construction, Mining, and Heat and Electricity production sectors. This function was chosen for a number of reasons including a possibility of retrieving parameters such as the sector’s fixed assets, investment, labor force, labor productivity and it is more convenient for impact estimation of education, health and infrastructure sectors as well as for conducting experimental simulation.
-
1 Research methodology
The system dynamics, which was founded by the American scientist J. Forester in 1958, is a methodology for experimenting with dynamic models and developing solutions to complex and complicated problems in the systems such as industry, urban planning, and environment [6] . Initially used only in industry, the methodology has now been used successfully in corporate governance, market fluctuations, labor instability, public policy design, economics, environmental research, and in every science aspects of the society [5] .
A model is a substitute for a real system, and a model is used when it is easier to work with the substitute than with the real system. Sterman (2014) described the system dynamics and simulation methods as a way to find out how a complex system works in circumstances that are too slow, too costly, or have more ethical consequences for experimenting in the real system.
System dynamics models are based on three sources of information: quantitative data, written databases (reports, user manuals, etc.), and expert knowledge of key participants of the system. In this study, the system dynamics model was built in Vensim. Vensim is a professional software for dynamic modeling, in which a system of ordinary differential equations is calculated with high-precision numerical methods (Euler, Kunga-Kutta) at each instant of time, and the solution is represented numerically and graphically.
-
2 System dynamics model
-
2.1 Population sector
-
Birth and mortality rates, and migration are inevitably considered in development policy planning as population and growth rates have a significant impact on society and the economy, The population increases with birth, decreases with mortality, and changes with net migration. the difference between immigration and emigration Net migration is the difference between in-migration and out-migration. We have modeled the in-migration and outmigration rates in relation to the economic capacity (GDP) of Ulaanbaatar and the aimags [2] [4] .
The model is unique in a way that the population can be viewed in detail by age, sex, Ulaanbaatar city and aimags. The exponential law of P (t) = P0ektP with the equation = kP is used to calculate the population dt growth.
dti = (α - β + γ)Pi, i = 1, . . . , 70, where,
α - birthrate,
β - deathrate, γ - migrationrate, P - population.
The mining sector, one of the eight sectors of the economy is taken as an example.
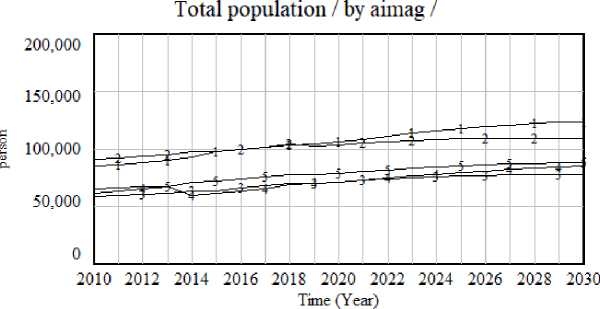
"Total population / by aimag ■ "[Баянвлпш]: current ---1---------:---------1---------1--------
"Total population / by aimag "[ДарханУул]: current -----2---------2---------2---------2------
"Total population / by aimag ■ "[Дорноговь]: current -------3---------3---------5---------3----
"Total population ■ by aimag • "[Омнеговь]: cuirent 4---------4---------4---------4---------4—
"Total population / by aimag ■ "[Хэнтий]: current -----5---------5---------5---------5---------5-
-
Figure 2: Population
-
2.2 Mining sector
The mining sector is modeled for Ulaanbaatar and 21 aimags, with production and the number of workers employed in the industry as key variables. The Cobb-Douglas production function was used to model the mining sector. The production variable in the mining sector represents the annual value added of the mining sector.
The estimation is made in a way that the Cobb-Douglas production function Y refers to the following:
Yj =fj(L,K,X1,X2,X3), j = 1,...,8, where,
L - capital,
K - labor,
X 1 - life expectancy index,
X 2 - education index,
X 3 - inf rastructure index.
Variables such as education, infrastructure, health, technology, and natural disasters were considered for their impact on mining productivity. They are led by relative life expectancy, natural disaster impact, relative secondary education index, relative infrastructure density, science budget and relative skills density tight binding parameters. The future dynamics of the mining industry is estimated as follows.
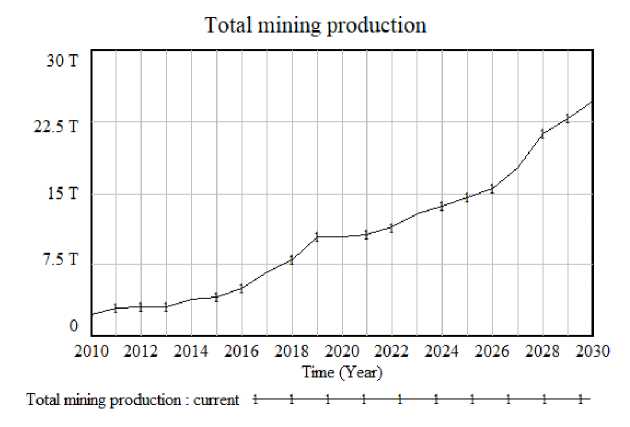
Figure 3: Mining industry
-
2.3 Environmental sectors
As the society and economy grow, the issue of its negative impact on the environment and ecology has become more critical. In this model we aimed to estimate water resources, greenhouse gases, and hazardous waste in Ulaanbaatar and in each of the 21 aimags. We also aimed to demonstrate that while the implementation of mega projects will have a positive economic impact, it will also have a negative impact on the ecology. For example, when estimating the greenhouse gas, Industrial sectors, Household consumption of raw and refined Coal, Number of vehicles, Number of livestock converted into sheep-equivalent head are taken as the main greenhouse gas emission variables and Forest area is considered as absorption variable.
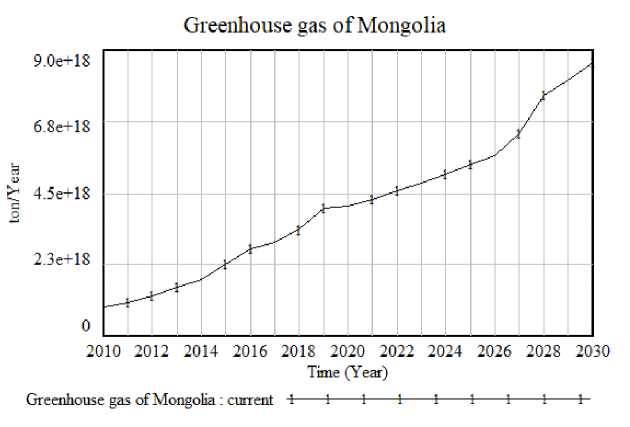
Figure 4: Greenhouse gas
-
3 Inter-sectoral balance
Inter-sectoral balance is a statistical analysis research methodology intended to illustrate economic conditions, their balanced ratios, the economic sector structure and its interrelations and the role of priority sectors as well as assessments of macroeconomic issues such as intermediate and final consumption, capital accumulation, and the impact of exports and imports on the economy. The inter-sectoral balance and its analysis is used to determine economic and social development policies, the impact of certain economic indicators and the future trends.
Leontief input-output model, which is based on inter-sectoral balance, is widely used in the analysis of complex economic, social, and environmental processes. The basic idea of the model was first formulated in the 1920s by the Soviet economist V. Leontiev and it was used to study the structure of the US economy and eventually has been developed as an internationally accepted standard methodology [1] .
Currently, inter-sectoral balances have been established in about 100 countries around the world and are used for macroeconomic research and forecasting. In 1963, the first inter-sectoral balance was established in our country during the centrally planned economic system. Currently, starting from 2010, the National Statistical Office has compiled Resource Utilization Tables for
68x55, 48x32, 32x20, 20x20, 5x4 products, services and sectors and subsectors respectively, and constructed the inter-sectoral balances at 55, 48, 32, 20 and 4 sub-sector level that are reported on its website 1212.
This analysis used an ”input-output table” compiled in 2017 that cover 20 sectors. This is the latest version of the inter-sectoral balance published to the public. The interrelation between the sectors does not change much in the short term, so the analysis results will be less distorted.
Based on the inter-sectoral balances, we calculated a post-change matrix for the final product.
|
Д4 и о щ |
ф 3 о ад |
ш ф ■> ф со ■-U Д Д Ф -Д |
3 еЗ |
ад '3 |
ад 3 о я § S |
"ф и |
я я "Я о "о Ф И -я я "3 ф К |
о 3 |
о X И |
||
|
1 |
Livestock |
1 |
0 |
0.01 |
0.01 |
0 |
0.07 |
0.01 |
0.01 |
11 |
0.03 |
|
2 |
Agriculture |
0.01 |
1 |
0.01 |
0 |
0 |
0.04 |
0 |
0.03 |
7.3 |
0.05 |
|
3 |
Trade and Services |
0.01 |
0.01 |
1 |
0.01 |
0 |
0 |
0.01 |
0.01 |
22.9 |
0.15 |
|
4 |
Tourism |
0.01 |
0 |
0.2 |
1 |
0 |
0 |
0.01 |
0.1 |
88 |
0.14 |
|
5 |
Mining |
0.026 |
0.02 |
0.15 |
0.04 |
1 |
0.073 |
0.14 |
0.4 |
94.6 |
0.2 |
|
6 |
Manufacturing |
0.33 |
0.3 |
0.08 |
0.06 |
0.03 |
1 |
0.02 |
0.13 |
42.8 |
0.15 |
|
7 |
Construction |
0 |
0 |
0.02 |
0 |
0 |
0 |
1 |
0.5 |
0 |
0.18 |
|
8 |
Heat and Electricity production |
0 |
0.01 |
0.01 |
0 |
0 |
0.02 |
0.01 |
1 |
0 |
0.1 |
You can see the following estimation from the table above: if the mining sector of Mongolia grows by 1 percent, the livestock sector will grow by 0.026 percent, the agriculture will grow by 0.02 percent, the trade and services will grow by 0.15 percent, the tourism will grow by 0.04 percent, and the manufacturing sector will grow by 0.073 percent, the construction sector will grow by 0.14 percent, the electricity and heat production will grow by 0.4 percent, imports will grow by 0.2 percent, and 94.6 percent of the mining sector products are exported.
With the help of the above matrix, interrelations between the eight sectors of the economy have been calculated, and any investment in any of these sectors will have an impact on other sectors.
4 Prioritization of projects
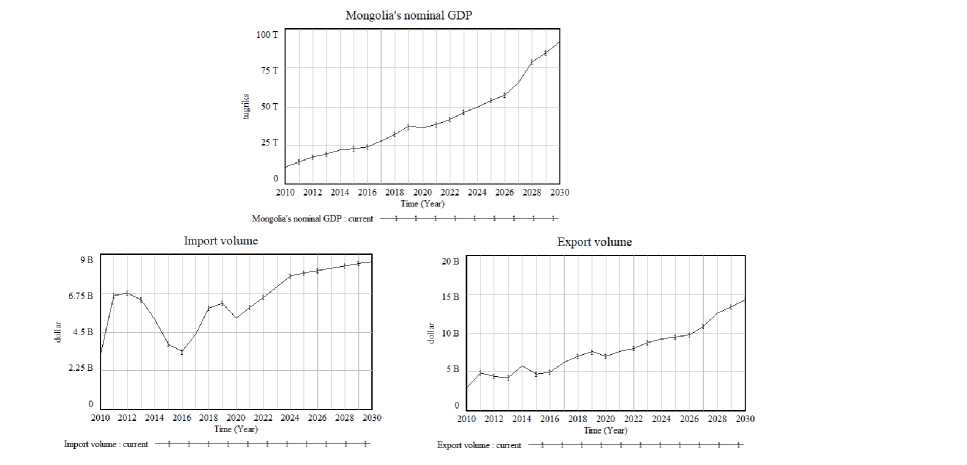
Figure 5: Key economic indicators
The following table summarizes the prioritization of the projects ranking them on the lowest score principles.
|
Pro ject name |
|
|
1 |
Commissioning of the Oyu Tolgoi underground mine |
|
2 |
Oil refinery project |
|
3 |
Construction of 435 km Tavan Tolgoi-Manlai-Khangi auto road |
|
4 |
Tsagaan Suvarga copper and molybdenum plant project |
|
5 |
Road project from Tavan Tolgoi to Tsagaandel mountain border crossing |
|
6 |
Natural gas extraction project to from lignite coal |
|
7 |
Construction of Tavan Tolgoi Coal Concentrator Pro ject |
|
8 |
Tavan Tolgoi-Gashuunsukhait railway construction pro ject |
|
9 |
Tavan Tolgoi 450 MW Power plant project |
|
10 |
Creation of metallurgical complex project |
The labor productivity variable of the Cobb-Douglas production function is increased by the infrastructure influence, which in turn increases the production size of the given industry. Therefore, an investment in roads and railways has the greatest impact over other investments, as it increases the production of the construction sector during the construction period and, when completed, it has impacts in all sectors of the economy as infrastructure variable effects.
It is estimated that upon implementation of all the above mentioned projects, Mongolia’s nominal GDP could grow by 36.6 percent in 2030, more than the normal growth rate.
|
If all the projects implemented in 2030 |
Numerical value |
Growth |
|
|
1 |
Nominal GDP |
137,8 trillion tugriks |
will grow by 50,0 percent |
|
2 |
Export volume |
3,3 billion dollars |
will grow by 37,7 percent |
|
3 |
Import volume |
49,2 million dollars |
will decrease by 0,05 percent |
|
4 |
Number of jobs |
1432427 |
166510 new jobs will be created |
Conclusion
This system dynamics model has been developed in order to examine the social and economic impact of the Mongolia’s planned mining projects when implemented and the investment of which sectors will have the highest positive impact on the economy.
The Mongolian economy is demonstrated by 8 main sectors, 21 aimags, and Ulaanbaatar respectively, and the Cobb-Douglas production function is used to calculate the future prospects. Using the NSO’s 2017 inter-sectoral balance sheet outcome we estimated the impact of investments on total production, employment, exports and imports, and the main results of the model are as follows.
Investments in the mining industry, road and infrastructure sectors lead to the highest increase in production or GDP.
Investments in the mining extraction, road and infrastructure sectors are more supportive of exports than in other sectors.
The analysis of estimating the impact of one sector investment on other sectors demonstrate that investments in manufacturing, mining, road and transportation sectors will have the greatest impact on increasing production in other sectors, or investments in one of these sectors will increase the production in other sectors the most.
When the same amount of investment is made in all sectors, the change in the workforce will be highest in the transportation sector and lowest in the mining sector.
Among the potential sectors in terms of implementing mega-pro jects, the transportation and mining sectors have the highest import inputs, while some energy sectors and oil production have a potential to decrease imports.
Список литературы The impact estimation of large mining projects using system dynamics methodology
- Tegshjargal Ts., Tsend-Ayush G. Detailed analysis of inter-sectoral balance 2010 - 2015. NSO, 2015.
- NSO. Statistical Yearbook of Mongolia 2010 - 2019. BCI LLC.
- World Development Indicators 2002 - 2017. URL:.
- NSO. URL: https://www.nso.mn/mn.
- Meadows D. H., Meadows D. L., Randers J., Behrens W. W. The Limits to Growth. New York: Universe books, 1972.
- Forrester J. Principles of System. Massachusetts: Productivity press, MA, Cambridge, 1968.

