The importance of the quality of urban public transport and a methodological example for weighting the typical quality criteria

Author: Borbs Pter Dniel
Journal: Региональная экономика. Юг России @re-volsu
Section: Фундаментальные исследования пространственной экономики
Article in issue: 2 т.10, 2022.
Free access
The life and functioning of cities are fundamentally influenced by the complexity and quality of the transport system available to meet mobility needs. In the context of the development of urban areas, the expected environmental impacts, such as emissions, space utilization and noise pollution, are important considerations for decision-makers because different modes of transport have different characteristics. Strengthening the role of public transport is a key tool for sustainable urban development. It is important for local and central government to know what is the most effective way to increase passenger numbers and how to improve the satisfaction of public transport users. Defining intervention priorities is an important issue due to resource constraints, so it is necessary to explore which improvement in factors has a more intense impact on user satisfaction and which factors are less important (classification of strengths and weaknesses in terms of customer satisfaction). One way to do this may be to rank the different quality characteristics that are part of the overall evaluation. The following study provides an example of a weighted ranking method for different quality performance indicators.
Transport systems, modes of transport, passenger cars using, public transport, passenger satisfaction, quality aspects, guilford’s procedure, weight numbers
Short address: https://sciup.org/149140618
IDR: 149140618 | UDC: 332.13 | DOI: 10.15688/re.volsu.2022.2.9
Качество городского общественного транспорта и методика определения типичного критерия качества
Жизнь и функционирование городов главным образом зависят от сложности и качества транспортных систем, обеспечивающих жителей возможностью передвижения. В условиях развития городских пространств ожидаемое влияние на окружающую среду, в частности, выбросы загрязняющих газов, использование пространства и шумовое загрязнение, являются важными факторами для принятия решений, поскольку различные виды транспорта имеют свои характеристики. Увеличение роли общественного транспорта является ключевым фактором развития городов. Для федеральных и региональных властей важно знать, что станет самым эффективным способом для увеличения пассажиропотока и удовлетворенности общественным транспортом. Также существенным для региональных органов управления является определение приоритетов в управлении из-за ресурсных ограничений. Таким образом, принципиально изучить те изменения в факторах, которые имеют большее влияние на удовлетворение потребителей и то, какие факторы являются менее значимыми для управления транспортом (классификация сильных и слабых сторон в случае удовлетворенности потребителей). Одним из способов осуществить вышеуказанный анализ может быть ранжирование различных качественных характеристик, которые входят в общую оценку. Данное исследование представляет собой пример метода процентного ранжирования различных качественных параметров.
Text of the scientific article The importance of the quality of urban public transport and a methodological example for weighting the typical quality criteria
DOI:
The strengthening of motorisation apparently increases mobility requirements. In 2017, journeys of already 6111 billion passenger kilometres took place in the EU-28 member states (taking only land transport into consideration), which means a 13% increase from the data of 2000. In this performance, passenger cars had a share of 80.2%, buses had a share of 8.3%, large railways and two-wheeled vehicle represented 7.7% and 2% respectively, and underground and tram networks provided 1.8%. In the case of most modes of transport, passenger transport performance increased, but it is important to point out that in the case of the later accessing EU-13 member states (including Hungary), the use of passenger cars grew very intensively, all in all by more than 50% compared to 2000 (Figure 1) [EU Transport in figures ... , 2019].
In the European Union, it is a typical feature of urban areas, especially larger cities that community transport, walking and cycling play more and more important roles in the daily commute to work [The First and Last ... , 2019].
The ratio of people travelling to work by community transport is extremely high in the larger cities and capitals of the European Union, where services of integrated transport networks are available. Another good example is that the ratio of people taking the public transport to work in Paris was 50.8% in 2017, as opposed to the national average value of 15.8%. Similarly, in the same year, in the Estonian capital, Tallinn, the ratio of people using public transport (36.4%) exceeded the national average by 15 percentage points (21.1%) [ Cities (Urban Audit), 2017].
At the same time, in smaller towns, the suburban areas of large cities and the settlements of the agglomeration, the use of passenger cars is still the primary mode of transport for commuting to work, because the level of coverage offered by community transport systems is usually lower. The dependence of people living in these areas on passenger cars is higher. For example, in 2011, the ratio of people using passenger cars to get to work was 18 percentage points higher among the population of greater Manchester (70.5%), than among people living in the centre of the city (52.4%); and this sample is repeated in the cases of the other towns presented on Figure 2 [Cities (Urban Audit), 2017].
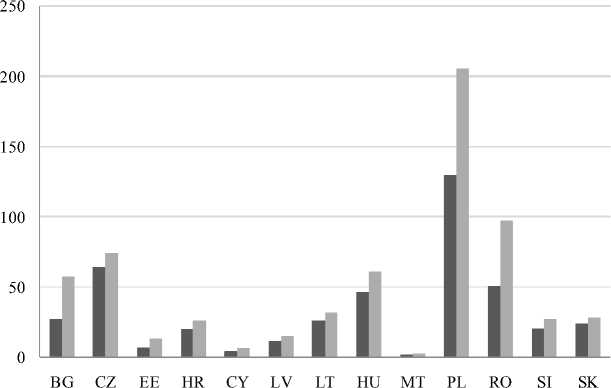
■ 2000 year
2017 year
Fig. 1. Changes in the use of passenger cars (EU-13, billion passenger km)
Note. Source: own editing based on [EU Transport in Figures ... , 2019].
: №РгЭ
Dublin Milano Lissabon Helsinki Manches ter
-
■ Greater icai %) 55^6 59,1 55,3 48,7 70,5
-
■ City (car %) 41,3 38,8 46,5 37,9 52.4
Fig. 2. Ratio of people driving to work (2011)
Note. Source: own editing based on [Cities (Urban Audit), 2017].
In Europe, already close to three quarters of the population live in urban areas (in cities and their surroundings), and this trend will further increase according to forecasts, at the expense of rural areas. In Hungary, the ratio of people living in urban areas keeps growing intensively, it is presently around 70% within the whole population [United Nations, 2018]. As far as cities are concerned, the provision of sustainability, the improvement of environment protection and the improvement of liveability by solving the transport problems of crowded areas are increasingly strong social requirements. In 2017, in the member states of the European Union, 24.6% of the emission of greenhouse gases originated from transport [The First and Last ... , 2019]. Based on Figure 3 it can be seen that passenger cars had the biggest contribution (60%) to harmful emissions, therefore the reduction of the use of own passenger cars is of special importance for sustainability and liveability.
One of the means of confining the use of passenger cars is to divert mobility requirements to public transport, but in order to make it a really competitive alternative, profound and forward-looking urban policy decisions are required. As of 2013, the European Commission has been encouraging the member states to work out and implement sustainable urban mobility plans (SUMP). The primary objective of SUMP’s is to improve the access to urban areas, and to provide high-standard and sustainable mobility. With the preliminarily identified transport policy measures, the objective is to reduce harmful emissions [Together Towards Competitive ... , 2013; Káposzta, Illés, Nagy, 2017; Nagy, Káposzta, Varga-Nagy, 2018].
The COVID situation has worsened the chances of public transport, as personal safety and distance have encouraged people to prefer individual means of transport. Thanks to the COVID situation, only 1.4 billion journeys were made in Hungary by
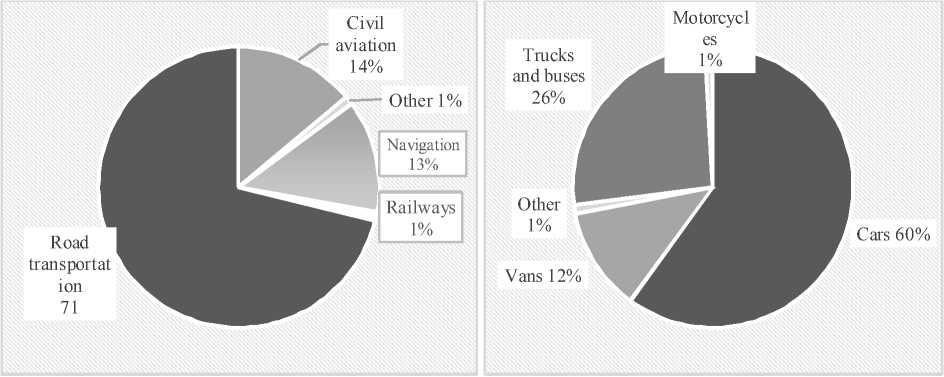
Fig. 3. Road transport emission as a share of EU transport GHG emissions (2017)
Note. Source: own editing based on [The First and Last ... , 2019].
local public passenger transport in 2020, which is two thirds of the total data registered in 2019 [Helyzetkép a szállítási ágazatról, 2020].
The low utilization of public transport is a critical problem in many countries. This phenomenon has many disadvantages, such as the persistence of congestion, the increase in the number of road accidents, parking problems and CO2 emissions. It has therefore become an important goal for local and central government to motivate people to choose public transport instead of passenger cars. As fares cannot be reduced due to high costs and losses (especially in the long-standing COVID situation), the only realistic way to increase the utilization is to raise the quality of public transport [Duleba, 2010]. The improvement of the opinion of people using the public service is important for decision-makers, as people using their cars could be convinced to use the public transport only if its quality is satisfactory.
The Kantar TNS market research company annually evaluates the public service providers in Germany. The survey of 2020 was conducted by examining 27 local transport service providers (companies or associations) and by asking 16,000 customers (on the phone and online). They used as much as 40 different performance indicators to determine the level of passenger satisfaction. Apart from the fact that the basic purpose of the survey is to determine the satisfaction of customers, further objectives include the definition of strengths and weaknesses to set the directions of development, as well as the comparison of the performance of various service provides. In the study of the market research firm, it was important to interview the same target group as in previous years so that the results were comparable. The results of the study confirmed that the use of public transport decreased significantly in 2020: 7–37 percent of former users (passengers) turned away completely from public transport at the time of the pandemic. Interestingly, the satisfaction of local public transport users has improved in the studied German areas [ÖPNV-Kundenbarometer, 2020].
For the Customer (and Service Provider) it is important to know what kind of performance would improve satisfaction, and what would be the most efficient way of increasing passenger numbers. The definition of intervention priorities (classification of strengths and weaknesses from the aspect of customer satisfaction) is an important issue because of the limited resources, therefore it is necessary to identify the factors that have more intensive effects on satisfaction, as well as the factors that have less importance. One of the methods is the ranking of various performance indicators with weight ratios for defining the general satisfaction indicator. In the following, the application of a multi-criteria decisionmaking method is presented using an example.
Method
For weighting among quality aspects, the author uses Guilford’s procedure as a basis. The basis of that is comparison in pairs, which places the weight ratios of the considerations on a scale of a certain interval [Gyarmati, 2003].
Evaluation considerations, basic quality features (short list on the basis of “ÖPNV-Kundenbarometer 2020”):
-
I. Supply features:
-
– C1: Expansion of line network;
-
– C2: Frequency of services;
-
– C3: Accuracy and reliability;
-
– C4: Access time.
-
II. Vehicle features:
-
– C5: Number of seats (congestion);
-
– C6: Internal cleanness, status;
-
– C7: Internal information.
-
I II. Tariffs:
-
– C8: Choice of tickets and passes;
-
– C9: Value for money.
-
I V. Stations and stops:
-
– C10: Cleanness and status;
-
– C11: Timetable information.
-
V . Security:
-
– C12: Security at the vehicles.
-
– C13: Security at stations and stops.
The initial statement is that each individual quality feature has different importance from the aspect of the evaluation system, therefore they can be taken into consideration by using weight numbers [Pupos, Pintér, 2013]. For the demonstration of the method, some experts working in community transport areas were involved. On the basis of paired comparisons, each expert defined which evaluation consideration he/she found more important, and recorded the results in preference tables. In the paired comparisons, they always used the number 1 to mark the factor they considered more important than the other (the feature at the beginning of the line is compared to the feature on the top of the column).
The consistency of matrixes filled in by the experts was examined with the consistency indicator (K). The given expert opinion was taken into consideration if K > 75% (strong consistency criterion). The formula (1) of “K” can be defined as follows:
к = 1 , (1)
“max where K = consistency indicator; d = number of inconsistent triangles; dmax= maximum number of possible triangles.
As the number of evaluation considerations is odd, the number of maximum triangles is (formula 2):
where n = number of evaluation considerations.
There are 13 evaluation considerations, i.e. dmax = 91. The number of inconsistent triangles can be determined on the basis of the following formula (3), the value of d cannot be negative:
n (n—l)(2n—1) Sa2
where n = number of evaluation considerations, a = it shows how many features were selected as more important than the given evaluation consideration (the total of the numbers in the lines of the matrix).
As an example, the author presents the preference table (Table 1) and consistency examination of one of the experts.
, 3900
d =
618 16
= 16 → K = 1 –
-
= 0.82 → therefore K 1 > 75%, so it is acceptable.
As on the basis of the consistency evaluation, one of the experts did not meet the predefined consistency level, only 5 experts’ opinions were taken into consideration in the remaining part of the evaluation.
By summarising the tables filled in by the individual experts, an aggregated preference table can be created (Table 2).
Calculation of the preference ratio (p) of evaluation considerations with the formula 4:
where “a” = the sum of the numbers in the lines ; k = number of experts ; n = number of considerations.
For example, in the case of C1 (with the same
37,5 method for other indicators): p1 = =0.577 .
The preference ratios may be used to derive the variable values of normal distribution (“u”) assigned to them. For this, the table containing the values of the distribution function is required. As the lowest value in that is 0.5, in the case of C4, C5, C6, C7, C8, C10 and C11 features, the Φ(-z) = 1 – Φ(z) statistical relation should be used.
An example for the calculation for C1: p1 = 0.577 → u1 = 0.19 (based on the table), and for C5: p5 = 0.408 (therefore smaller than 0.5) → 1 – 0.408 = 0.592 → u5 = -0.23.
The “u” data will be transformed to a scale of 0–100, and then will get the percentage values of “z” (formula 5).
Z, = 100 Ui""min (O/O) (5)
umax umin .
For example, for C1: z1 = 100 019 ( L05)= 47% , 1
(and similarly for the rest of the indicators).
Table 1
Preference table of an expert
|
C1 |
C2 |
C3 |
C4 |
C5 |
C6 |
C7 |
C8 |
C9 |
C10 |
C11 |
C12 |
C13 |
|
|
C1 |
X |
1 |
1 |
1 |
1 |
1 |
1 |
||||||
|
C2 |
1 |
X |
1 |
1 |
1 |
1 |
1 |
1 |
1 |
||||
|
C3 |
1 |
1 |
X |
1 |
1 |
1 |
1 |
1 |
1 |
1 |
|||
|
C4 |
1 |
1 |
1 |
X |
1 |
1 |
1 |
1 |
1 |
||||
|
C5 |
1 |
X |
1 |
1 |
1 |
1 |
1 |
1 |
|||||
|
C6 |
1 |
X |
1 |
1 |
1 |
1 |
|||||||
|
C7 |
X |
1 |
|||||||||||
|
C8 |
1 |
X |
|||||||||||
|
C9 |
1 |
1 |
1 |
1 |
1 |
1 |
1 |
X |
1 |
1 |
|||
|
C10 |
1 |
1 |
X |
||||||||||
|
C11 |
1 |
1 |
X |
||||||||||
|
C12 |
1 |
1 |
1 |
1 |
1 |
1 |
1 |
1 |
1 |
1 |
1 |
X |
1 |
|
C13 |
1 |
1 |
1 |
1 |
1 |
1 |
1 |
1 |
X |
Note. Source: own editing on the basis of data provided by unnamed expert.
Summarised preference table
|
C1 |
C2 |
C3 |
C4 |
C5 |
C6 |
C7 |
C8 |
C9 |
C10 |
C11 |
C12 |
C13 |
a i |
p i |
|
|
C1 |
X |
2 |
2 |
3 |
5 |
5 |
5 |
2 |
5 |
5 |
1 |
35 |
0.577 |
||
|
C2 |
3 |
X |
1 |
2 |
5 |
4 |
5 |
4 |
2 |
4 |
4 |
1 |
35 |
0.577 |
|
|
C3 |
5 |
4 |
X |
3 |
5 |
5 |
5 |
5 |
3 |
5 |
5 |
1 |
2 |
48 |
0.777 |
|
C4 |
3 |
3 |
2 |
X |
4 |
2 |
4 |
3 |
2 |
3 |
3 |
29 |
0.485 |
||
|
C5 |
2 |
1 |
X |
3 |
5 |
4 |
2 |
3 |
4 |
24 |
0.408 |
||||
|
C6 |
1 |
3 |
2 |
X |
5 |
3 |
1 |
5 |
4 |
24 |
0.408 |
||||
|
C7 |
1 |
X |
2 |
1 |
3 |
7 |
0.146 |
||||||||
|
C8 |
1 |
2 |
1 |
2 |
3 |
X |
2 |
1 |
12 |
0.223 |
|||||
|
C9 |
3 |
3 |
2 |
3 |
3 |
4 |
5 |
5 |
X |
5 |
5 |
38 |
0.623 |
||
|
C10 |
1 |
2 |
2 |
4 |
3 |
X |
1 |
13 |
0.238 |
||||||
|
C11 |
1 |
2 |
1 |
1 |
2 |
4 |
4 |
X |
15 |
0.269 |
|||||
|
C12 |
5 |
5 |
4 |
5 |
5 |
5 |
5 |
5 |
5 |
5 |
5 |
X |
5 |
59 |
0.946 |
|
C13 |
4 |
4 |
3 |
5 |
5 |
5 |
5 |
5 |
5 |
5 |
5 |
X |
51 |
0.823 |
Note. Source: own calculating and editing.
Table 2
The last step is the definition of the weight numbers (T) belonging to the evaluation considerations, which can be done by transforming the “z” values. Considering the relatively large number of features (13 pcs), the author uses a scale of 1–10 (as each consideration has some importance, so value 1 is the lowest priority level, i.e. the weight number).
Results
The formulation of weight numbers belonging to quality features is summarised by Table 3.
Based on the opinion of the experts considered, C12 (security on vehicles) is the most important consideration, while C7 (internal information on board) is the most marginal consideration in the evaluation of the quality of the service. The priority order of characteristics is included in Table 4.
The values of weights indicate that in the experts’ opinion, among quality considerations, the security features are in the focus, followed by supply features in the priority order (accuracy and reliability, extension of network, frequency of services, access time). The condition of vehicles and stops and the tariff system are less important considerations from
Table 3
Steps of defining weight numbers
|
a i |
p a |
u |
z (%) |
T |
|
|
C1 |
35 |
0.577 |
0.19 |
47 |
5 |
|
C2 |
35 |
0.577 |
0.19 |
47 |
5 |
|
C3 |
48 |
0.777 |
0.76 |
68 |
7 |
|
C4 |
29 |
0.485 |
-0.04 |
38 |
4 |
|
C5 |
24 |
0.408 |
-0.23 |
31 |
4 |
|
C6 |
24 |
0.408 |
-0.23 |
31 |
4 |
|
C7 |
7 |
0.146 |
-1.05 |
0 |
1 |
|
C8 |
12 |
0.223 |
-0.76 |
11 |
2 |
|
C9 |
38 |
0.623 |
0.31 |
51 |
6 |
|
C10 |
13 |
0.238 |
-0.71 |
13 |
2 |
|
C11 |
15 |
0.269 |
-0.62 |
16 |
3 |
|
C12 |
59 |
0.946 |
1.61 |
100 |
10 |
|
C13 |
51 |
0.823 |
0.93 |
74 |
8 |
Note. Source: own calculating and editing.
Priority order of characteristics
|
Quality feature |
T |
|
|
C12 |
Security on vehicles |
10 |
|
C13 |
Security at stations and stops |
8 |
|
C3 |
Accuracy and reliability |
7 |
|
C9 |
Value for money |
6 |
|
C1 |
Expansion of line network |
5 |
|
C2 |
Frequency of services |
5 |
|
C4 |
Access time |
4 |
|
C5 |
Number of seats (congestion) |
4 |
|
C6 |
Clean interior and status of vehicles |
4 |
|
C11 |
Timetable information at stops |
3 |
|
C10 |
Cleanness and status of stops |
2 |
|
C8 |
Choice of tickets and passes |
2 |
|
C7 |
Internal information on board of vehicles |
1 |
Table 4
Note. Source: own editing.
the aspect of the quality of the service. However, the sensitivity of the tariff issue is indicated by the relatively high weight of the value for money factor.
Conclusion
Because of the fast development of motorisation and the strong increase in the population of cities, the considerations of liveability and sustainability are more and more in the forefront of urban policy decisions that determine the directions of development. In the development of regional transport systems, one of the key endeavours is to make the role of community transport more important in order to reduce the use of automobiles.
In order to define the directions of development in more details, it is necessary to clarify the considerations that represent the most important factors for people using public transport. In addition, the development of weighted ratios of quality characteristics can help to develop a system of indicators for the evaluation of public services.
References The importance of the quality of urban public transport and a methodological example for weighting the typical quality criteria
- Cities (Urban Audit), City Statistics, 2017. Eurostat Database. URL: https://ec.europa.eu/eurostatdatabrowser/view/urb_ctran/default/table?lang=en (accessed 8 December 2021).
- Duleba S., 2010. A Hierarchical Model to Evaluate Public Transport’s Supply Quality. Acta Technica Jaurinensis, no. 3 (3), pp. 377-382. URL: https://acta.sze.hu/index.php/acta/article/view/86
- EU Transport in Figures, Statistical Pocketbook 2019. Luxembourg, Publications Office of the European Union, 2019. European Commission. URL: https://op.europa.eu/en/publication-detail/-/publication/f0f3e1b7-ee2b-11e9-a32c-01aa75ed71a1 (accessed 8 December 2021).
- Gyarmati J., 2003. Többszempontos döntéselmélet alkalmazása a haditechnikai eszközök összehasonlításában, PhD értekezés. Zrínyi Miklós Nemzetvédelmi Egyetem, pp. 20-22. URL: http://m.ludita.uni-nke.hu/repozitorium/handle/11410/9677
- Helyzetkép a szállítási ágazatról, 2020. KSH kiadványtára 2019. URL: https://www.ksh.hu/docs/hun/xftp/idoszaki/jelszall/2020/index.html (accessed 30 November 2021).
- Káposzta J., Illés B., Nagy H., 2017. Examination of Impact of Economic Policy on Quality of Life in Regions of Some European Countries with Global Perspective. Engineering for Rural Development, vol. 16, pp. 236-241. DOI: 10.22616/ERDev2017.16.N045
- Nagy H., Káposzta J., Varga-Nagy A., 2018. Is ICT Smartness Possible Development Way for Hungarian Rural Areas? Engineering for Rural Development, vol. 17, pp. 463-468. DOI: 10.22616/ERDev2018.17.N041
- ÖPNV-Kundenbarometer, 2020. KANTAR TNS. URL: https://www.kantar.com/de/inspiration/tourismusreisen/oepnv-kundenbarometer-2020 (accessed 4 December 2021).
- Pupos T., Pintér G., 2013. Döntéstámogató módszerek, Gyakorlati jegyzet. Debreceni Egyetem Gazdálkodástudományok Centruma, pp. 23-30. URL: https://dtk.tankonyvtar.hu/xmlui/handle/123456789/3675
- The First and Last Mile – The Key to Sustainable Urban Transport, Transport and Environment Report, No. 18/2019. European Environment Agency, 2019. URL: https://www.eea.europa.eu/publications/thefirst-and-last-mile (accessed 18 February 2020).
- The World’s Cities in 2018, Data Booklet, 2018. United Nations. URL: https://www.un.org/development/desa/pd/sites/www.un.org.development.desa.pd/files/files/documents/2020/Jan/un_2018_worldcities_databooklet.pdf (accessed 5 December 2021).
- Together Towards Competitive and Resource-Efficient Urban Mobility, Brussels, 17.12.2013, COM (2013) 913 Final, 2013. European Commission. URL: https://eur-lex.europa.eu/legal-content/EN/TXT/?uri=celex%3A52013DC0913 (accessed 23 February 2020).
