The influence of combined effects of hyperbaria and hyperoxia on human heart rate variability during exercise strain

Author: Bersenev Е.Yu., Dyachenko A.I., Suvorov A.V., Demina P.N., Berseneva I.A., Dyachkova T.V.
Journal: Cardiometry @cardiometry
Section: Original research
Article in issue: 29, 2023.
Free access
With the participation of 8 male volunteers, the dynamics of values of heart rate autonomic regulation were studied at response to physical load on a bicycle ergometer twice: both respirating by the room air under normobaric environment and simulating effects of the altered hyperoxic respiratory gas mixture (HRGM) by the rebreathe respiration methods from a rebreather at the high-pressure chamber (at «depth» 7 m). The devices and methods of Holter electrocardiogram monitoring were used under 24 hours research. The specialized software to analyze the data was used. The electrocardiogram (ECG) and calculated time series of cardiac intervals data obtained were subjected to mathematical processing to calculate statistical and spectral values of heart rate variability (HRV). Additionally, the geometric and nonlinear analysis methods of HRV were investigated. It has been established that influencing factors (compound and pressure of the HRGM) affect the autonomic regulation of heartbeats both at rest and during physical load. Clinical practitioners the HRV values are studied at rest and during strictly regulated tests, i.e. in stationary conditions.non-stationary processes, for example, when it is necessary to continuously analyze data, the so-called transient processes under increasing psychological stress, to assess changes in the autonomic regulation of the heart during breathing of gas mixtures with different compositions (hypoxic therapy, hyperbaric oxygenation, etc.), and, especially during physically upload are used the methods of nonlinear and geometric analysis of HRV that are independent of the degree of nonstationary processes and, to some extent, of artifactual cardiac intervals. During the breathing the respiratory gas mixtures with an increased substance of O2 under conditions of high pressure, the activity of the parasympathetic branches of the autonomic nervous system (ANS) significantly increases. The nonlinear dynamics indexes reflect significant differences in the activity of autonomic components under experimental conditions in the direction of strengthening the parasympathetic links of the ANS. The use of nonlinear analysis values is more acceptable when evaluating obtained of non-stationary processes. In general, the study confirms that the regulatory response to the effects of hyperbaria and hyperoxia when performing a bicycle ergometer test with stepwise increase exercise strain is manifested by the prevalence of the activity of the parasympathetic part of the ANS autonomic regulation of cardiac rhythm compared to regular room air and barometric pressure.
Autonomic regulation, holter ecg monitoring, modeling, hyperoxic respiratory gas mixtures
Short address: https://sciup.org/148327848
IDR: 148327848 | DOI: 10.18137/cardiometry.2023.29.8089
Text of the scientific article The influence of combined effects of hyperbaria and hyperoxia on human heart rate variability during exercise strain
Еvgeny Yu. Bersenev, Alexander I. D’yachenko, Alexander V. Suvorov, Polina N. Demina, Irina A. Berseneva, Tat’yana V. D’yach-kova. The influence of combined effects of hyperbaria and hy-peroxia on human heart rate variability during exercise strain. Cardiometry; Issue No. 29; November 2023; p. 80-89; DOI: 10.18137/cardiometry.2023.29.8089; Available from: http://www. hyperbaria
Previously, experimental studies have shown that increased partial pressure of oxygen during hyperbaric oxygen therapy increases the parasympathetic regulatory activity of the heart [1,2]. According to the recommendation of the international task force [3], the main reference method for assessing the balance of activity of sympathetic and parasympathetic regulation is the spectral analysis of the power of heart rate variability (HRV), while the dominance of slow oscillations, low-frequency wave (LF) over high oscillations, high-frequency wave (HF) is taken as a shift in the tone of autonomic regulation towards sympathetic department and vice versa. On the other hand, the ratio of the power of low-frequency and «respiratory» HRV waves does not allow us to accurately conclude the sympathovagal balance [4]. It is true as well as the analysis of statistical values of heart rate variability, such as the standard deviation of normalized (NN) cardiac intervals SDNN [4], especially if the assessment concerns short records, non-stationary processes, the influence of locomotion or the combination of variate influences factors. One possibility to distinguish between vagal and sympathetic pathway influencing HRV would be the separate characterization of heart rate deceleration and acceleration [5]. Numerous factors influencing heart rate determine the nonlinear characteristics of changes in its indices. To analyze these changes, especially in non-stationary conditions, methods of nonlinear dynamics are used, in particular fractal analysis of time-series - DFA (Detrended Fluctuation Analysis) [6]. It has been shown that a significant part of the heart rhythm structure consists of non-periodic chaotic components of a fractal nature. In particular, changes in the severity of noise components of nonlinear HRV dynamics predetermine the risk of sudden cardiac death [7,8]. The DFA method makes it possible to study HRV, including under conditions of non-sta-tionary processes, from the point of view of statistical self-similarity or approximate self-similarity - an indicator of fluctuation [6].
Goals:
To evaluate the basic changes in values of autonomic regulation of heart rate of 8 subjects-volunteers males in response to exercise strain on a bicycle ergometer during two consecutive periods: 1. When breathing a standard room air (normoxia) with normobaric conditions and 2. When simulating the impact of an altered gas environment using breathe-rebreathe ma- neuver technique within HRGM at elevated pressure in the rebreather apparatus. Elucidate the effects of the combined action of influencing factors on the autonomic regulation of blood circulation.
Volunteers and methods
The experiment involved 8 male volunteers aged (23-39 years). Body length and weight are 182.4 (174189) cm and 82.9 (72-96) kg, respectively. The study protocol was approved by the bioethical commission of the State Scientific Center of the Russian Federation - Institute for Biomedical Problems of the Russian Academy of Sciences. All subjects signed informed consent to participate in the experiment.
The physical strain test was provided with the volunteers twice: in ordinary room air breathing conditions and after exposure at the high-pressure chamber under strictly accordance with the requirements of the Interindustry Rules for Occupational Safety and Health during Diving Work, POT R M-030-2007 (Order of the Ministry of Health and Social Development of the Russian Federation dated April 13, 2007 N 269 «On approval of inter-industry rules for labor protection during diving work»).
The load was carried out using an Ergoselect 200P bicycle ergometer (Ergoline GmbH, Germany) under the control of a Jaeger Oxycon Pro metabolograph (Viasis, Germany). The main parameters of the cardiorespiratory system were recorded (including oxygen consumption, carbon dioxide emissions, ventilation, respiratory rate, heart rate, ECG) at rest and during subsequent program-controlled physical activity (increasing power by 15 W per minute at each step) on a bicycle ergometer to the level 75-85% of individual estimated maximum performance level.
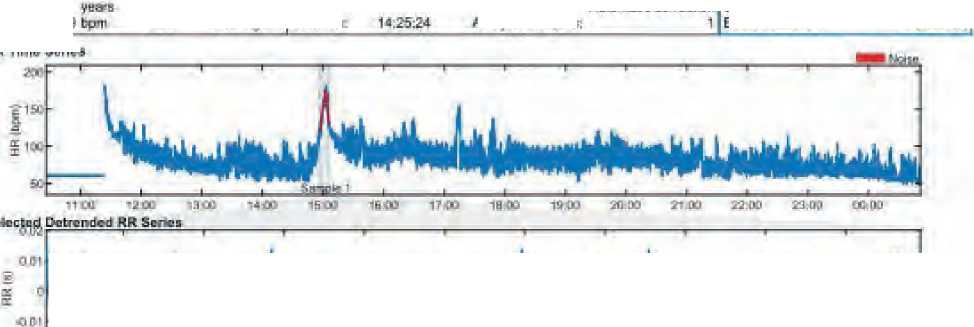
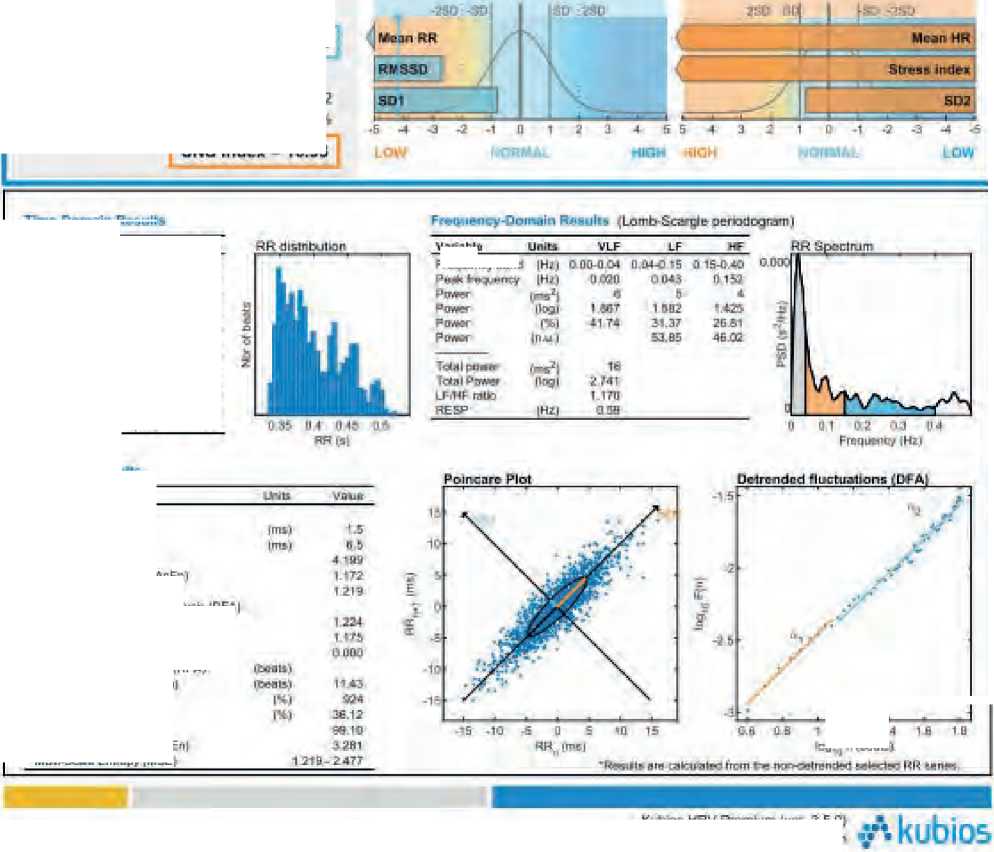
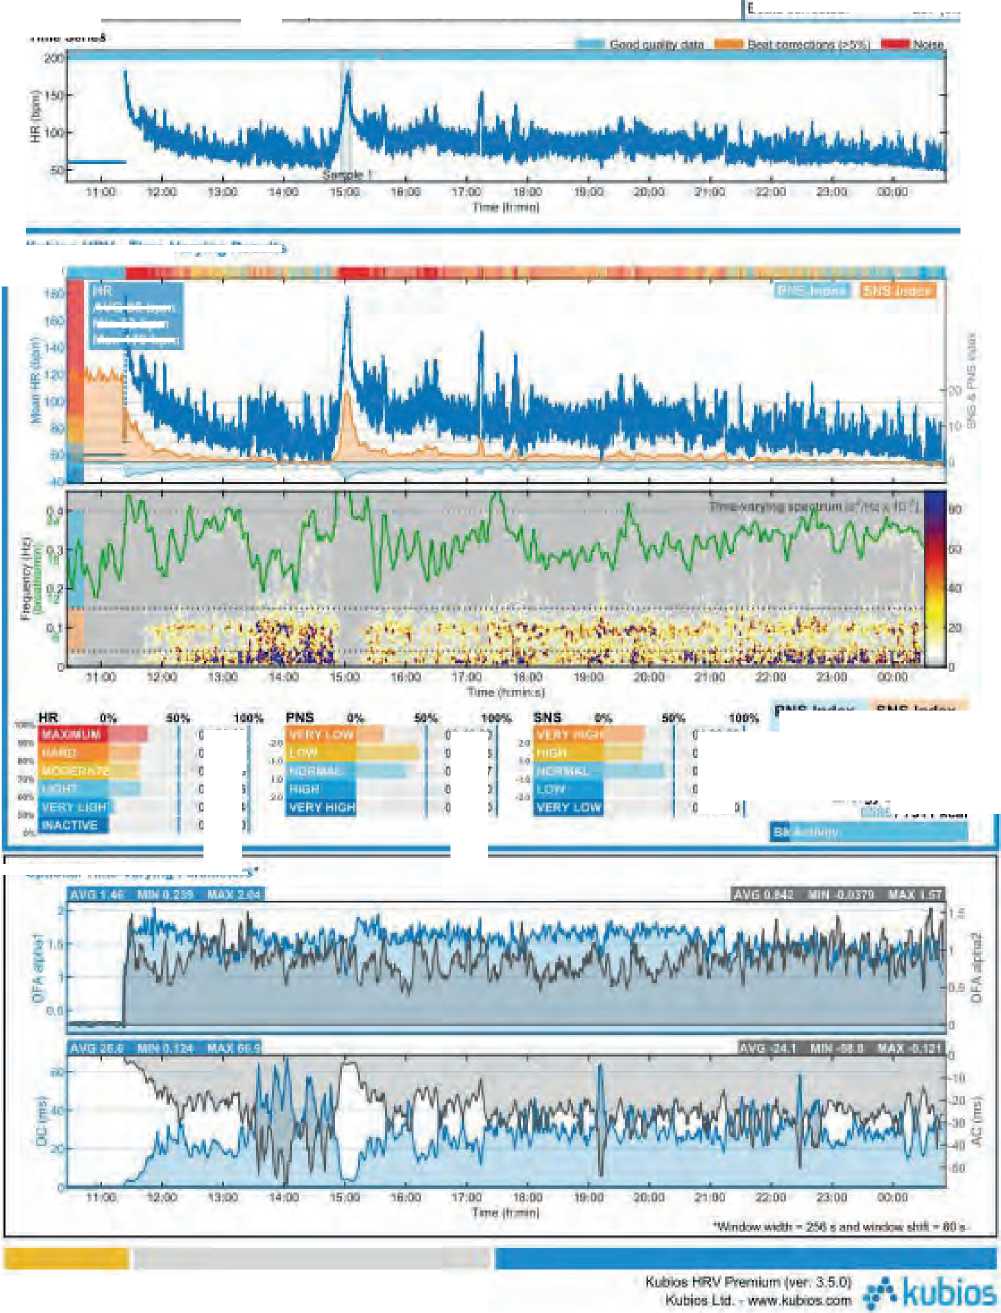
The electrocardiogram (ECG) was recorded in three leads using a HolterLive® monitor manufactured by Sovtest ATE LLC, Kursk, which allows obtaining high-quality recordings. The device has a built-in 3-axis accelerometer for analyzing the motor activity of the subject. Dimensions: approx. 55 x 50 x 11 mm (with battery module). Weight: approx. 38 g (with battery module). For 24-hour monitoring, special disposable electrodes were used, which were applied to the apex of the heart. To analyze variability indicators in short fragments of ECG recordings, under conditions of physical activity, Kubios HRV Premium software (ver. 3.5.0) (Kubios Oy., Finland) was used [9-11] (Fig. 1-3).
Ре*ыи)
Gender
Age:
MaxhR:
Mere
Height Weylv. BAIL
172 cm
73 kg
24.7 кцкп2
MeM4i*enwiM Into
Dale Start I me
Dura bur
25 11.19
10.26.00
Trend removal SmuoUn priors Artefact con Autunuwc axreciku: Analysis Samy lea.
Reruns for Sammie 1H
Sample start 14 56 42
Sample length 00:09:05
Beets cLTWdkrtl 5 I0.37 %|
;/^
1563:20
1504 10
1505 DO
HR Time Series

SO
Autonomic nervous system indexes
Parasympathetic Nervous System (PNS)
Meen RR
400 ms
RMSSD
2^ п»
SD1
19.2 .
Parasympathetic tone |re*cwofy| PNS Index = *4.18
Sympathetic tone (stress) SNS Index = 16.93
PNS Index =-4.18
Sympathetic Nervous System (SNS)
SNS Index ■ 16.93
Va^tna
Recurrence rate (REC) Dtwn-гп |DET|
PtiflLMIM Htd SOI
уапаЫб Frw^iifti- be rid
Kubos HRV Pnmikjm tvet. 3 5.0|
Figure 1 – Example of HRV data processing (Standard Result) include nonlinear analysis of near-circadian records using Kubios HRV Premium software (ver. 3.5.0)
Мелп HR Stress index
150 tipm 64.2
SD2
80.8 .
Twe-Qo*iuiiii wsulli
|
Van able |
Until |
Vaiuu |
|
Мий RR^ |
In») |
4C<1 |
|
Mew HR* |
l.tpml |
130 |
|
Mi HR |
(Efwn| |
116 |
|
Man HR |
I.epml |
in |
|
SDNN |
|n»> |
4.7 |
|
RMSSO |
|nw) |
2 2 |
|
NN50 |
C |
|
|
pNNW |
W |
ow |
|
RR tuaiflueir гезе» |
207 |
|
|
Т1ЧН |
Imu |
mo |
|
suftsi .raox isn |
64.2 |
|
|
lie |
In») |
3 6 |
|
CCit>jc |
|п») |
25 |
HtiiHIntiAt RftAiiPA
S£»i'SD1
A^oxmar» Е<"йгору (ApEr i Simple Entropy (Sanptni rjHl'HndMtl FLiA-IhUhi Алнумм |DFA|
Short tiarm hjdtuetons, u 1 ЕзгрДдгтл luUuaiom. и2
СлнтЫКг ОкчкПмп |D?) Rbcurwiot Pot Алау1Н |RPA)
Mean Ine length -L^anl
MjIkScio Enimo, IMSE:
12 1 x
‘ou... n iteaf! i
|
Pv*w»t |
V-fo^uririT^rt hflo |
||||||
|
Gerxler |
Ma# |
Heiglm |
172 cm |
Date |
2511.19 |
Trend removal: |
SmooUm priors |
|
Age. |
" уе»в |
Weipht |
73 kg |
Sian Inie |
10:26:00 |
Artetaol сап. |
Aolcrnatic eorreclkm |
|
Maxl-R |
99 bpm |
BAU |
24.7 k»'m2 |
Dura linn. |
14:25.24 |
Anafyuis samules: |
1 |
PwuHb for I hr whose meowremenl
HR Time Series
Semple etan Sample length Beals corroded
102a 08 14.21.00 237 (0.34 %)
Kubios HRV - Time-Varying Results
AdMIy
AVG M bun.
wit bztipm
Figure 2 – Example of HRV data processing (Time-Varying Result) include nonlinear analysis of near-circadian records using Kubios HRV Premium software (ver. 3.5.0)
04:0303 00:16:06 м«гв 0321 66 00.3214
CO 00.03
ozeea 062*:« OS 1237 Mi 00 00 to 00 00
ee«30 оз wb 06 14*6 00JOI 00 oo oo oo
PNS Index AVG -1.40 Min -4.43 Max 0.94
SN5 Index AVG 3.06 Min-1.02 Max 26.54
Energy Expenditure /7311 kcal
Oulleieel Tlme-Varyimi PetemeSer»
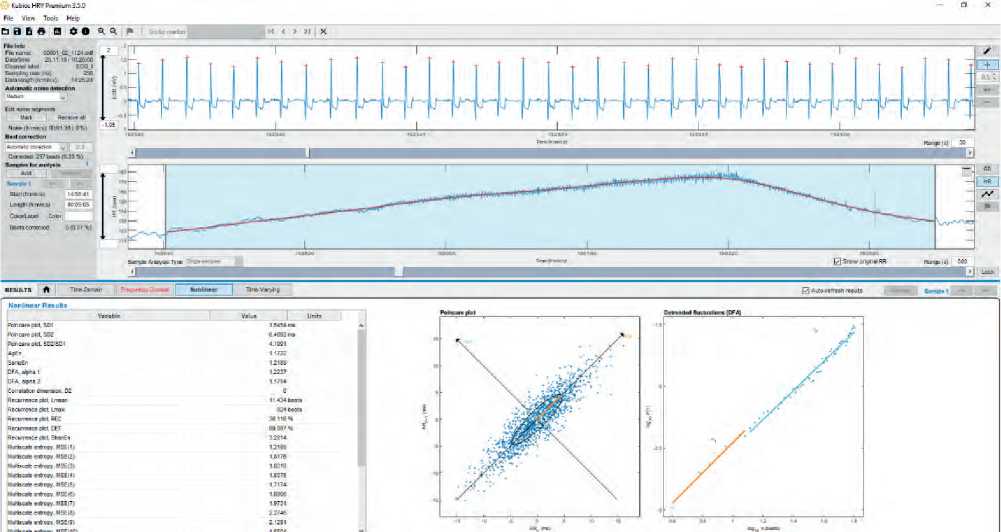
Figure 3 – An example of ECG data and RR-cardiointervals dynamics during a stress test under conditions of HpOxHpb
Data processing
Analysis of ECG data with calculation of successive cardiac intervals (R-R intervals) was carried out using specialized software Kubios HRV Premium (ver. 3.5.0). Statistical (time) and spectral (frequency) measures of HRV were calculated in accordance with published standards [3,12]. Spectral analysis was carried out using fast Fourier transform (FFT), Welch’s periodogram window type, without smoothing. The method of «slid-ing window» (time-varying analysis) of 300 seconds was used with a shift window of 60 seconds.
To analyze the data under the conditions of the imposed physical loads, fragments of the ECG recording with a length of at least 2 minutes were selected, multiples of the load time at each stage of the step-increasing test. Before the load and during recovery, time periods were selected that were compared with the recording sections analyzed under test conditions. During recovery, 2-minute periods were assessed at the end of the 2nd, 4th and 6th minutes.
For subsequent analysis of HRV, the most common indicators of time, frequency, geometric and nonlinear analysis of HRV were selected [3, 9-12]:
HR – average value of heart rate;
EDR [Hz] – (EDR – ECG Deviated Respiration) is an indicator that indirectly reflects the respiratory rate in Hz. It is calculated from the QRS amplitudeogram of successive QRS complexes, which form a wave-like curve, due to which the dominant respiratory rate in a 84 | Cardiometry | Issue 29. November 2023
given person and the limits of its changes are revealed [13,14];
rMSSD (ms) - square root of the average sum of squares of the differences between adjacent NN intervals. Used to assess high-frequency components of variability, characterizes the activity of the parasympathetic regulation link;
SI (c.u.) – stress index (tension index of regulatory systems) in arbitrary units, characterizes the total activity of the sympathetic regulation link [12], (√ -square root) of SI index was used for analysis;
TP (ms2) – «Total Power» is the total power of the heart rate spectrum, reflects the overall activity of regulatory systems in the area of harmonic frequencies;
HF (n.u.) – «High Frequency», the absolute or relative (in %) power of the spectrum of high-frequency fluctuations of the heart rate in the range of 0.4-0.15 Hz (respiratory waves) reflects the activity of the parasympathetic regulation link. For the analysis, we selected indicators calculated in normalized units (n.u.) (HF [n.u.] = HF [ms2]/(TP [ms2] - VLF [ms2])
LF (n.u.) – «Low Frequency» absolute or relative (in %) power of the spectrum of low-frequency fluctuations of the heart rate in the range of 0.15-0.04 Hz (vascular waves) reflects the activity of the sympathetic vasomotor center. Indicators calculated in normalized units (n.u.) (LF [n.u.] = LF [ms2]/(TR [ms2] - VLF [ms2]);
LF/HF (ratio) – the ratio between low-frequency and high-frequency oscillations taken as sym-patho-vagal balance;
DC (ms) – used in non-stationary conditions using the method of averaged signal rectification (Phase-Rectified Signal Averaging - PRSA). Measures the average intensity of deceleration capacity (DC) or acceleration capacity (AC) of the heart rate [5, 15];
SD2/SD1 – is an indicator of nonlinear analysis that determines the ratio of the «dimension» of the Poincaré plot (SD1 is the width of the «cloud» on the Poincaré plot, SD2 is the length of the «cloud» on the Poincaré plot), reflects the ratio of «slow» SD2 – sympathetic to «fast» SD1 – vagal to influence on heart rhythm [16];
DFAα2 – is an indicator of long-term fluctuation in the interval of 13-64 beats (RR-intervals) using the method of assessing fractal self-similar HRV structures, according to which a small part of the fractal structure is similar to the entire structure.
Statistical processing was carried out using Excel 2016 MS Office, GraphPad Prism 10 for Windows 64-bit, Statistica 8.0. To assess significant differences in groups used Wilcoxon Matched Pairs Test and Repeated Measures ANOVA (Šídák’s multiple comparisons test), marked tests were significant at p <0.05.
Result
The group of volunteers studied was heterogeneous in terms of exercise tolerance. At trained individuals, there is a clear decrease in HR and SI and an increase in rMSSD. In volunteers who have difficulty withstanding physical activity, the decrease in HR is less pronounced, while the index of sympathetic activity SI in the first minutes of recovery may exceed the values recorded at the peak of physical activity. The parasympathetic reactivation after exercise is confirmed by HRV values both in the time and frequency domains, and by nonlinear ones. The rapid decrease in HR, which occurs immediately after the cessation of physical exercise in volunteers with high tolerance to physical activity, is associated with initially low HR values and high markers of the sympathovagal balance of the activity of the parasympathetic branches of the ANS [17], while at the same time a slower exponential decrease HR in untrained individuals is the result of a gradually increasing inhibitory effect and a weakening excitatory, sympathoadrenal effect.
In the second series of the experiment, when volunteers were under conditions of the combined influence of hyperbaric and hyperoxia factors, the initial background of autonomic regulation of heart rate was manifested by an increase in the activity of the parasympathetic links of the ANS. Compared to the conditions of the stress test when breathing room air, HR values were lower in conditions of hyperbaric and hy-peroxia both at rest before the load and did not exceed ones at all stages of the load (Table 1). More noticeable
Table 1
The data of time and frequency analysis of HRV
|
Values, units |
M± SE |
Normal air, Normobaric (NrAirNb ) |
Hyperoxia, Hyperbaric (HpOxHp b) |
||||||||||||||||||
|
Rest, min |
Physical strain, Watt (W), 2 min/step |
Recovery, min |
Rest, min |
Physical strain, Watt (W), 2 min/step |
Recovery, min |
||||||||||||||||
|
5’ |
30w |
60w |
90w |
120w |
150w |
180w |
1-2’ |
2-4’ |
4-6’ |
5’ |
30w |
60w |
90w |
120w |
150w |
180w |
1-2’ |
2-4’ |
4-6’ |
||
|
HR, bpm |
M |
77.1 |
91.1 |
97.0 |
111.1 |
124.9 |
140.1 |
154.5 |
142.0 |
113.7 |
106.8 |
67.3 |
86.8 |
95.3 |
105.2 |
113.0 |
130.1 |
143.1 |
124.6 |
100.1 |
93.5 |
|
SE |
5.5 |
6.6 |
6.2 |
8.2 |
9.3 |
9.3 |
9.4 |
11.0 |
10.3 |
8.9 |
4.4 |
4.0 |
4.8 |
6.0 |
7.1 |
8.2 |
8.7 |
9.3 |
9.1 |
8.8 |
|
|
SI, c.u. |
M |
11.3# |
17.3 |
21.9 |
34.1 |
55.5 |
74.9 |
82.7 |
67.0 |
42.7 |
38.0 |
7.2 |
12.5 |
20.9 |
25.6 |
34.6 |
53.1 |
58.2 |
40.2 |
23.5 |
20.1 |
|
SE |
1.4 |
1.8 |
2.4 |
7.6 |
13.0 |
12.7 |
12.4 |
14.6 |
10.0 |
11.2 |
0.6 |
1.0 |
2.5 |
3.0 |
6.3 |
6.5 |
6.2 |
10.0 |
8.0 |
6.2 |
|
|
rMSSD, msec |
M |
34.2# |
21.6 |
16.6 |
9.6 |
5.1# |
4.2 |
6.1 |
7.5 |
11.6 |
11.5 |
62.8 |
28.9 |
17.0 |
12.7 |
9.7 |
6.5 |
6.5 |
17.0 |
36.3 |
42.4 |
|
SE |
7.2 |
3.8 |
3.0 |
2.2 |
1.1 |
1.4 |
3.5 |
3.4 |
5.1 |
4.3 |
6.7 |
1.9 |
1.8 |
2.5 |
1.3 |
1.0 |
1.6 |
5.6 |
15.9 |
19.7 |
|
|
ТР, msec2 |
M |
2322.1 |
914.8 |
618.6 |
282.5 |
51.8 |
26.7 |
7.7 |
86.2 |
358.9 |
326.9 |
4504.7 |
1565.3 |
617.6 |
330.4 |
131.2 |
37.9 |
23.7 |
277.1 |
3043.3 |
4107.3 |
|
SE |
702.9 |
304.0 |
143.1 |
125.9 |
14.0 |
9.6 |
3.3 |
66.5 |
242.6 |
147.6 |
1005.5 |
295.1 |
183.7 |
109.9 |
30.7 |
13.8 |
11.0 |
149.5 |
2237.3 |
3287.9 |
|
|
HF n.u. |
M |
32.3 |
34.8 |
33.7 |
31.8 |
32.1 |
33.7 |
46.5 |
42.5 |
33.6 |
34.9 |
39.4 |
34.6 |
41.6 |
37.6 |
35.4 |
43.4 |
46.6 |
48.8 |
50.1 |
43.3 |
|
SE |
6.3 |
9.2 |
4.8 |
5.2 |
5.7 |
7.6 |
10.5 |
9.3 |
4.1 |
8.0 |
10.3 |
6.1 |
6.6 |
6.1 |
8.1 |
6.9 |
10.8 |
8.4 |
7.5 |
5.9 |
|
|
LF, n.u. |
M |
67.7 |
65.2 |
66.3 |
68.2 |
67.9 |
66.2 |
53.1 |
57.2 |
66.4 |
65.1 |
60.5 |
65.4 |
58.2 |
62.3 |
64.5 |
56.5 |
53.1 |
51.1 |
49.8 |
56.7 |
|
SE |
6.3 |
9.2 |
4.8 |
5.2 |
5.7 |
7.6 |
10.5 |
9.3 |
4.1 |
8.0 |
10.4 |
6.1 |
6.7 |
6.1 |
8.1 |
6.9 |
10.8 |
8.4 |
7.5 |
5.8 |
|
|
LF/HF, ratio |
M |
2.9 |
3.8 |
2.4 |
3.1 |
2.8 |
3.9 |
2.5 |
2.6 |
2.3 |
3.7 |
3.5 |
2.5 |
2.1 |
2.4 |
2.8 |
1.6 |
2.4 |
1.9 |
1.3 |
1.6 |
|
SE |
0.7 |
1.4 |
0.6 |
1.0 |
0.7 |
1.6 |
1.2 |
1.1 |
0.4 |
1.5 |
1.4 |
0.7 |
0.8 |
0.8 |
0.8 |
0.3 |
1.1 |
0.9 |
0.4 |
0.4 |
|
Notes: The significant differences between NAirNb vs HpOxHpb conditions using Wilcoxon Matched Pairs Test at p<0.05 are bold highlighted and # - Repeated Measures ANOVA (Šídák›s multiple comparisons test) at p <0.05.
Issue 29. November 2023 | Cardiometry | 85
differences appear in the SI indicators at the stages of increasing load and rMSSD at the recovery stage (Table 1). The spectral components, in particular the total power of the HRV spectrum (TR, msec2), show a trend towards an increase in ANS activity in extreme conditions of hyperoxia and hyperbaric (HpOxHpb), which, however, is unstable in the dynamics of the sympatho-vagal balance of the ratio in LF/HF values.
Under conditions of HpOxHpb, the indicator of nonlinear dynamics of DC is significantly higher (p<0.05) at initial rest and 120 W, 150 W and 180 W, also at every recovery stage of load (Fig. 4). The physiological meaning of the DC indicator is that with increasing load, the «ability» of the heart to slow down its own frequency is preserved, which is a favorable criterion for assessing tolerance to the test, as well as an indicator of maintaining vagal tone under extreme conditions. A trend can be seen at almost all stages, but especially when the load increases to the upper limits under HpOxHpb conditions, the DC values become significantly higher (p<0.05).
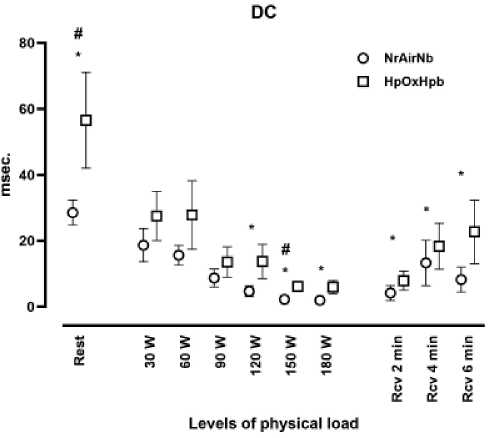
Figure 4 – The values of DC during physical load under NAirNb vs HpOxHpb conditions.
* - Wilcoxon Matched Pairs Test at p<0.05
# - Repeated Measures ANOVA (S^dak>s multiple comparisons test) at p <0.05.
Similar results forwarded in changes in the Poincaré cloud ratios (Fig. 5). An increase in the coefficient characterizes a greater sympathetic influence, while a decrease, on the contrary, indicates vagal activity. Under hyperbaric conditions using rebreathing methods with increased of O2 through a rebreathing apparatus when performing physical activity, the values increase. At the same time, it is necessary to note a difference in the initial values of the SD2/SD1 indicator before load under NAirNb vs HpOxHpb conditions, as well as its significant decrease under comparable load at the 120W level and during recovery (p<0.05).
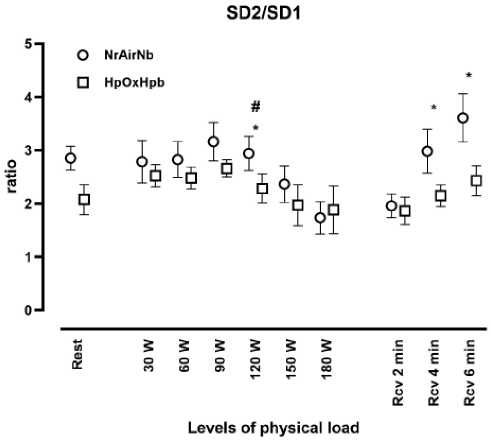
Figure 5 – The values of SD2/SD1 during physical load under NAirNb vs HpOxHpb conditions.
* - Wilcoxon Matched Pairs Test at p<0.05
# - Repeated Measures ANOVA (Šídák›s multiple comparisons test) at p <0.05.
The advantage of DFAα2 over standard methods [3,12] (for example, spectral analysis) is that this type of analysis makes it possible to detect the self-similarity properties inherent directly in time series, and also allows one to avoid artifactual trends. From a physiological point of view, an increase in this indicator characterizes a shift in the sym-pathovagal relationship in the body towards strengthening the sympathetic predominance (Fig. 6).
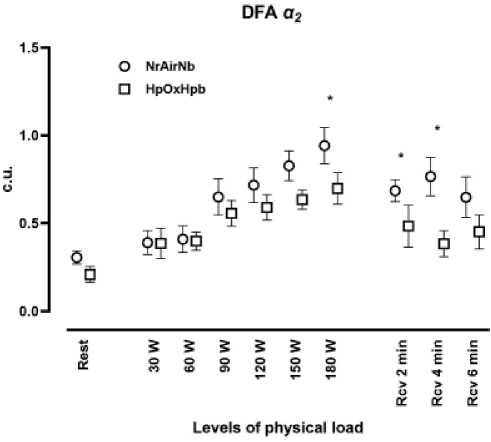
Figure 6 – The values of DFA α2 during physical load under NAirNb vs HpOxHpb conditions.
* - Wilcoxon Matched Pairs Test at p<0.05
We observe differences in this indicator under hyperbaric conditions and hyperoxia and the significant reduction in its growth in the peak of loads (at 180 W) and in the first stages of recovery (p<0.05), which probably characterizes a sufficiently high tone of the vagal components of the autonomic regulation of cardiac activity in response to the influence of a combination of factors.
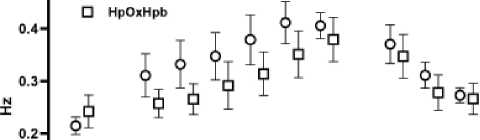
Interesting are the changes in the calculated EDR indicator, which is based on the phenomenon in which, during the inhalation-exhalation cycle, the amplitude of the R-wave of the QRS complexes of the ECG, which occurs with each contraction of the heart, smoothly increases and decreases (Samoilov-Ein-hoven phenomenon) (Fig. 7).
EDR
OS-. О NrAirNb
0.1

0.0-
X 3 3 5 3 83
5 Q Q Q О ОО rt 5 5 No)
Levels of physical load
Figure 7 – The values of EDR during physical load under NAirNb vs HpOxHpb condition
With initial differences before performing physical activity, in extreme conditions the dynamics of the increase in respiratory rate is lower than in conditions of breathing room air. Presumably, breathing using a rebreathing apparatus provokes a slowdown in the breathing rhythm, but this effect should be compared with methods for directly measuring the frequency and volume of breathing, which were studied in detail during the experiment. To calculate HRV indicators, especially when analyzing frequency components, this indicator is important for determining the boundaries of the spectrum. On the other hand, according to the authors Hermand, E. et al. [18], a change in breathing frequency entails a change in HRV indicators, which was observed in the experiment.
Discussion
Physical activity performed by subjects under conditions of extreme influences is accompanied by increased activity of the sympathetic division of the ANS. Finding volunteers under conditions of increased pressure against the background of breathing with an HRGM content is accompanied by a decrease in heart rate and a shift in the balance of autonomic regulation of heart rhythm towards activation of the parasympathetic division of the ANS, which can be traced by the dynamics of time and frequency indicators of HRV. Significant differences in the indicators of nonlinear analysis of HRV more clearly reflect a shift in the autonomic balance towards increased parasympathetic influences.
It is advisable to consider the indicators of spectral analysis under measurement conditions on recording segments with a total duration of less than 2 minutes within the frequency regions of the spectrum of high-frequency (HF) and low-frequency (LF) oscillations. Spectral components of the slower frequency range, for example VLF (0–0.04 Hz) can be considered if the basic conditions are met: a longer recording, constituting, if possible, 2 times the time interval of the region of interest, i.e. more than 5 minutes, and the second necessary condition for recommendations for HRV analysis is the presence of a stationary process. The study is carried out in lying, sitting, standing positions after the obligatory achievement of a stable status of autonomic regulation. The constancy of the external environment is also a necessary condition for research.
During data obtained to its analyzing of HRV we taking into account the requirement of recommendations [3-5, 12], however, existing methods of nonlinear analysis of HRV data under conditions of transient processes are comparable and sometimes more accurately reflect regulatory processes under conditions of continuously or stepwise increasing physical activity, at sharply changing external factors and psychological stress. Therefore, those should be used in the analysis non-stationary processes.
When performing physical activity under nor-mobaric and hyperbaric conditions, when breathing room air and HRGM, respectively, HRV indices calculated in the area of frequency components tend to increase, both in the range of total power frequency density and at the specific range of high-frequency and low-frequency values. The changes are unreliable and the balance of LF/HF ratio cannot be interpreted as a clear shift towards the predominance of the activity of the parasympathetic link of ANS regulation.
Withal the data of nonlinear and geometric analysis reflect a significant predominance of vagal influences during adaptation to hyperbaric conditions against the background of HRGM breathing, both in the initial state before the load and during the load test.
Thus, this experiment shows that indicators of temporal and frequency analysis of HRV data can be supplemented with nonlinear analysis techniques, the use of which and the reliability of differences under conditions of the combined influence of various time-varying environmental factors surpasses traditional generally accepted methods of sympathovagal balance estimation.
Conclusion
The analyzing of the results of the experiment, an adaptive reaction was revealed, there were manifested in an increase in parasympathetic tone against the background of physical activity performed in conditions of an altered gas environment with increased barometric pressure and excess O2 content in the inhaled air. This effect manifests itself in both trained and less tolerant persons. The HRV indices of exercise-resistant and untrained volunteers at equal levels of load are significantly lower under exercise strain conditions with the combined influence of hyperbaric condition and hyperoxia. The nonlinear dynamics values reflect significant differences in the activity of autonomic components under experimental conditions in the direction of strengthening the parasympathetic part of the ANS. Using the nonlinear analysis indices is more acceptable when evaluate the resulting studies in non-stationary processes.
Our study confirms that the regulatory response to the combined effects of hyperbaric and hyperoxia during physical activity during the bicycle ergometer stepwise increasing exercise test is the predominance of the activity of the parasympathetic division of the ANS compared with data obtained under normobaric and normoxia conditions.
Practical results include the analysis of individual values of nonlinear dynamics indicators under the influence of extreme factors, which are more sensitive indicators that allow optimizing the volume and schedule of physical activity, while a number of indices can be regarded as increasing the sensitivity of the heart rhythm to sympathetic influences.
Acknowledgments
We thank the management of Sovtest ATE LLC, Kursk for the opportunity to use HolterLive® equip- 88 | Cardiometry | Issue 29. November 2023
ment. Behind support and provided by specialized software Kubios HRV Premium (ver. 3.5.0) (Dr. M.P. Tarvainen). We are grateful to the subjects and mourn in memory of our colleague and co-author, Doctor of Medical Sciences, Aleksander V. Suvorov.
References The influence of combined effects of hyperbaria and hyperoxia on human heart rate variability during exercise strain
- Lund V, et al. Heart rate variability in healthy volunteers during normobaric and hyperbaric hyperoxia. Acta Physiol Scand 1999; 167: 29-35
- Lund V, et al. Hyperbaric oxygen increases parasympathetic activity in professional divers. Acta Physiol Scand 2000; 170: 39-44
- Task Force of the European Society of Cardiology and the North American Society of Pacing and Electrophysiology. Heart Rate Variability. Standards of Measurement, Physiological Interpretation and Clinical Use. Circulation. 1996;93:1043—65.
- Billman GE (2013) The LF/HF ratio does not accurately measure cardiac sympatho-vagal balance. Front. Physio. 4:26. doi: 10.3389/fphys.2013.00026
- M. Jabloun, P. Ravier and O. Buttellt, Phase-rectified signal averaging method applied to heart rate variability signals for assessment of the changes in sympathovagal balance during rest and tilt. 2010 18th European Signal Processing Conference, Aalborg, 2010, pp. 914-918.
- Peng C.K. Mosaic organization of DNA nucleotides. Phys Rev E. 49. 1994; p.1685-1689.
- Timo H. Prediction of Sudden Cardiac Death by Fractal Analysis of Heart Rate Variability in Elderly Subjects. Journal of the American College of Cardiology. 2001;37(5):1395-402.
- Timo H. Fractal Analysis and Time- and Frequency- Domain Measures of Heart Rate Variability as Predictors of Mortality in Patients with Heart Failure. Am J Cardiol. 2001;87:178-82.
- Tarvainen MP, et al. An advanced detrending method with application to HRV analysis. IEEE Transactions on Biomedical Engineering. 2002;49(2):172-5.
- Niskanen J-P, Tarvainen MP, Ranta-aho PO, and Karjalainen PA. Software for advanced HRV analysis. Comp Meth Programs Biomed. 2004;76(1):73-81.
- Tarvainen MP et al. Kubios HRV – heart rate variability analysis software. Computer methods and programs in biomedicine. 2014;113(1):210-20.
- Baevsky RM, et al. Analysis of heart rate variability when using various electrocardiographic systems. Bulletin of Arrhythmology. 2001, 24, p. 69-85.
- Khayutin VM, Lukoshkova EV. Heart rate fluctuations: spectral analysis. Bulletin of Arrhythmology. 2002, 26, pp. 10-21.
- Lukoshkova EV, Khayutin VM, Bekbosynova MS, Golitsyn SP. QRS amplitudogram and its frequency spectrum: application for assessing the power of heart rate fluctuations. Cardiology. 2000;9:54-57
- Kantelhardt JW, et al. Phase-rectified signal averaging for the detection of quasi-periodicities and the prediction of cardiovascular risk. Chaos. 2007;17(1):015112. doi:10.1063/1.2430636
- Piskorski J, Guzik P. Geometry of the Poincar é plot of RR intervals and its asymmetry in healthy adults. Physiol Meas. 2007;28(3):287-300.
- Coote JH. Recovery of heart rate following intense dynamic exercise. Experimental Physiology. 2010;95:431-40. doi:10.1113/expphysiol.2009.047548
- Hermand E, et al. Low-frequency ventilatory oscillations in hypoxia are a major contributor to the low-frequency component of heart rate variability. Eur J Appl Physiol. 2019;119:1769–77.
