The issues of tax burden distribution in Russia's economy

Author: Povarova Anna Ivanovna
Journal: Economic and Social Changes: Facts, Trends, Forecast @volnc-esc-en
Section: Social finances
Article in issue: 6 (30) т.6, 2013.
Free access
Tax burden has a direct influence on socio-economic processes and is one of the main criteria for evaluating the current tax system. But there still exist certain simplified views on the level of tax burden, which is identified with the actual transfer of payments to the budget. The article highlights the results of a research into the tax burden of Russia’s economy. The main goal was to identify the trends in the distribution of tax burden and its actual level. The main conclusion of the study consists in the following: the ongoing tax reforms have not led to the establishment of an efficient fiscal mechanism, which will facilitate the implementation of taxation equality principle and take into consideration the opportunities of tax-payers to pay compulsory payments and develop the production. Meanwhile, there is the potential for tax maneuver with regard to a number of industries.
Tax burden, oil and gas revenues, oil and gas companies, manufacturing, tax benefits
Short address: https://sciup.org/147223530
IDR: 147223530 | UDC: 336.221(470)
Text of the scientific article The issues of tax burden distribution in Russia's economy
Tax burden is the share of economic entities’ revenues that is transferred to the budget and extra-budgetary funds in the form of taxes and levies.
The world economy uses the ratio of tax revenues to GDP as the key parameter for estimating tax burden.
In 2011 the level of average tax burden in Russia was lower than in many European countries (fig. 1) .
In 2000–2004 tax burden on Russia’s economy did not exceed 30% of GDP. The increase in the level of taxation began in 2005 after the rise in mineral extraction tax (MET) rates and introduction of a new scale of export duties. An average of 34.3% of GDP was distributed through the tax system in 2005– 2012 (fig. 2).
At the same time, the dynamics of tax burden and GDP growth rates was counterdirectional, which indicates that the effected tax reforms did not stimulate economic growth.
What is the reason for such a low efficiency of Russia’s tax system?
Figure 1. Tax burden in the OECD countries and in Russia in 2011, as a percentage of GDP
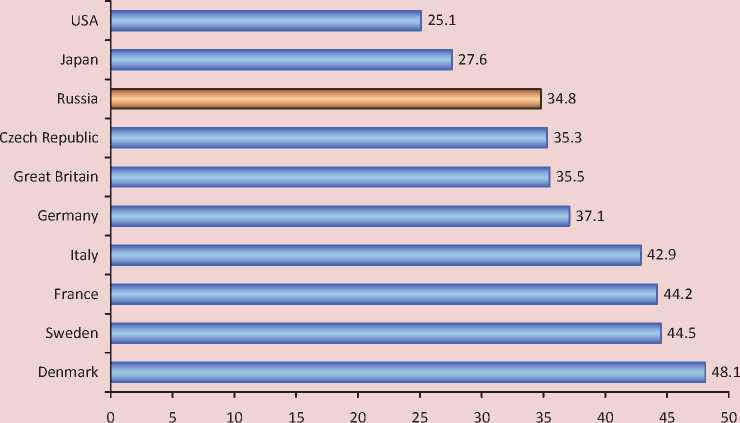
Source: OECD official website; Rosstat; author’s calculations.
Figure 2. Dynamics of tax burden and GDP growth rates in Russia in 2000–2012
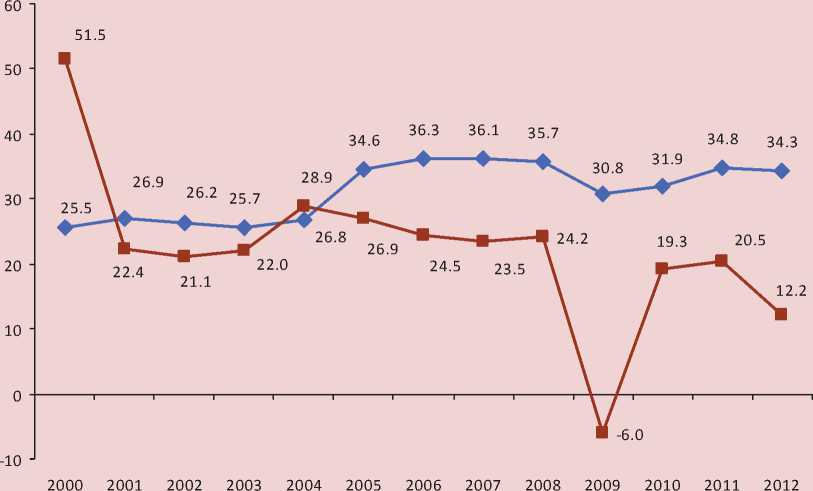
• Taxes, as a percentage of GDP — ■ — GDP growth rate, %
Source: Federal Treasury; Rosstat; author’s calculations.
The first reason consists in structural disproportions of budget revenues, the major part of which is represented by indirect taxes (VAT, excises) and foreign economic activity revenues (fig. 3) .
Indirect taxes and revenues from foreign economic activity, established in the form of a premium to the price artificially increase the volume of GDP. The desire of taxpayers to compensate for tax expenditures by raising prices of goods triggers inflation processes, constrains the demand and inevitably leads to a reduction in production. For example, the VAT rate decreased from 28% in 1992 to 18% in 2004–2012, however, this did not cause the decline in prices.
The second reason lies in the low level of sectoral diversification of the tax base, almost one third of tax revenues of the Russian budget is provided by the oil and gas industry (tab. 1) .
The third reason can be found in the high sectoral differentiation of tax burden – from 2% for air carriers to 39% for oil and gas producing enterprises (tab. 2) .
The fact that the oil and gas complex is the main source of budget revenues does not mean that it bears an increased tax burden in comparison with other industries. The point is that the share of production costs in the manufacturing industry is higher than in mining. Consequently, economic sectors differ significantly in the level of their profitability.
In 2010–2012 the highest level of profitability was observed in the oil and gas industry, which had the highest level of tax burden as well.
At the same time, the mechanical engineering enterprises, construction organizations, in which the share of tax deductions was smaller in comparison to oil and gas companies, but greater than the average in the economy, showed the profitability below the average level. In general, the financial position of all the above-mentioned manufacturing industries and construction was worse than that of the oil and gas industry with a high level of tax burden.
Trade stood out against the general background of tax burden distribution due to the
Figure 3. Aggregated structure of the RF consolidated budget revenues, as a percentage of GDP
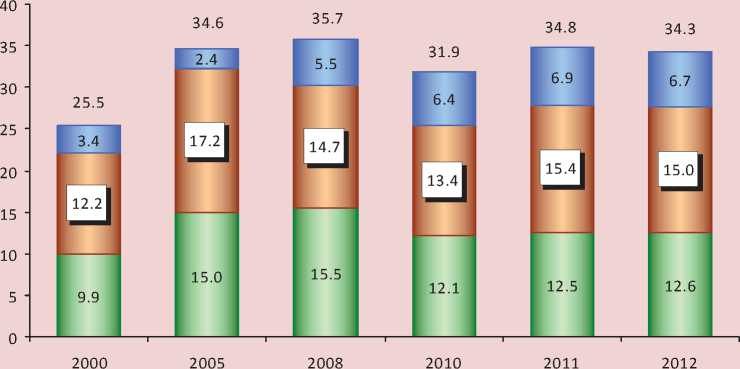
□ Direct taxes □ Indirect taxes and revenues from foreign economic activity □ Other revenues
Sources: author’s calculations based on the data of the Federal Treasury and Rosstat.
Table 1. Sectoral structure of tax revenues* in the RF budget system in 2008–2012
|
Type of economic activity |
2008 |
2009 |
2010 |
2011 |
2012 |
|||||
|
billion rub. |
% |
billion rub. |
% |
billion rub. |
% |
billion rub. |
% |
billion rub. |
% |
|
|
Total |
7968 |
100.0 |
6307 |
100.0 |
7688 |
100.0 |
9734 |
100.0 |
10953 |
100.0 |
|
Production of crude oil and natural gas |
2114.5 |
26.5 |
1319.5 |
20.9 |
1754.6 |
22.8 |
2532.2 |
26.0 |
2966 |
27.1 |
|
Manufacturing |
1280 |
16.1 |
988.6 |
15.7 |
1342 |
17.5 |
1696 |
17.4 |
1971 |
18.0 |
|
Trade |
751.4 |
9.4 |
627.5 |
9.9 |
787 |
10.2 |
1003 |
10.3 |
1296 |
11.8 |
|
Real estate operations, rent |
891.4 |
11.2 |
682 |
10.8 |
868 |
11.3 |
1101 |
11.3 |
1025 |
9.4 |
|
Transport and communication |
564 |
7.1 |
587 |
9.3 |
649.5 |
8.4 |
739.4 |
7.6 |
796 |
7.3 |
|
Construction |
431.5 |
5.4 |
393.4 |
6.3 |
412.5 |
5.4 |
516.4 |
5.3 |
606 |
5.5 |
|
Other |
1800 |
24.3 |
1620 |
25.7 |
1735 |
22.6 |
1930 |
19.9 |
2121 |
20.9 |
* Including taxes and levies, administrated by the Federal Tax Service. Sources: FTS data, author’s calculations.
fact that it had a minimum level of deductions under higher profitability in comparison with a number of other industries.
The existing unevenness of tax burden is indicated by structural imbalances in tax revenues. A large part of federal and territorial payments is formed by manufacturing, and the increased tax burden of the oil and gas
industry is conditioned by the payment of mineral extraction tax alone (tab. 3) .
It is obvious that from 1 up to 13% of taxes is concentrated in the oil and gas industry besides mineral extraction tax. Even the share of income tax accounted for only 2.4%, while this economic sector is distinguished by impressive wages and dividends.
Table 2. Profitability and tax burden by the types of economic activities in 2010–2012
|
Type of economic activity |
Profitability of sales, % |
Tax burden, as a percentage of proceeds* |
||||
|
2010 |
2011 |
2012 |
2010 |
2011 |
2012 |
|
|
Total |
11.4 |
11.5 |
9.7 |
9.4 |
9.7 |
9.8 |
|
Oil and gas production |
33.1 |
32.1 |
28.8 |
33.2 |
36.3 |
39.0 |
|
Real estate operations |
11.8 |
10.4 |
10.0 |
19.7 |
22.2 |
18.6 |
|
Construction |
5.7 |
6.8 |
6.7 |
11.3 |
12.2 |
13.0 |
|
Transport and communication |
13.8 |
12.8 |
12.2 |
9.8 |
9.7 |
9.1 |
|
air transport activities |
n.a. |
n.a. |
n.a. |
1.4 |
2.3 |
2.0 |
|
communication |
27.9 |
24.6 |
26.7 |
15.0 |
14.2 |
14.2 |
|
Processing production, total |
14.3 |
13.2 |
11.0 |
7.2 |
7.1 |
7.5 |
|
Including the production of |
||||||
|
foodstuffs |
12.2 |
8.1 |
11.1 |
15.4 |
14.9 |
16.6 |
|
machinery and equipment |
7.3 |
7.0 |
7.7 |
11.1 |
11.1 |
11.3 |
|
electric and electronic equipment |
10.1 |
10.0 |
8.1 |
10.2 |
9.8 |
10.3 |
|
construction materials |
7.9 |
11.8 |
12.4 |
7.3 |
7.5 |
7.9 |
|
textile and sewing |
5.4 |
7.1 |
12.3 |
7.9 |
6.9 |
7.6 |
|
Production of power, gas and water |
7.2 |
6.6 |
4.7 |
5.3 |
4.8 |
4.2 |
|
Trade |
9.2 |
10.5 |
8.2 |
2.4 |
2.4 |
2.8 |
Table 3. Tax proceeds from oil and gas and manufacturing industries in 2011–2012
|
Taxes |
Oil-and-gas producing industry |
Manufacturing industry |
||||||
|
2011 |
2012 |
2011 |
2012 |
|||||
|
billion rub. |
share, %* |
billion rub. |
share, %* |
billion rub. |
share, %* |
billion rub. |
share, %* |
|
|
Profit tax |
298.0 |
13.1 |
273.4 |
11.6 |
371.7 |
16.4 |
354.2 |
15.1 |
|
Individual income tax |
47.1 |
2.4 |
53.6 |
2.4 |
284.5 |
14.3 |
317.1 |
14.0 |
|
Excises |
5.7 |
0.9 |
25.7 |
3.3 |
590.8 |
97.8 |
752.0 |
95.7 |
|
VAT |
157.2 |
8.5 |
215.9 |
10.9 |
320.6 |
17.4 |
400.9 |
20.2 |
|
Mineral extraction tax |
1916 |
93.8 |
2316.5 |
94.2 |
5.5 |
0.3 |
9.3 |
0.4 |
|
Regional taxes |
70.4 |
12.8 |
61.6 |
9.8 |
80.1 |
14.5 |
90.9 |
14.5 |
|
Local taxes |
1.4 |
1.1 |
1.5 |
0.9 |
25.1 |
19.7 |
26.8 |
16.9 |
* The share in the total amount of tax revenues in the RF budget system. Sources: FTS data; author’s calculations.
Table 4. Production costs* and average selling prices in Russia’s largest companies in 2011–2012
|
Company |
Cost per unit, US dollars** Unit costs, dollars |
Average selling price for products, US dollars*** |
Excess of the average selling price over the costs, fold |
Profitability of sales, % |
||||
|
2011 |
2012 |
2011 |
2012 |
2011 |
2012 |
2011 |
2012 |
|
|
Oil-and-gas producing companies |
||||||||
|
Gazprom |
13.3 |
14.3 |
185 |
215 |
13.9 |
15.0 |
35.7 |
27.1 |
|
LUKOIL |
4.96 |
5.0 |
109.8 |
110.8 |
22.1 |
22.2 |
10.1 |
11.6 |
|
Rosneft |
2.8 |
2.96 |
108.6 |
109.9 |
38.8 |
37.1 |
16.5 |
12.4 |
|
Gazprom Neft |
5.9 |
5.5 |
110 |
110.8 |
18.6 |
20.1 |
20.3 |
16.2 |
|
Surgutneftegas |
2.6 |
2.8 |
110 |
110.8 |
42.3 |
39.6 |
32.0 |
27.1 |
|
Metallurgical and chemical companies |
||||||||
|
Severstal |
682 |
636 |
867 |
751 |
1.3 |
1.2 |
13.8 |
11.5 |
|
MMK |
660 |
665 |
836 |
732 |
1.3 |
1.1 |
9.4 |
9.2 |
|
PhosAgro |
451 |
479 |
637 |
654 |
1.4 |
1.4 |
29.2 |
26.8 |
|
* The coefficients contained in the annual statements of oil and gas companies were used for translating cubic meters of gas into tons of oil equivalent, and tons into barrels. ** Oil-and-gas producing companies – dollars/barrel; metallurgical and chemical companies – dollars/ton. *** Gazprom – dollars/thousand cubic meters; other oil-and-gas producing companies – dollars/barrel; metallurgical and chemical companies – dollars/ton. Sources: author’s calculations based on companies’ annual and financial statements (IFRS). |
||||||||
Figure 4. Structure of revenues from the oil and gas industry taxes and levies, %
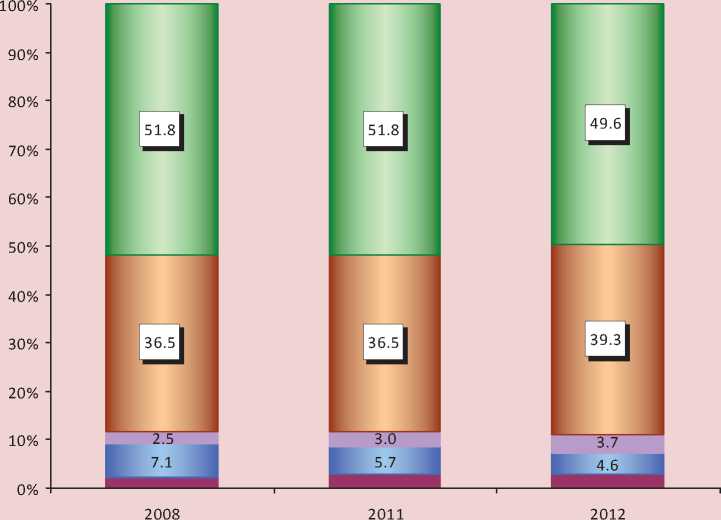
■ Other □ Profit tax ■ VAT □ Mineral ectraction tax □ Customs duties
Sources: author’s calculations based on the data of the Federal Tax Service and Rosstat.
Undoubtedly, the tax burden indicator, defined in the economy as a whole and in the industry in particular, does not take into account the specifics that influence the formation of the tax base of a specific taxpayer. Therefore, to gain a deeper understanding of the causes of fiscal burden discord in Russia’s economy, let us consider the consolidated annual accounts of the largest companies, compiled according to international and Russian standards.
The comparison of production costs with the average selling prices of the products shows that the gap between the cost of hydrocarbons production and their selling prices in the oil and gas producing companies is dozens of times. As for metallurgical and chemical holdings, the average selling price exceeds production costs only 1.1–1.4-fold (tab. 4) .
A considerable excess of selling prices over the costs of oil and gas companies forms the rent that the state, being the owner of natural resources, withdraws to the budget in the form of mineral extraction tax and export-import operations payments (customs duties). Rental payments constitute almost 90% in the structure of receipts from the oil and gas industry taxes and levies (fig. 4) .
Without oil and gas revenues, the budget deficit in Russia would significantly exceed the optimum level (5%). For instance, in 2008– 2012 the non-oil and gas deficit of the RF
consolidated budget increased twice and reached 7.7 trillion rubles or 12.4% of GDP (fig. 5) , which once again proves that the fuel and energy complex (FEC) plays the key role as a revenue source.
When assessing the amount of tax burden of the oil and gas sector, the issue concerning the financial and legal essence of rent payments is considered a rather debating point. For example, the Ministry of Finance, when determining the level of tax deductions, sums up primary goods’ payments and other taxes. The Federal Tax Service of Russia calculates tax burden excluding customs duties, because their enforcement is regulated by the Customs Code and administered by the Federal Customs Service.
The author considers that the viewpoint of Doctor of Economics M.M Sokolov is more convincing; he argues that the extracted oil is the property of Russian state, with its permission, in compliance with the existing licensing mechanism, a subsurface user carries out extraction works on a site of the state subsoil fund. Hence the rent that is created mainly regardless of the efforts of oil and gas enterprises should not be considered as part of tax burden, especially since its withdrawal does not decrease their profitability in relation to other sectors [7], which is evidenced by the profitability of the oil and gas industry, three times exceeding the economic average level.
Figure 5. Dynamics of the RF non-oil budget deficit in 2008–2012
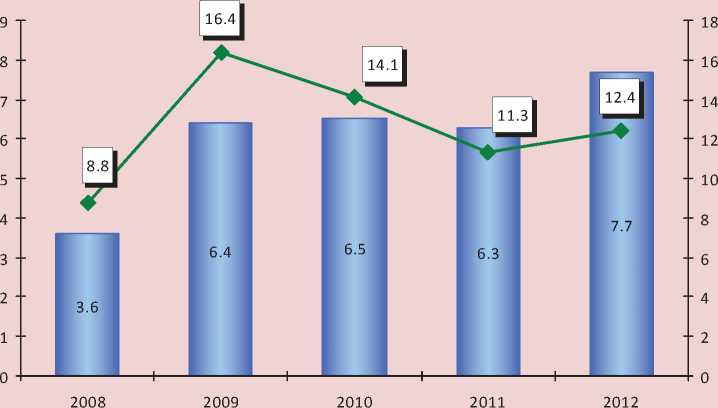
I----1 Trillion rubles ♦ As a percentage of GDP
Sources: author’s calculations based on the data of the Federal Treasury.
Sharing the view point of M.M. Sokolov, we may add that, in accordance with the Tax Code, customs duties are not included in the list of federal taxes and they are considered as revenues from foreign economic activity, which once again indicates their non-tax nature.
As for mineral extraction tax, its introduction in 2002 was the result of an agreement between oligarchic clans and the state. A complete systemic collapse after the August default of 1998 created a threat to the very foundations of oligarchic ownership, prompting the oligarchs, who were appropriating almost all of the natural rent over the 1990s, to share the revenues with the state [1]. The introduction of mineral extraction tax has allowed for increasing federal budget revenues by 45%.
By the end of 2012 the revenues of OJSC Gazprom, LUKOIL, Rosneft, Gazprom Neft were significantly higher than the revenues of other major Russian joint-stock companies, and the aggregate revenues of oil and gas holdings were about 15 trillion rubles, which
1.2-fold exceeded the aggregate revenues of the federal budget and it proves that the oil and gas industry possess significant fiscal capabilities. After all operating expenses and tax payments, 8–25% of revenue in the form of net profit remained at the disposal of oil companies, while other companies had less than 6% (tab. 5) .
How much is the share of revenues that the oil and gas companies directed to the payment of taxes and levies? Table 6 provides the information, characterizing the relationship between these companies and the budgetary system.
As we can see, the share of taxes and customs payments in the money turnover of the companies ranged from 27% in LUKOIL up to 52% in Rosneft, this fact should be linked with a different structure of extracted and processed hydrocarbons, as well as with the unequal share of supplies in the domestic and foreign market.
If we exclude the rent component out of taxation, then the fiscal burden of Gazprom, Surgutneftegas, Gazprom Neft will decrease in
Table 5. Revenues and net profit of the largest Russian companies for 2012, billion rubles
|
Company |
Type of activity |
Proceeds |
Net profit |
In % to proceeds |
|
Gazprom |
Oil and gas |
4764 |
1211 |
25.4 |
|
LUKOIL |
Oil and gas |
4227 |
334 |
7.9 |
|
Rosneft |
Oil and gas |
3078 |
342 |
11.1 |
|
Gazprom Neft |
Oil and gas |
1230 |
176 |
14.3 |
|
Surgutneftegas |
Oil and gas |
850 |
180 |
21.2 |
|
Sistema JSFC |
Telecommunications |
850 |
27 |
3.2 |
|
Transneft |
Oil and gas |
732 |
184 |
25.1 |
|
MRSK Holding |
Electrical power engineering |
622 |
32 |
5.1 |
|
Magnit |
Trade |
449 |
25 |
5.6 |
|
Severstal |
Ferrous metallurgy |
438 |
25 |
5.7 |
|
Sources: consolidated annual financial statements of the companies; author’s calculations. |
||||
Table 6. Tax payments and customs duties of the oil and gas companies in the RF budgetary system in 2011–2012
|
Indicators |
Gazprom |
LUKOIL |
Rosneft |
Gazprom Neft |
Surgutneftegas |
|||||
|
2011 |
2012 |
2011 |
2012 |
2011 |
2012 |
2011 |
2012 |
2011 |
2012 |
|
|
Taxes and duties, total, billion rub.* |
1683 |
1903 |
1212 |
1107 |
1390 |
1622 |
490 |
450 |
295 |
314 |
|
As a percentage of proceeds |
36.3 |
39.9 |
28.2 |
26.2 |
51.1 |
52.7 |
47.6 |
36.6 |
37.1 |
36.9 |
|
Rent payments, as a percentage of the total amount of taxes |
55.5 |
57.1 |
89.8 |
92.0 |
86.6 |
88.0 |
75.9 |
73.2 |
77.3 |
80.9 |
|
Taxes without rent payments, billion rub. |
750 |
817 |
124 |
89 |
186 |
194 |
118 |
120 |
67 |
60 |
|
As a percentage of proceeds |
16.2 |
17.1 |
2.9 |
2.1 |
6.8 |
6.3 |
11.4 |
9.8 |
8.4 |
7.1 |
* Taxes, paid to the RF consolidated budget, including state extra-budgetary funds. Sources: financial statements of the companies; author’s calculations.
2–5 times, and that of LUKOIL and Rosneft – in 8–12 times, given the higher share of primary goods’ payments. Without duties and mineral extraction tax, the level of tax threshold of Gazprom Neft will be comparable to the average for Russia’s economy, and the level of tax threshold of Surgutneftegas and Rosneft will be 1.5 times lower. The tax burden of LUKOIL, which is the second largest company by the amount of revenues, will be less than 3% (for comparison: in 2012 the enterprises producing vehicles and equipment, the profitability of which was the lowest in the economy, had the tax burden equal to 6.2%).
It should be noted that the share of tax payments in the revenues has been calculated by the author based on the taxes actually paid to the budget. Taking into account the obligations to the budget system, the collection of tax payments from the leading oil and gas companies can be increased by 9–18%. However, a subsequent increase in tax burden will be leveled by tax refund (tab. 7).
Thus, the results of the analysis imply that the tax burden of the oil and gas companies is not as great as it is often considered to be1. Moreover, these companies shift part of tax burden to domestic consumers, as evidenced by the continuous increase in the gas and petrol prices. While oil prices are rising, a significant growth in the welfare of Russia’s citizens is out of the question. In 2008–2012 the number of people with incomes below the subsistence level decreased only by 18%, while the average salary of the fuel and energy complex employees increased by 46.5%, and its amount exceeded the national average salary in 2.1 times (tab. 8) .
Table 7. Arrears of the oil and gas companies in the payments to the budget, and the taxes presented for reimbursement from the budget in 2011–2012
|
Indicators |
Gazprom |
LUKOIL |
Rosneft |
Gazprom Neft |
Surgutneftegas |
|||||
|
2011 |
2012 |
2011 |
2012 |
2011 |
2012 |
2011 |
2012 |
2011 |
2012 |
|
|
Arrears in the payments to the budget, billion rubles* |
94 |
115 |
73 |
85 |
66 |
77 |
30 |
36 |
33 |
30 |
|
As a percentage of the volume of taxes* |
9.3 |
9.5 |
14.7 |
18.3 |
11.0 |
10.7 |
12.0 |
13.0 |
10.4 |
9.3 |
|
VAT and other taxes subject to refund, billion rub. |
304 |
395 |
43 |
57 |
62 |
87 |
28 |
39 |
8 |
12 |
|
As a percentage of the volume of taxes excluding rent payments |
40.5 |
48.4 |
34.7 |
63.5 |
33.3 |
44.8 |
23.7 |
32.5 |
9.0 |
17.3 |
* Excluding customs duties.
Sources: financial statements of the companies; author’s calculations.
Suffice it to say that in 2012 the volume of industrial production in the Russian Federation was below the level of 1990 by 23%, and the difference between the incomes of the richest 10% and the poorest 10% of the Russians was 16.3-fold compared to 4.4-fold in 1990.
Why is it that Russia, with its immence oil revenues2, is falling behind in socio-economic development for more than 20 years? This is largely due to the fiscal policy, one aspect of which is the accumulation of oil revenues in stabilization funds instead of using them directly for economic development. For example, out of 7.4 trillion rubles of commodity payments received in 2012, 1.8 trillion rubles or 24.3% was directed to stabilization funds. On August 1, 2013 5.7 trillion rubles was concentrated in the Reserve Fund and the National Welfare Fund (tab. 9) , which corresponds to 8.5% of GDP, or nearly half of the tax revenue planned in the federal budget for 2013.
The existing fiscal potential of FEC may also be assessed judging by the directions of the monetary resources utilization.
For example, Gazprom’s net profit in 2011–2012 exceeded one trillion rubles, and selling and administrative expenses, which consumed almost one third of the revenues, approached this figure (fig. 6).
For 2008–2011 the dividends of Gazprom shareholders have increased 25-fold. Other companies also increased their dividend payments, spending an average of 20% of net profit for this purposes, and Gazprom Neft – 38% (tab. 10) .
Oil and gas companies were extremely generous in the amount of financial rewards provided to the members of their Boards of Directors and Executive Boards (fig. 7) .
Over 30% of the payroll fund was spent on the salaries of OJSC Surgutneftegas managers in 2011–2012, and the average amount of top managers’ remuneration four times exceeded the average remuneration in the company as a whole (tab. 11) .
Not only oilmen, but also some officials3 point out that tax pressure does not allow enough money to be invested in the development of the oil and gas industry. So is this really true?
At the end of 2012 the oil and gas companies’ own financial resources in the form of retained earnings, net profit and cash ranged from 1.1 trillion rubles in Gazprom Neft to
Table 8. Average consumer prices for gas and petrol, the population of the Russian Federation with incomes below the subsistence level, the average monthly nominal wage of FEC employees in 2008–2012
|
Indicators |
2008 |
2009 |
2010 |
2011 |
2012 |
2012 to 2008, % |
|
World oil price, dollars/barrel |
93.9 |
60.8 |
78.2 |
109.6 |
110.8 |
118.0 |
|
Automobile gasoline price, rubles/liter |
17.41 |
19.16 |
20.09 |
24.65 |
26.56 |
152.6 |
|
Pipeline gas, rubles per person per month |
30.20 |
37.04 |
43.81 |
48.32 |
55.36 |
183.3 |
|
Number of people with incomes below the subsistence level, million people |
19.0 |
18.4 |
17.7 |
17.9 |
15.6 |
82.1 |
|
Average monthly nominal accrued wages of the fuel and energy complex employees, thousand rubles |
39.1 |
41.6 |
46.3 |
51.6 |
57.3 |
146.5 |
|
In % to the national average wages in Russia |
226.0 |
223.7 |
220.5 |
220.5 |
213.8 |
х |
|
Sources: Rosstat; author’s calculations. |
||||||
Table 9. The volume of resources concentrated in Russia’s stabilization funds in 2008–2013, billion rubles
|
Indicators |
2008 |
2009 |
2010 |
2011 |
2012 |
2013 |
01.08.2013 |
|
Reserve Fund |
3057.9 |
4027.6 |
1830.5 |
775.2 |
811.5 |
1885.7 |
2807.0 |
|
National Welfare Fund |
783.3 |
2584.5 |
2769.0 |
2695.5 |
2794.4 |
2690.6 |
2858.0 |
|
Total |
3841.2 |
6612.1 |
4599.5 |
3470.7 |
3605.9 |
4576.3 |
5665.0 |
|
As a percentage of GDP |
11.6 |
16.0 |
11.9 |
7.5 |
6.5 |
7.3 |
8.5 |
|
As a percentage of the tax revenues of the federal budget |
54.8 |
75.3 |
70.3 |
45.9 |
34.1 |
39.1 |
47.6 |
|
Sources: data of the RF Finance Ministry; Federal Treasury; author’s calculations. |
|||||||
Figure 6. Net profit, selling and administrative expenses of OJSC Gazprom in 2008–2012, billion rubles
2008 2009 2010 2011 2012
I------1 Net profit
I----1 Selling and administrative expenses
* Share ofsellingand administrative expenses in proceeds, %
28.5
27.5
26.5
25.5
24.5
23.5
Sources: OJSC Gazprom’s financial statements, author’s calculations.
Table 10. Dividends of oil and gas companies accrued in 2008–2011
|
Company |
2008 |
2009 |
2010 |
2011 |
2011 to 2008, times |
||||
|
Billion rub. |
%* |
Billion rub. |
%* |
Billion rub. |
%* |
Billion rub. |
%* |
||
|
Gazprom |
8.5 |
4.9 |
56.6 |
9.1 |
91.1 |
25.0 |
212.4 |
24.1 |
25.0 |
|
Rosneft |
20.3 |
14.4 |
24.4 |
11.7 |
29.3 |
15.3 |
78.5 |
33.2 |
3.9 |
|
LUKOIL |
42.5 |
15.8 |
44.2 |
20.9 |
55.2 |
19.9 |
85.0 |
25.5 |
2.0 |
|
Gazprom Neft |
25.6 |
36.3 |
16.9 |
30.5 |
21.6 |
39.6 |
34.6 |
45.2 |
1.4 |
|
Surgutneftegas |
31.6 |
22.0 |
24.2 |
21.2 |
27.0 |
20.9 |
38.0 |
16.3 |
1.2 |
|
* Dividends in % to net profit. Sources: the companies’ annual and accounting (by Russian Accounting Standards) statements; author’s calculations. |
|||||||||
Figure 7. Annual remuneration of the main managing bodies of the oil and gas companies in 2011–2012, million rubles per person

о 2011 □ 2012
Sources: companies’ annual statements, author’s calculations.
Table 11. Average remuneration of managers at OJSC Surgutneftegas in 2009–2012
|
Indicators |
2009 |
2010 |
2011 |
2012 |
|
Average number of employees, people |
106197 |
108995 |
111497 |
113700 |
|
Including key management personnel, people |
8325 |
8640 |
8927 |
9181 |
|
Payroll, billion rubles |
52.6 |
57.3 |
64.8 |
76.8 |
|
Remuneration of managers, % to the payroll |
21.1 |
20.2 |
30.1 |
34.1 |
|
Average salary, rubles per one employee |
41280 |
43835 |
48333 |
56282 |
|
Average salary of managers, rubles per one employee |
110987 |
111672 |
181863 |
237492 |
|
In % to the average salary of all employees |
268.9 |
254.8 |
376.3 |
422.0 |
|
Sources: annual statements of OJSC Surgutneftegas (Russian Accounting Standards); author’s calculations. |
||||
Table 12. Own funds and capital expenditures of the oil and gas companies in 2011–2012, billion rubles
|
Indicators |
Gazprom |
LUKOIL |
Rosneft |
Gazprom Neft |
Surgutneftegas |
|||||
|
2011 |
2012 |
2011 |
2012 |
2011 |
2012 |
2011 |
2012 |
2011 |
2012 |
|
|
Own funds |
9086 |
9801 |
2610 |
2737 |
2362 |
2785 |
866 |
1071 |
1753 |
1822 |
|
As a percentage of taxes and duties |
540.0 |
515.0 |
215.3 |
247.2 |
170.0 |
171.7 |
176.7 |
238.0 |
239.5 |
233.6 |
|
Capital expenditures |
1553 |
1340 |
273 |
360 |
391 |
466 |
131 |
158 |
126 |
140 |
|
As a percentage of own funds |
17.1 |
13.7 |
10.5 |
13.2 |
16.6 |
16.7 |
15.1 |
14.8 |
7.2 |
7.7 |
Sources: consolidated financial statements of the companies; author’s calculations.
Table 13. Tax privileges granted to economic entities of the Russian Federation in 2011–2012
|
Indicators |
2011 |
2012 |
||
|
Billion rub. |
As a percentage of assessed sum |
Billion rub. |
As a percentage of assessed sum |
|
|
Privileges, total |
24043.8 |
78.9 |
28490.0 |
81.8 |
|
Profit tax |
162.1 |
7.7 |
201.2 |
9.6 |
|
including the reduction in the tax base by the sum of losses for the previous years |
95.3 |
4.5 |
134.4 |
6.4 |
|
VAT |
23155.9 |
92.7 |
27424.0 |
93.8 |
|
exemption from payment, total |
3335.7 |
13.6 |
5056.9 |
17.3 |
|
including the subjects of financial activity |
2965.3 |
11.9 |
4642.4 |
15.9 |
|
Excises |
85.3 |
12.7 |
103.7 |
12.3 |
|
including on spirit, alcohol products, beer and tobacco goods |
26.2 |
3.9 |
16.0 |
1.9 |
|
Mineral extraction tax |
262.9 |
12.6 |
323.9 |
13.1 |
|
Water tax |
1.4 |
44.2 |
1.3 |
50.9 |
|
Transport tax |
1.5 |
6.8 |
1.4 |
6.1 |
|
Land tax |
50.0 |
40.6 |
68.8 |
53.6 |
|
Corporate property tax |
324.6 |
66.9 |
365.6 |
66.3 |
|
including the subjects of natural monopolies |
168.2 |
34.7 |
199.4 |
36.1 |
|
Sources: Federal Tax Service; author’s calculations. |
||||
Table 14. VAT incomes by the types of economic activities for 2012
|
Type of economic activity |
Billion rub. |
Share in the total amount of paid taxes, % |
|
Total |
1988.7 |
18.2 |
|
Manufacturing industries, total |
453.8 |
33.1 |
|
Including production of |
||
|
automobiles |
62.7 |
58.1 |
|
electric, electronic and optical equipment |
66.1 |
48.4 |
|
machinery and equipment |
75.1 |
46.8 |
|
rubber and plastic goods |
16.2 |
45.5 |
|
other non-metallic mineral products |
40.4 |
43.5 |
|
textile and sewing |
7.5 |
38.8 |
|
foodstuffs |
105.6 |
24.7 |
|
Construction |
293.0 |
48.4 |
|
Financial activity |
41.4 |
8.4 |
|
Mining operations |
218.0 |
7.2 |
|
Sources: Federal Tax Service; author’s calculations. |
||
9.8 trillion rubles in Gazprom (tab. 12) , that is hundreds times higher than the paid taxes and duties.
At the same time, such a huge concentration of money did not stimulate investment activity sufficiently. The companies spent 7–17% of available financial resources on capital investments.
These examples indicate that there exists a substantial gap between the capabilities of the oil and gas complex in increasing budget revenues and funding, and the actual level of contribution to the budget and investments.
Pointing out a hard taxation regime, the heads of commodity companies do not mention that the Russian authorities have taken actual measures aimed at its mitigation. In 2011 the procedure of levying export duties on oil and oil
products was changed, targeted tax incentives were introduced for shelf activities and for the development of hard-to-reach oil reserves; these measures should facilitate the emergence of new investment projects.
Speaking about tax burden on Russia’s economy, one should not forget about the significant number of tax benefits, regardless of the amount of profit received.
Unfortunately, official statistics lack the data on tax benefits by the types of taxpayers. Partly, these gaps can be bridged by some information contained in the statements of the Federal Tax Service.
In 2011–2012 the volume of granted tax preferences was 80% of the taxes assessed for payment; this fact is indicative of the enormous tax potential of Russia’s economy (tab. 13) .
VAT accounts for the lion’s share of benefits. According to FTS, the sum of assessed VAT was 29.2 trillion rubles in 2012 (for comparison: in 2012 the consolidated budget of the Russian Federation received 23.1 trillion rubles of revenues). 27.4 trillion rubles of deductions and refunds, and 5.1 trillion rubles of exemptions were granted out of this sum. In fact, the total amount of tax preferences exceeded the volume of assessed VAT by 3.3 trillion rubles. At the same time, over 90% of exemptions were provided to the subjects of financial activity that occupy the fourth place in the economy in terms of profit.
The main burden of VAT payment is carried by the enterprises producing automobiles, machinery, electronic equipment, rubber and plastic products, as well as construction organizations (tab. 14) . The VAT paid by these organizations accounts for an average of 50% of all their taxes; as for the VAT paid by the mining industry and financial sector enterprises, it is only 7–8% of their overall taxes.
According to our estimates, the introduction of differentiated rates of VAT refund at the export of finished products, the full abolition of VAT refunds to natural resources exporters, the cancellation of exemptions provided to the subjects of financial activity will increase the revenues of the federal budget by 4–5 trillion rubles annually [6].
Tax legislation provides an opportunity of charging the amount of losses for the previous years to the expenses4; as a result, the tax base for corporate income tax was reduced by 134 billion rubles or by 6.4% in 2012. The share of organizations that submitted a zero accounting by income tax, increased from 24% in 2008 to 35.7% in 2012 (fig. 8) .
Almost 90% of federal benefits on corporate property tax are granted to highly profitable subjects of natural monopolies: railway lines, main pipelines and power transmission lines. Full abolition of these preferences could increase the annual revenues from corporate property tax in the regions’ budgets by approximately 200 billion rubles, or 30%.
In our opinion, it is necessary to reconsider the tax incentives for producers of alcohol and tobacco products, who enjoy benefits in the field of excise taxation. The abolition of these benefits will increase the revenues from excises by an average of 20 billion rubles per year.
Figure 8. The number of organizations that submitted zero accounting by income tax in 2006–2012
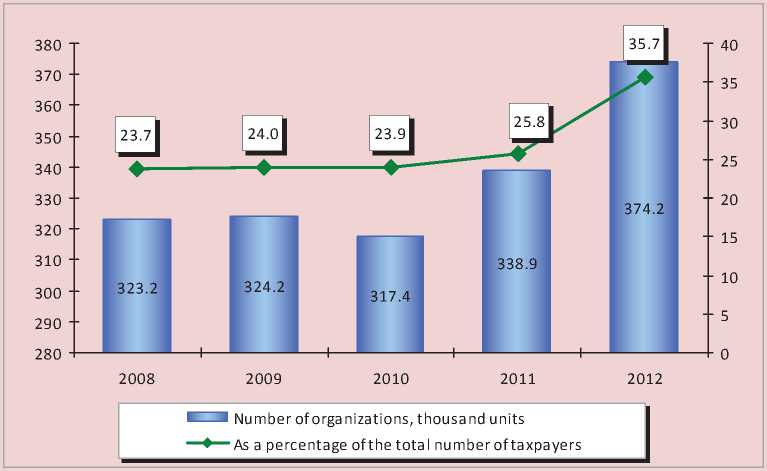
Sources: FTS data; author’s calculations.
In view of the above, we can conclude that Russia’s system of tax privileges, exemptions and refunds that are often provided to highly profitable economic entities, shifts part of tax burden to taxpayers with much smaller profits, thus increasing disparity in the distribution of tax burden and distorting its average value.
Along with the extensive system of tax preferences, a large-scale shadow sector of the economy also exerts negative influence on tax collection and the formation of the average tax burden indicator. The total volume of shadow economy in Russia is estimated at 46% of GDP, which is 3.5 times the size of shadow economies in such countries as the USA, France and Canada [8].
According to the Bank of Russia, in 2008– 2012 the country lost an average of 1.1 trillion rubles annually as a result of shady export transactions, sham contracts and transactions with securities and loans. In view of the fact that these resources had not been subject to profit tax assessment, the RF consolidated budget lost at least 230 billion rubles, or more than 11% of the profit tax revenues annually (tab. 15).
Russia’s business entities illegally withdraw money from the country mainly by establishing subsidiaries in offshores, through which the money is transferred under the guise of exportimport operations.
For example, in 2008–2011 Russia’s leading metallurgical enterprises Magnitogorsk Iron and Steel Works (MMK), Novolipetsk Steel (NLMK) and Cherepovets Steel Mill (CherMK), using trader offshore schemes, withdrew approximately 308.4 billion rubles of export revenue, which could replenish the budget by 65 billion rubles provided that the revenue had been subject to profit tax [3]. In addition, these enterprises were refunded the lion’s share of VAT paid at the export of products. As a result, the tax burden of the largest holding companies of ferrous metallurgy, the proceeds of which are measured in hundreds of billions of rubles, was almost twice lower than the national average (tab. 16) .
Table 15. Money and profit tax losses as a result of dubious international trade operations in 2008–2012, billion rubles
|
Indicators |
2008 |
2009 |
2010 |
2011 |
2012 |
On average for 2008–2012 |
|
Finances |
1487 |
744 |
789 |
1072 |
1178 |
1054 |
|
Provisional tax on profit |
357 |
179 |
158 |
214 |
236 |
230 |
|
As a percentage of the profit tax received by Russia’s budget |
14.2 |
14.2 |
8.9 |
9.4 |
10.0 |
11.3 |
|
Sources: Bank of Russia; Federal Treasury; author’s calculations. |
||||||
Table 16. Shortfall in revenue from export sales and the tax burden of metallurgical plants in 2008–2011, billion rubles
|
Indicators |
MMK |
NLMK |
CherMK |
Total |
|
Short received profit |
126.8 |
116.0 |
65.6 |
308.4 |
|
Profit tax that was not paid to the RF budget |
27.0 |
24.2 |
13.6 |
64.8 |
|
Taxes paid to the budget |
48.7 |
53.9 |
52.0 |
154.6 |
|
Sales proceeds |
812.0 |
732.0 |
852.0 |
2396 |
|
Average tax burden, % to proceeds |
6.0 |
7.4 |
6.1 |
6.5 |
|
For reference: average tax burden in RF, % |
11.3 |
|||
The level of taxation is, to some extent, influenced by the improper condition of tax discipline, which is reflected in the arrears in payments to the budget system. Non-payments reduce tax collection by 9–16% (tab. 17) .
It would seem that the existing tax arrears should be considered as a factor in the potential increase of tax burden. However, table 17 shows that more than half of the total volume of liabilities to the budget is represented by the debts that have been settled and are impossible to recover; therefore the amount of debts accumulated for the previous years can hardly result in a noticeable increase in the level of tax burden in the future.
Judging by the results of the survey, we can conclude that a highly uneven distribution of tax burden contrary to the fundamental principle of fair taxation is one of the key problems of the Russian tax system. Such measures as burdening manufacturing enterprises with taxation on the one hand, and providing the wide range of tax preferences to highly profitable industries on the other do not allow the economy to step onto the path of modernization growth; they restrict the opportunities for making longterm investments in the development and creation of new technologies, and reduce the competitiveness of domestic products5.
It seems that the problem of limiting tax pressure in the processing industries can be largely solved by expanding the tax base at the expense of the following unrealized reserves.
First, some tax concessions and exemptions should be cancelled, above all with regard to the financial sector of the economy, the largest exporters of raw materials and semi-finished products, subjects of natural monopolies, producers of alcohol and tobacco products. According to our calculations, this will increase the incomes of the RF consolidated budget by an average of 4.3–5.3 trillion rubles per year.
Second, shadow business should be involved in the sphere of taxation. According to official statistics alone, the annual illegal export of capital from the country is about 1.1 trillion rubles, and budget’s losses from the so-called fly-by-night companies are estimated at 0.5 to 1 trillion rubles.
Table 17. Arrears in payments to the RF budget system, billion rubles
|
Indicators |
01.01.2012 |
01.01.2013 |
01.07.2013 |
|
Level of fiscal performance, % |
90.6 |
91.3 |
83.6 |
|
Arrears, total |
1004.7 |
1047.6 |
1067.9 |
|
Including settled* and non-recoverable |
547.8 |
583.4 |
576.9 |
|
In % to the total sum of arrears |
54.5 |
55.7 |
54.0 |
|
* Restructured, deferred, spread arrears; arrears, the recovery of which has been suspended due to the initiation of bankruptcy proceedings. Sources: FTS; author’s calculations. |
|||
References The issues of tax burden distribution in Russia's economy
- Gubanov S. Russia’s system choice and quality of life. Ekonomist. 2011. No. 11. P. 3.
- Dmitriyeva O.G. Extra money of Motherland. Argumenty nedeli. 2013. No. 5.
- Ilyin V.A., Povarova A.I. Budget crisis of the regions. Vologda: ISEDT RAS, 2013.
- Tax Code of the Russian Federation. Available at: http://www.consultant.ru/.
- Main directions of the tax policy for 2014 and for the planned period of 2015 and 2016. Official website of the Ministry of Finance of the Russian Federation. Available at: http://www1.minfin.ru/ru/
- Povarova A. I. Inefficient VAT administration as a threat to Russia’s economic security. Economic and social changes: facts, trends, forecast. 2013. No. 2. P. 111-124.
- Sokolov M. Measure of tax burden in the oil and gas sector. Ekonomist. 2013. No. 6. P. 50.
- The shadow economy in Russia is estimated at 46% of GDP. Official website of Forbes magazine. Available at: http://www.forbes.ru/news/234247
