The role and geographical features of the chemical industry in the development of the economy of Uzbekistan

Author: Komilova N.Kh., Abdinazarova H.O.
Journal: Экономика и социум @ekonomika-socium
Section: Основной раздел
Article in issue: 5-1 (84), 2021.
Free access
The article focuses on the volume of products created in 2000-2019 y, the main types of products and regional-structural changes in the study of the role of the chemical industry in the development of the national economy, one of the branches of industrial geography.
National economy, chemical industry, industry structure, product structure, production volume, dynamics, regional structure
Short address: https://sciup.org/140260479
IDR: 140260479 | UDC: 911.3:
Text of the scientific article The role and geographical features of the chemical industry in the development of the economy of Uzbekistan
Introduction. In studying the geographical features of the chemical industry, it is important to determine its role in the development of the national economy, the study of industries and regional composition. Because industries are the result of the division of social labor, they embody the forms of social organization of production, such as concentration, specialization, cooperation and combination [8, 9]. In addition, it is in the system of industries that the chemical industry provides an opportunity to introduce new technologies for production and to combine modern scientific and technical achievements with practice. In this regard, the President of the Republic of Uzbekistan Shavkat Mirziyoyev in his “Address to the Oliy Majlis for 2021” dated December 30, 2020, paid special attention to the role of industrial food in the development of the economy. In particular, “... there are all necessary conditions for the petrochemical, metallurgy, mechanical engineering, electrical engineering, pharmaceuticals, construction materials, textiles, leather and footwear, food and industries related to the “green economy” to become “drivers” of our economy. All measures should take to support private sector initiatives and new projects in these sectors, as well as to develop cooperation” [1]. From the above, it is clear that on the present time in the development of the economy of the republic is one of the urgent tasks to study the role and geographical features of key industries, in particular, the chemical industry.
The main part. The chemical industry of Uzbekistan formed in the process of industrialization of the former Soviet Union. At present, the share of this sector in the country's total industry is 7.7 percent and its share in GDP is very small, 0.6 percent, and focused on the production of more nitrogen, phosphorus and potassium fertilizers. For comparison, this sector is 5.8 percent in Germany and 0.2 percent in Kazakhstan [4, 13]. In addition, the chemical industry of Uzbekistan represented by segments of mining and chemical, petrochemical, chemical products, inorganic, organic and household chemicals [4].
Extensive use of the achievements of the chemical industry in the economy is one of the important areas of scientific and technological development. It provides other branches of the chemical industry, construction, transportation and other industries with new, highly efficient materials. It has a positive impact on its intensive development through the supply of mineral fertilizers to agriculture. Produces consumer goods for the population. This multifaceted and advanced industry, which is one of the modern industries, is in line with the fuel and energy and machinery industries in terms of the process and importance of improving the material and technical base of the economy and is therefore included in the top three industries [3, 5, 6, 9, 10, 11].
In the development of the economy, the chemical industry also distinguished by the following advantages and peculiarities. In particular, it has an unlimited and extremely diverse raw material base, including the conversion of mineral raw materials (phosphate and potassium fertilizers), mineral fuels (oil and gas, coal), agricultural raw materials, water, air and other industries into industrial products. Increase in the number of new types of chemical raw materials and industrial products, production of cheaper ones instead of previously expensive ones, integrated use of raw materials and production wastes, increase in the range of products [3, 9, 10, 11].
The development of the chemical industry in the economy of Uzbekistan is closely linked with the extraction and processing of hydrocarbons, production of mineral fertilizers, pharmaceuticals, paints, chemical protection of agricultural crops, further increase in production of plastics, man-made linked fibers and other chemical materials [4, 3, 9, 10]. The chemical industry also characterized by the complexity of its branches and regional structure. It has many specialized enterprises in the country, and they are different in terms of raw materials, product production, but similar in terms of production technology [3, 9, 10, 11].
Due to the important role of the chemical industry in the development of the economy of the republic, in a historically short period of time sinces independence, significant changes have taken place in this sector. These changes also seen by observing and comparing the dynamics of the volume of products created in the network in 2000-2019 y. (Fig. 1).
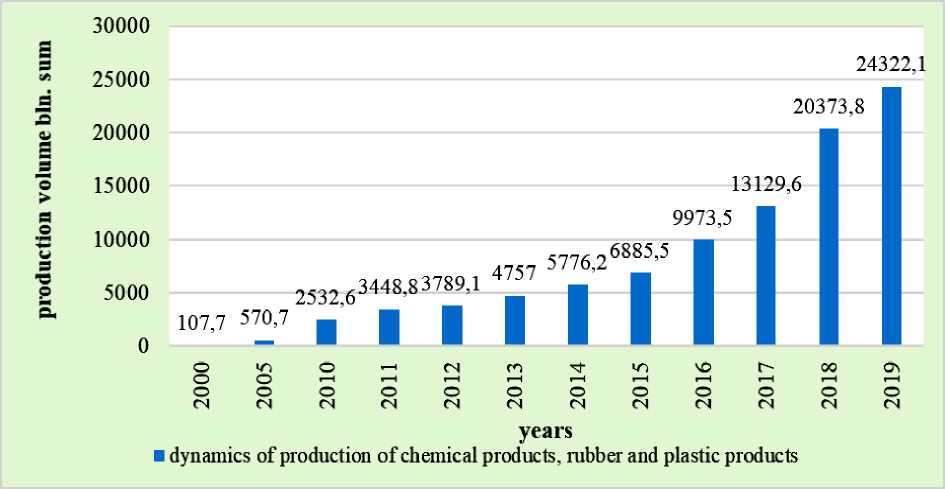
Figure 1.1. Volume of products created in the chemical industry of Uzbekistan (in billion soums)
Source: author’s work based on the collected data [12, 13, 14]
According to observations, the chemical industry produced goods worth 107.7 billion soums in 2000, and as of January 1, 2020 of the 24322.1 billion soums (from the first years of independence to 2016). Until recently, this industry was called the chemical and petrochemical industry in the country and played a special role in the chemical industry. In recent years and now the industry is called the industry of chemical products and rubber plastics) [12, 13, 14]. If we compare 2000 with 2019, the volume of production in the chemical industry has increased 225 times over the past 20 years, or an average of 4783.3 billion soums per year. The main reason for this can be explained by the fact that the reforms in the chemical industry of the economy are well underway. At present, its share among industries is 7.5%. If we compare it with 2000 (which was 5.4 percent), we can see that its share has increased slightly.
In terms of technical and economic characteristics of the chemical industry in Uzbekistan, the "lower" floor industries are well developed.
Therefore, given the predominance of these industries, special attention should be paid to hydrocarbon raw materials used as a source of primary products. This is because in the future, as oil and gas shortages increase and the price attractiveness of alternative energy sources and raw materials improves, they may lose their crucial importance [7].
According to the data, currently Uzbekistan produces more than 750 types of chemical products, 15 of which are the main types of chemical products [10, 13, 14]. This can also be seen by analyzing the data given in Figure 2 below (see Figure 2). As shown in Figure 2, in 2010 in the country 1134.5 thousand tons of mineral fertilizers, 1343.9 thousand tons of synthetic ammonia, 1192.6 thousand tons of sulfuric acid, 24.6 thousand tons of chemical fibers and yarns, 18.9 thousand tons cyanide sodium, 129.2 thousand tons of polyethylene, 80.5 thousand tons of paints and varnishes, 90.4 thousand tons of soda ash, 23.1 thousand tons of caustic soda, 3953 thousand tons of cellulose and its chemical products in primary forms not included in other groups, 8.0 thousand tons of synthetic detergents, etc., and by 2019, 1216.9 thousand tons of mineral fertilizers, 1358.9 thousand tons of synthetic ammonia, 1565.5 thousand tons of sulfuric acid, 19.4 thousand tons of chemical fibers and yarns, 32.5 thousand tons of cyanide sodium, 499.9 thousand tons of polyethylene, 85.5 thousand tons of paints and varnishes, 188.2 thousand tons of soda ash, 22.1 thousand tons of caustic soda, 65.5 thousand tons of synthetic detergents and other similar products were produced [12, 13].
However, it should be noted that the production of cellulose and its chemical derivatives in primary forms, which are not included in other groups in the chemical industry, fell in the period after 2010 (3953 thousand tons), especially in 2019 (268.2 thousand tons). On the contrary, new industries have been set up, such as the production of polypropylene in primary forms, synthetic detergents, sheets, sheets, films, paper and tapes from plastics, and the production of products in these industries has increased.
|
4000 3500 г зооо 0 н 2500 я 5 2000 ей § 1500 Я р 1000 500 0 |
||||||
|
--—-- |
___-■ - |
|||||
|
— |
c=“*--- |
-4-— |
—a |
|||
|
2010 y. |
—^= 2015 y. |
2016 y. |
2017 y. |
2018 y. |
2019 y. |
|
|
♦ Sulfuric acid |
1192,6 |
1505,7 |
1518,1 |
1419,9 |
1530,2 |
1565,5 |
|
И Synthetic ammonia |
1343,9 |
1369,9 |
1386,9 |
1290,1 |
1275,8 |
1358,9 |
|
* Mineral fertilizers |
1134,5 |
1234,4 |
1225,7 |
1141,9 |
1170,8 |
1216,9 |
|
Chemical fibers and yams |
24,6 |
17,5 |
15,4 |
8,3 |
11,4 |
19,9 |
|
Ж Cyanide sodium |
18,9 |
26,7 |
28 |
27,8 |
28,1 |
32,5 |
|
-•- Polyethylene |
129,2 |
178,4 |
465,3 |
521 |
499,3 |
499,9 |
|
l Polypropylene in primary forms |
0 |
9,9 |
77,1 |
94,2 |
93,2 |
95,5 |
|
Varnish and paint products |
80,5 |
72,1 |
64,7 |
67,4 |
79,1 |
85,3 |
|
Calcined soda |
90,4 |
88,3 |
124,9 |
172,2 |
188,6 |
188,2 |
|
♦ Caustic soda |
23,1 |
20,3 |
36,4 |
21,4 |
15,1 |
22,5 |
|
И Cellulose in its primary forms not included in other groups and its chemical derivatives |
3953 |
1465,1 |
1782,5 |
1720,6 |
381,4 |
268,2 |
|
A Synthetic detergents |
8 |
63 |
55,8 |
48,7 |
57,1 |
65,7 |
|
ж Technical salt |
350,3 |
451,6 |
598,5 |
253,3 |
300,7 |
281,8 |
|
Ж Plates, sheets, films, paper and tapes from plastics |
0 |
19,3 |
27 |
29,1 |
33,4 |
28,4 |
|
Hydrochloric acid |
34 |
43,1 |
40,1 |
27,4 |
27,6 |
50,6 |
Figure 2. The structure of production of the main types of chemical industry in Uzbekistan in 2010-2019 (in thousands of tons)
Source: based on materials collected by the author [12, 13]
It can be seen from the data that in recent years the structure of the chemical industry of Uzbekistan has undergone significant changes and shifts, and the focus on the development of "middle" and "upper" floors is growing.
It is known that the volume of products created in the chemical industry and its changes are influenced by chemical products produced in the territorial units of the republic. This can also be seen by observing changes in the volume of production of chemical products and the share of regions created in the territorial units (see Table 1).
Table 1
Territorial structure of chemical industry production in the Republic of Uzbekistan (in billions of soums and percent)
|
Regions |
Years |
||||
|
2000 |
2005 |
2010 |
2015 |
2020* |
|
|
Republic of Uzbekistan |
107,7 |
570,7 |
2532,6 |
6885,5 |
20923,2 |
|
100,0 |
100,0 |
100,0 |
100,0 |
100,0 |
|
|
The Republic of Karakalpakstan |
0,4 |
0,4 |
35,8 |
343,2 |
7 290,6 |
|
0,3 |
0,3 |
1,4 |
5,0 |
34,8 |
|
|
Provinces |
|||||
|
Andijon |
5,2 |
37,1 |
115,3 |
208,6 |
524,1 |
|
4,8 |
6,5 |
4,5 |
3,0 |
2,5 |
|
|
Buxoro |
0,04 |
0,5 |
11,0 |
135,2 |
236,6 |
|
0,03 |
0,08 |
0,4 |
2,0 |
1,1 |
|
|
Jizzax |
1,33 |
5,2 |
14,6 |
36,2 |
22,3 |
|
1,2 |
0,9 |
0,6 |
0,5 |
0,1 |
|
|
Kashkadarya |
0,06 |
1,0 |
546,4 |
1179,6 |
2922,1 |
|
0,05 |
0,2 |
21,4 |
17,1 |
14,0 |
|
|
Navoi |
27,0 |
164,1 |
315,2 |
658,8 |
2128,6 |
|
25,0 |
28,7 |
12,4 |
9,6 |
10,2 |
|
|
Namangan |
0,9 |
2,3 |
28,9 |
66,0 |
201,3 |
|
0,8 |
0,4 |
1,1 |
0,9 |
1,0 |
|
|
Samarkand |
3,0 |
3,7 |
45,4 |
190,6 |
170,7 |
|
2,8 |
0,6 |
1,8 |
2,8 |
0,8 |
|
|
Surxondaryo |
0,03 |
0,07 |
0,6 |
8,3 |
28,1 |
|
0,02 |
0,01 |
0,02 |
0,1 |
0,1 |
|
|
Sirdaryo |
- |
0,1 |
6,2 |
33,6 |
46,8 |
|
0,0 |
0,01 |
0,2 |
0,5 |
0,2 |
|
|
Tashkent |
28,6 |
162,3 |
451,6 |
1249,6 |
3294,3 |
|
26,5 |
28,4 |
18,0 |
18,1 |
15,7 |
|
|
Fergana |
14,1 |
104,2 |
301,6 |
750,9 |
2122,0 |
|
13,1 |
18,2 |
12,0 |
11,0 |
10,1 |
|
|
Khorezm |
0,3 |
1,5 |
4,0 |
20,5 |
45,6 |
|
0,3 |
0,3 |
0,2 |
0,3 |
0,2 |
|
|
Tashkent city |
27,1 |
88,2 |
656,0 |
2004,3 |
1890,1 |
|
25,1 |
15,4 |
26,0 |
29,1 |
9,0 |
|
Karakalpakstan was 0.3%, the territorial share of Kashkadarya region was 0.05%, today their share is 34.8% and 14.0%, respectively. The growth of the chemical industry in the regions was due to the discovery of new local deposits and their use as raw materials for the chemical industry, the launch of large chemical industry enterprises (The largest projects1 of the chemical industry in recent years are the Kungrad soda ash plant in 2006 and the Dehkanabad potassium fertilizer plant in 2010) on the basis of foreign investment [5, 6]. However, the share of the city of Tashkent (launched in the former Soviet Union) and the regional share of Tashkent, Fergana and Navoi regions has decreased over the past 20 years (although the volume of chemical industry production has increased from year to year) [12, 13, 14].
In 2000, these regions produced 90% of the country's total chemical products, but today their share is 9.0% in Tashkent, 15.7% in Tashkent, 10.1% in Fergana and 10.1% in Navoi. The republic produces 44.9% of the total chemical industry. The territorial share of other regions is very low, including 2.5% in Andijan region, 1.2% in Jizzakh region, 1.0% in Namangan region, 0.8% in Samarkand region, 0.2% in Syrdarya and Khorezm regions, and Surkhandarya region. The production of chemical products accounts for 0.1 percent [12, 13, 14].
Conclusion. From the study of the above data, it can be concluded that the chemical industry has a special role in the development of the economy of the republic in recent years. This is because the reforms carried out in this industry have led to changes in the sectoral and regional structure in recent years. Such changes were directly influenced by the following geographical factors:
-
1. Proper implementation of regional industrial and investment policies aimed at preventing territorial inequalities in the country in recent years;
-
2. Identification of new local deposits and development of raw materials;
-
3. It is necessary to emphasize the commissioning of large chemical facilities on the basis of raw materials, modernization and diversification of existing chemical industries, and so on.
References The role and geographical features of the chemical industry in the development of the economy of Uzbekistan
- Ўзбекистон Республикаси Президенти Шавкат Мирзиёевнинг 2020 йил, 30 декабрдаги “2021 йилга бағишланган Олий Мажлисга Мурожаатномаси”. https://review.uz/oz/post/poslanie-prezidenta-uzbekistana-shavkata-mirziyoyeva-oliy-majlisu.
- Аbdinazarova X.O. Geographic approach to the development of the network of chemical industry of Uzbekistan // Россия. Электронное научно-практическое периодическое издание. «Экономика и социум». – 2020. № 9 (76). – С. 3-7. http://www.iupr.ru.
- Асанов Г., Набихонов М., Сафаров И. Ўзбекистоннинг иқтисодий ва ижтимоий жўғрофияси. Ўқув қўлланма – Т: Ўқитувчи, 1994. – 82-85 б.
- “Ўзбекистон Республикасининг 2035 йилгача ривожланиш стратегияси” концепцияси. Муҳокама учун материаллар. 2018 йил, 171-177 б.
- Komilova N.K., Abdinazarova Kh.O. Some theoretical aspects of the development of the chemical industry. European Science Review Austria Vienna 2019 January–February. –Р. 25-27.
- Komilova N.K., Hudayberganova R.T., Murtazaev I.B., Abdinazarova H.O., Madaminov Z.H. Economic and Geographic Problems of Improvement of Industrial Sectors and Local Structure of Uzbekistan. Journal of Advanced Research in Law and Economics ASERS Quarterly Volume X Fall 2019. Issue 6 (44). –P 1922.
- Сокольский В.М. Отрасль промышленности как объект экономико-географического исследования (на примере химической индустрии) // Известия РАН. Сер. географияеская. – 2011. – № 2. – С. 25-39.
- Солиев А.С. Иқтисодий география: назария, методика ва амалиёт. (Танланган асарлар). Монография. Тошкент, 2013. – 243 бет.
- Солиев А. Ўзбекистон географияси (Ўзбекистон иқтисодий ва ижтимоий географияси). Ўқув қўлланма - Т: Унивеситет, 2014. – 48-50 б.
- Тўхлиев Н. ва бошқалар. Ўзбекистон иқтисодиёти асослари. – Т.: Ўзбекистон миллий энциклопедияси, 1998. – 46-50 б.
- Хрущев А.Т. География промышленности СССР. Учебник – М: Высшая школа, 1990. – С. 147-161.
- O’zbekiston Respublikasi Davlat Statistika Qo’mitasi. Yillik statistik to’plami – 2010-2018. Toshkent. 2019. – 124 b.
- O’zbekiston Respublikasi Davlat Statistika Qo’mitasi. Yillik statistik to’plami. Toshkent. 2020. – 92 b.
- O’zbekiston Respublikasi Davlat Statistika Qo’mitasi. O’zbekiston sanoati. Yillik to’plami. Toshkent. 2020. – 22-25 b.
