The Role of Artificial Intelligence in the Career Expectations of Ukrainian Students: Implications for Higher Education

Author: Olena Semenikhina, Marina Drushlyak
Journal: International Journal of Information Technology and Computer Science @ijitcs
Article in issue: 2 Vol. 18, 2026.
Free access
The article presents the results of an empirical study on the attitudes of students at Ukrainian higher education institutions toward the role of artificial intelligence (AI), particularly ChatGPT, in the context of their future professional careers. The aim of this study is to determine whether students perceive ChatGPT (a generative AI tool) as a threat, an opportunity, or a multidimensional phenomenon that requires critical evaluation. The research methodology included the construction of two composite indices. These were the ChatGPT Opportunities Index and the ChatGPT Threats Index, both related to career development. The indices were based on responses from 354 students. All participants took part in the international "Global ChatGPT Student Survey". Data analysis employed descriptive statistics, analysis of variance (ANOVA), correlation analysis, clustering, and the χ² test. The results showed that the ChatGPT Opportunities Index was moderately higher than the ChatGPT Threats Index. This indicates a predominantly cautious optimism in students’ attitudes toward AI. At the same time, statistical analysis did not reveal any significant relationships between these indices and such variables as level of education, gender, or confidence in future employment. Cluster analysis identified three types of student attitudes: Realists, Reflective Optimists, and Disengaged. A synthesis of the results indicates that students show both interest in ChatGPT and a need for support from educational institutions in developing critical interaction skills with intelligent technologies. The study concludes that there is a need to integrate AI literacy into academic programs. It also highlights the importance of developing interdisciplinary training models and implementing educational interventions that foster adaptability and digital resilience among students.
Artificial Intelligence, ChatGPT, Students, Perception, Employment, Digital Literacy, Career Readiness, Educational Analytics, Index Analysis, Clustering
Short address: https://sciup.org/15020275
IDR: 15020275 | DOI: 10.5815/ijitcs.2026.02.02
Text of the scientific article The Role of Artificial Intelligence in the Career Expectations of Ukrainian Students: Implications for Higher Education
Artificial intelligence (AI) is rapidly transforming the structure of the labor market [1]. This shift prompts a rethinking not only of the skills required for employment but also of broader concepts such as career development and professional identity. The growing accessibility of generative AI tools, such as ChatGPT, brings both new opportunities and additional risks for students. On the one hand, these technologies support personalized learning, boost productivity [2], and foster analytical reasoning. On the other hand, they pose challenges such as potential job displacement [3], increased risks of academic dishonesty, and the replacement of creative and cognitive processes by machines [4].
In this context, a key question is gaining increasing relevance: How do students themselves view AI in relation to their professional future - as an opportunity or as a threat? Findings show that most students across different countries tend to perceive AI primarily as a tool for enhancing their own competitiveness [5-7]. At the same time, they also express concerns about the potential impact of AI on the stability of their career trajectories [8; 9].
According to international surveys, students actively acknowledge the potential of AI for career development [10].
They show a strong interest in learning how to use it effectively [11]. Those with more experience using such tools tend to exhibit higher levels of confidence in their future [12; 13]. The findings by Wut et al. [6] identified a direct relationship between AI literacy and perceived internal and external employability. Similar findings have been reported in studies conducted in South Asia [14], Eastern Europe [15], and the Middle East [16].
However, other findings point to ambivalence in how students perceive AI. This is especially evident in regions where levels of digital literacy are uneven and the labor market is unstable [9; 17]. In addition, Giunta [18] reports that although most students are aware of the transformative potential of AI, a significant number lack access to systematic education on this topic. This is further supported by research highlighting gaps in universities’ readiness to adapt their academic programs to emerging realities [19; 20].
Given the rapid spread of AI across all areas of human activity, it is critically important to study not only students’ actual skills but also their perceptions, expectations, and concerns related to these technologies. As Frank et al. [21] emphasize, attitudes toward technology have become one of the key factors in determining adaptability to changes in the labor market.
Despite the wide availability of similar findings in the global context, the Ukrainian perspective remains underexplored. Given the current martial law, economic turbulence, and transformations in higher education, it is particularly important to understand how Ukrainian students envision their professional future amid AI development. It is essential to identify the expectations they form and the educational strategies that can enhance their confidence and readiness for change.
Research aim : to investigate how students at Ukrainian higher education institutions perceive the role of ChatGPT in their professional future; whether AI is seen as an opportunity, a threat, or a multidimensional challenge. Additionally, it explores the relationship between these perceptions and variables such as education level, gender, and career confidence.
The research questions are the following.
RQ1. How can indices of perceived opportunities and threats of ChatGPT among students be constructed based on survey data?
RQ2. What is the relationship between the constructed indices and students’ education level, gender, and confidence in future employment?
RQ3. What typologies of students’ perceptions of ChatGPT can be identified through cluster analysis?
2. Materials and Methods
The study is based on empirical data collected within the international project “Students’ Perception of ChatGPT”, organized by the Faculty of Public Administration at the University of Ljubljana, Slovenia. The project involved collaboration with over 200 academic partners. Its overall aim is to identify students’ attitudes toward the use of generative AI, particularly ChatGPT, in the contexts of education, self-development, and professional activities.
-
2.1. Questionnaire
-
2.2. Participants
The questionnaire consisted of 42 questions organized into 11 thematic blocks. It covered various aspects, including general information about the respondents (Section 1). Experience with AI usage was addressed in Sections 2 and 3. Ethical and regulatory aspects were covered in Section 4. Sections 5 and 6 focused on satisfaction, attitudes, and expectations. Skills, the labor market, and emotional perceptions were explored in Sections 7 to 9. Finally, Sections 10 and 11 addressed personal characteristics and general considerations.
The study used responses from students of Ukrainian higher education institutions. Data were collected in English. Because the questionnaire was administered in English to a predominantly non-native English-speaking population, measurement-language bias cannot be ruled out. We did not conduct a formal translation/back-translation procedure or validation checks for the Ukrainian subsample. Therefore, differential item interpretation due to language proficiency may have introduced additional measurement error and could have attenuated observed associations. The response format included a Likert scale, ranging from 1 (strongly disagree) to 5 (strongly agree). Ordinal scales were also used to measure confidence and frequency of use. For example, Question 12 asked: “Do you feel confident about getting a job after you complete your studies?” with answers ranging from 1 (not at all confident) to 5 (extremely confident). Categorical variables such as gender, education level, and citizenship were also collected.
A total of 560 questionnaires were collected. Among them, 354 were complete regarding the key variables needed to construct the composite indices. A data completeness criterion was applied. Respondents with any missing (unanswered) items in the selected questions were excluded from the quantitative analysis.
The sample’s gender and education distribution were as follows: 64.4% female and 35.6% male. In the cleaned Ukrainian subset used for analysis, there were no responses in the “Other” and “Prefer not to say” categories. Therefore, gender-based analyses in this paper compare only the two observed groups (female and male). Regarding education levels, 52% were bachelor’s students, 41% master’s students, and 7% doctoral students. Respondents’ ages ranged from
18 to 35 years, with the majority falling within the 18–22 age group.
The analyzed dataset is a voluntary, self-selected convenience sample from an online survey. Respondents reported their current higher education institution (self-report). Because wartime displacement and institutional relocation are common, institutional affiliation cannot be used as a reliable proxy for respondents’ geographic location. In the cleaned Ukrainian subset, responses are concentrated in a small number of institutions (e.g., IFNMU 58.0%, SSPU 19.7%, Kherson State University 17.5%, Borys Grinchenko Kyiv Metropolitan University 4.2%), which reflects recruitment channels and limits external validity. The field of study was not collected in the survey; therefore, disciplinary representativeness cannot be assessed. The results are interpreted as exploratory and should not be considered nationally representative estimates.
The initial dataset contained 560 responses. For the purposes of this study, we restricted the data to Ukrainian respondents and to the survey items used in the present analyses. We then applied listwise deletion for the focal items, excluding any record with missing values in the selected variables from the analytical sample. This screening yielded 354 complete cases, which were used in all subsequent analyses.
To increase the reliability of the cleaning procedure, two authors independently performed the screening in spreadsheet software (manual deletion of empty cells/records according to the same prespecified exclusion rules) and subsequently cross-checked the resulting cleaned file. Any discrepancies were resolved by reconciliation, and the final analytical dataset was agreed upon by both authors.
The raw survey dataset is publicly available via Mendeley Data (see [22]). To support reproducibility, we provide a companion repository containing the final cleaned Ukrainian analytical subset used in this study (N = 354) together with a short text file documenting the pre-processing steps (item selection, filtering to Ukrainian respondents, and complete-case exclusion criteria) and the raw dataset version .
-
2.3. Ethical approval
-
2.4. Analytical Strategy
To analyze students’ perceptions of the role of artificial intelligence in future employment, two composite indicators were created: ChatGPT Opportunities Index (Opportunity Index) and ChatGPT Threats Index (Threat Index). These indices were constructed based on respondents’ answers to questions from Section 8, “Labour Market and Skills Mismatch” of the international Global ChatGPT Student Survey (2024).
All research procedures involving human participants complied with ethical standards and the provisions of the Ethical Guidelines for Educational Research [23].
Opportunity Index was calculated as the arithmetic mean of the following items:
-
• Q30e “ChatGPT will increase the demand for employees with AI-related skills”;
-
• Q30j “ChatGPT will reduce employee workload”;
-
• Q30k “ChatGPT will improve employee productivity”;
-
• Q30l “ChatGPT will improve employee innovation”;
-
• Q31a “ChatGPT can reduce skills shortages (when employers cannot find enough students/workers with the right qualifications and skills)”;
-
• Q31b “ChatGPT can reduce under-skilling (when students/workers have skills below those required for the job)”;
-
• Q31c “ChatGPT can resolve skills obsolescence (when students/workers lose their skills over time due to lack of use or when skills become irrelevant due to changes in the world of work)”;
-
• Q31d “ChatGPT can reduce skills gaps (when students/workers lack the skills necessary to do their job effectively)”.
Threat Index was calculated as the arithmetic mean of three items:
-
• Q30a “ChatGPT will reduce the number of jobs”;
-
• Q30f “ChatGPT will increase inequality between younger and older employees”;
-
• Q30h “ChatGPT will change the nature of jobs”.
To provide an initial assessment of measurement quality, we examined internal consistency of both indices using Cronbach’s alpha on the final analytical sample (N = 354). The Opportunity Index demonstrated good reliability (α = 0.851). The Threat Index showed moderate reliability for a short 3-item scale (α = 0.665; mean inter-item correlation r̄ = 0.399). We also inspected the dimensionality of the Opportunity Index items. The first component of the item correlation matrix had an eigenvalue of 3.93, explaining 49.1% of the variance, with all items loading in a comparable range (|loading| = 0.31–0.38), indicating a dominant common dimension. These checks are reported as preliminary evidence of consistency and structure; they do not replace a full construct validation of the indices.
Additionally, responses to the following items were considered to test the hypotheses:
Q12 “Do you feel confident about getting a job after you complete your studies?” (a scale ranging from 1 (not at all confident) to 5 (extremely confident);
Q8 “What level of study are you enrolled in?” (1 – Undergraduate Certificate/Diploma/Bachelor's degree (1st level), 2 – Postgraduate Certificate/Diploma/Master's degree (2nd level), 3 – Doctoral degree (3rd level));
Q2 “What is your gender?” (1 – Male, 2 – Female, 3 – Other, 4 – Prefer not to say).
Cluster membership was determined based on grouped values of the Opportunity and Threat indices. The K-means method was used for clustering [24].
The interpretation of results was based on a 5-point Likert scale (1 – Strongly Disagree, 2 – Disagree, 3 – Neutral, 4 – Agree, 5 – Strongly Agree). The higher the index, the more strongly respondents tended to perceive AI as either an opportunity or a threat.
2.5. Statistical Methods
3. Results
3.1. Key Quantitative Findings
We first report descriptive statistics for the Opportunity and Threat indices. Group comparisons were conducted by gender (Q2) and education level (Q8). Associations between employment confidence (Q12) and both indices were examined using Spearman’s rank correlation. Education-level differences were tested with one-way ANOVA; in addition to p-values, we report effect sizes (η²/ω² for ANOVA; Cramer’s V for χ²) and, where applicable, 95% confidence intervals.
The Opportunity and Threat indices were computed as means of multiple Likert-type items. While single Likert items are ordinal, aggregated multi-item indices are commonly treated as approximately continuous for group comparisons; therefore, we report one-way ANOVA as the primary analysis. To reduce sensitivity to distributional assumptions, we additionally conducted robustness checks using Welch’s ANOVA and the nonparametric Kruskal– Wallis test; the substantive conclusions remained unchanged.
For clustering, we applied K-means to the two-dimensional space defined by the Opportunity and Threat indices. Prior to clustering, both indices were standardized (z-scores) to ensure equal weighting in Euclidean space. The number of clusters (k) was selected using the elbow method and supported by an internal validity check (average silhouette coefficient = 0.41 for k = 3). K-means was fitted with multiple random initializations (n_init = 50) and a fixed random_state to support reproducibility; for reporting, clusters were ordered by their mean Opportunity Index (from low to high), and labels were assigned accordingly.
Missing values in the focal items were handled via complete-case analysis (listwise deletion). Because exclusions were performed during manual screening and excluded records were not retained as a separate file, we could not test the missingness mechanism; therefore, results should be interpreted as exploratory and potentially subject to selection bias.
Table 1 presents descriptive statistics for two composite indices used to assess students’ perceptions of AI as either an opportunity or a threat to their future employment. The Opportunity Index reflects the potential benefits of AI for career development. In contrast, the Threat Index represents concerns about AI’s negative impact.
Table 1. Descriptive statistics of the ChatGPT opportunity and threat indices related to student employment
|
Indicator |
Opportunity Index |
Threat Index |
|
Number of Observations (N) |
354 |
354 |
|
Mean |
3.31 |
3.14 |
|
Standard Deviation |
0.59 |
0.73 |
|
Minimum |
1.00 |
1.00 |
|
25th Percentile |
3.00 |
2.67 |
|
Median (50th Percentile) |
3.38 |
3.33 |
|
75th Percentile |
3.75 |
3.67 |
|
Maximum |
5.00 |
5.00 |
The results show that the mean of the Opportunity Index is 3.31. This indicates a generally positive student attitude toward the impact of AI on their career prospects. The Opportunity Index has a moderate dispersion, with a standard deviation of 0.59. This suggests relative homogeneity in the responses. In contrast, the Threat Index has a lower mean of 3.14 and higher variability, with a standard deviation of 0.73. This reflects more polarized student views regarding the risks associated with AI. The minimum for both indices is 1, corresponding to "Strongly disagree". The maximum is 5, indicating the presence of both critical and enthusiastic perceptions of AI’s role among individual students.
Table 2 illustrates the relationship between students’ confidence in obtaining employment after graduation (Question Q12) and the means of the Opportunity Index and Threat Index. These indices reflect the perceived potential impact of AI, particularly ChatGPT, on their careers. The confidence rating ranges from 1 (not at all confident) to 5
(extremely confident).
Table 2. Relationship between ChatGPT opportunity and threat indices and confidence in employment (Q12)
|
Confidence level in employment (Q12) |
Mean Opportunity Index |
Mean Threat Index |
|
1 – Not at all confident |
3.28 |
3.19 |
|
2 – Slightly confident |
3.26 |
3.14 |
|
3 – Moderately confident |
3.31 |
3.16 |
|
4 – Very confident |
3.41 |
3.16 |
|
5 – Extremely confident |
3.13 |
2.91 |
The data show a general trend of increasing Opportunity Index values with higher confidence levels in employment. The Opportunity Index rises from 3.28 at confidence level 1 to 3.41 at level 4. This suggests that students with greater confidence in their future tend to see more positive opportunities in AI. In contrast, the Threat Index exhibits the opposite pattern. It decreases from 3.19 to 2.91, indicating that less confident students are more likely to perceive ChatGPT as a potential threat.
These results descriptively suggest a relationship between overall career optimism and a positive evaluation of AI’s role. Such a relationship may highlight the importance of fostering confidence and professional self-esteem within the educational environment. To test whether employment confidence (Q12) was associated with perceived AI impacts, Spearman’s rank correlations were computed. The association between Q12 and the Opportunity Index was negligible (ρ = 0.02, p = 0.68; 95% CI [-0.08, 0.13]). The association between Q12 and the Threat Index was also negligible (ρ = -0.03, p = 0.53; 95% CI [-0.13, 0.08]). Thus, the data do not provide statistical evidence of a monotonic relationship between career confidence and either index in this sample. In other words, at the sample level, there is no confirmed correlation between students’ confidence in employment and their perception of AI as either a threat or an opportunity.
Table 3 presents the mean of the ChatGPT Opportunity Index and Threat Index for career perceptions. These means are calculated based on two criteria: students’ education level (bachelor’s, master’s, doctoral) and respondents’ gender (female, male). This allows for the identification of differences in the perception of AI’s role depending on educational and gender contexts.
Table 3. ChatGPT opportunity index and threat index by education level*
|
Context |
Mean Opportunity Index |
Mean Threat Index |
|
Bachelor's degree |
3.29 |
3.16 |
|
Master's degree |
3.39 |
3.11 |
|
Doctoral degree |
3.39 |
2.90 |
|
Female |
3.27 |
3.13 |
|
Male |
3.39 |
3.18 |
Note: No responses were recorded in the “Other” and “Prefer not to say” categories in the analytical subset.
Education level shows a slight but consistent increase in the Opportunity Index from bachelor’s to master’s and doctoral students. This may indicate a growing awareness of AI’s potential at higher levels of academic training. The Threat Index is the highest among bachelor’s students and the lowest among doctoral students, suggesting greater skepticism among less experienced students. By gender, male respondents demonstrate a higher mean Opportunity Index (3.39) compared to female respondents (3.27), while the Threat Index is nearly the same for both groups. This may reflect a more optimistic attitude among men toward AI’s impact on their careers. However, potential differences in academic fields should also be taken into account.
Elbow Method for Determining the Optimal Number of Clusters
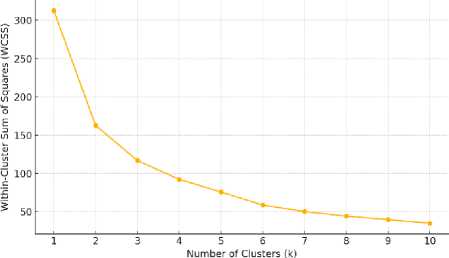
Fig.1. Visualization of clustering using the elbow method
The variations in index values presented in Table 4 served as the basis for further clustering of respondents by types of AI perception. The graph (Fig. 1) shows an inflection point at approximately three clusters. This suggests that dividing the respondents into three perception types is a reasonable approach.
To gain a deeper understanding of how students perceive the impact of AI on careers in the context of future employment, three clusters were identified based on their average evaluations of AI opportunities and threats. Cluster 0 represents the group labeled “Disengaged”, characterized by the lowest mean values on both indices (2.58 for opportunities and 1.99 for threats). Cluster 1 is interpreted as “Realists”, showing moderately balanced scores (3.11 and 3.05), suggesting a cautious yet open stance. Cluster 2 includes students with the highest values on both indices (3.91 and 3.76), and is classified as “Reflective Optimists”, those who perceive substantial potential in AI but simultaneously recognize its risks. This clustering is grounded in the calculated means of the Opportunity and Threat Indices for each group. It reflects three distinct types of perception rather than a simple binary between optimism and pessimism. While Cluster 2 expresses enthusiasm coupled with critical awareness, Cluster 0 signals a low level of engagement or interest in AI as a career factor. Cluster 1, the most moderate group, may represent a transitional or stabilizing perception.
Such a typology allows for a nuanced classification of students’ attitudes toward AI tools like ChatGPT and highlights the diversity of perspectives in the academic community (see Table 5).
Table 5. Student typology based on attitudes toward AI (cluster analysis)
|
Cluster |
Mean Opportunity Index |
Mean Threat Index |
Interpretation |
|
0 |
2.58 |
1.99 |
Disengaged |
|
1 |
3.11 |
3.05 |
Realists |
|
2 |
3.91 |
3.76 |
Reflective Optimists |
Despite the expected differentiation, all three identified clusters appear typologically similar in terms of balanced evaluations. There are no clearly defined optimists or skeptics (Disengaged). The highest Opportunity Index (3.91) is observed in Cluster 2. However, this group also shows a high Threat Index (3.76), indicating an ambivalent attitude among students. They acknowledge the potential of AI, but also recognize the associated risks. Overall, most students demonstrate a realistic or cautiously positive view of AI. They tend to perceive it as a tool that requires critical and thoughtful use.
The graph visualizes the three student clusters on the “Opportunity Index – Threat Index” plane (Fig. 2).
|
Students' Perception of Al; Cluster Distribution |
|||
|
5.0 |
|||
|
ii Cluster 1: Realists ф Cluster 2: Reflective Optimists ф Ф ф Ф ф Ф |
ф |
||
|
4.5 |
|||
|
■ и Ф Ф Ф Ф |
|||
|
4.0 |
■ ■ ФФ ФФФФФФФФФФ |
ф |
|
|
3.5 |
■ ■■ ■ ■ ■ ■ Ф Ф Ф Ф Ф ф Ф Ф Ф |
ф |
|
|
1 |
|||
|
c |
■ ■■■■■■■■■ФФФ ф |
||
|
in |
3.0 |
||
|
< |
2.5 |
оооооооо ■ ■ ■ |
|
|
2.0 |
|||
|
о о о о о о |
|||
|
1.5 |
о о |
||
|
1.0 |
0 О ОО |
1.0 1,5 2.0 2.5 3.0 3.5 4.0 4.5 5.0
Al Opportunities Index
Fig.2. Clusters on the "Opportunity index – threat index" plane
The clusters partially overlap, but a clear distribution pattern is observed. There is a directional shift from low scores on both scales (Cluster 0) to high scores on both scales (Cluster 2). This reflects varying degrees of student engagement in the discussion about the role of AI in employment.
To further interpret the types of student perceptions regarding AI’s impact on careers, the distribution of each of the three clusters was analyzed by gender and education level (Table 6). This helps identify which respondent groups are most represented within each perception type.
Table 6. Cluster distribution by gender (%)
|
Cluster |
Female |
Male |
Bachelor's degree |
Master's degree |
Doctoral degree |
|
0 |
64.0 |
36.0 |
50.0 |
44.0 |
6.0 |
|
1 |
67.4 |
32.6 |
54.3 |
38.0 |
7.6 |
|
2 |
62.8 |
37.2 |
48.8 |
39.7 |
11.6 |
In terms of gender, the dominance of female respondents is consistent across all three clusters. This aligns with the overall structure of the sample. It is worth noting that Cluster 2, which has the highest scores for both opportunities and threats, includes the largest proportion of male respondents (37.2%). This may indicate greater interest in or sensitivity to the topic among male students. Regarding education level, bachelor's students make up the largest share in all clusters. However, Cluster 2 is the most “reflective” one. It is characterized by high values on both the Opportunity Index and the Threat Index. It also has the highest percentage of doctoral students. Regarding education level, bachelor’s students constitute the largest share in all clusters. Descriptively, the high–high cluster contains a slightly larger proportion of doctoral respondents than the other two clusters; however, this pattern should be interpreted cautiously and was not confirmed by subsequent inferential tests (ANOVA and χ²).
To test this hypothesis, a one-way analysis of variance (ANOVA) was conducted. This allowed for the assessment of whether the means of the Opportunity Index and the Threat Index differ depending on students’ level of education (Bachelor’s degree, Master’s degree, Doctoral degree). The results showed that education level did not have a statistically significant effect on either index. To test whether the indices differ by education level, a one-way ANOVA was conducted. Education level did not have a statistically significant effect on the Opportunity Index, F(2, 351) = 0.02, p = 0.979, with a trivial effect size (η² ≈ 0.000; ω² ≈ 0.000). For the Threat Index, the ANOVA was also non-significant, F(2, 351) = 1.63, p = 0.197, with a small effect size (η² = 0.009; ω² = 0.004). These findings indicate that overall perceptions do not differ reliably across educational levels in this sample. A contingency table was constructed for "Cluster × Education level", and a χ² test of independence was performed. Again, the results were statistically nonsignificant: χ²(4, N=354)=2.643 (p=0.6192). The association was small in magnitude (Cramer’s V = 0.061), indicating a negligible relationship between cluster membership and education level. Thus, membership in a cluster with high or low evaluations of AI-related opportunities or threats is not determined by the level of academic training.
Thus, although the descriptive data indicated certain trends (in particular, a higher proportion of doctoral students among participants with a comprehensive view of risks and benefits), no statistical confirmation of this relationship was obtained. This may be explained by both the characteristics of the sample and the complex structure of factors shaping attitudes toward AI.
3.2. Analytical findings
4. Discussion
The data analysis revealed that Ukrainian students mostly demonstrate a realistic and cautious attitude toward the impact of AI on future employment. The mean of the Opportunity Index (3.31) was slightly higher than the mean of the Threat Index (3.14). This indicates a moderate optimism in perceiving ChatGPT and similar tools as technologies that may enhance students’ competitiveness in the labor market. However, the presence of substantial variability (σ=0.73 for the Threat Index) confirms the heterogeneity of responses. It also indicates the presence of potential concerns regarding job displacement or growing inequality.
The initial descriptive analysis revealed a tendency for the Opportunity Index to increase and the Threat Index to decrease with higher levels of students’ confidence in future employment. However, the subsequent correlation analysis (Spearman's coefficient) did not confirm a statistically significant relationship between employment confidence (Q12) and the indices. The values of ρ≈±0.03 and p>0.5 indicate the absence of a systematic monotonic relationship between these variables.
Similarly, although the means of indices indicated a moderately higher perception of opportunities and a lower perception of threats among master's and doctoral students, the results of the ANOVA did not reveal statistically significant differences between educational levels. There were no significant differences for either the Opportunity Index (p=0.4713) or the Threat Index (p=0.3115). Statistical analysis also did not confirm an association between the type of AI perception (cluster membership) and the level of education (χ²=2.643; p=0.6192). This suggests that differences in attitudes toward AI are more likely shaped by individual rather than structural factors.
Cluster analysis enabled the identification of three types of student strategies in perceiving AI. The largest cluster included students with moderate scores on both Opportunity and Threat indices (“Realists”). Another cluster consisted of respondents with high scores on both indices (“Reflective Optimists”). The smallest cluster was characterized by low engagement with both indicators (“Disengaged”).
Thus, the results indicate the presence of a spectrum of student attitudes toward AI. These range from cautious acceptance to conscious ambivalence, with moderate and realistic assessments prevailing. The absence of statistically significant differences across key socio-academic parameters (education, confidence, cluster) suggests a complex, non-hierarchical nature of students’ perceptions of AI. This, in turn, highlights the importance of fostering individual digital culture, critical thinking, and ethical awareness in the course of professional training.
The obtained data indicate a general tendency among students toward a realistic and moderate perception of AI's impact on their careers. This finding aligns with conclusions from several previous studies. For example, Colón-Aguirre and Bright [5] demonstrated that students primarily view AI as a useful tool capable of supporting their professional development rather than as a direct threat to skills and employment. Our results confirm this position: the mean of the Opportunity Index was notably higher than the Threat Index. However, the Threat Index was also non-negligible, indicating an ambivalent attitude.
Cluster analysis enabled the identification of three student groups: Realists, Reflective Optimists, and Disengaged. Unlike the findings of Kerketta [8], where high levels of career optimism and concern were clearly separated, our data indicate a widespread dichotomy of simultaneously recognizing both benefits and risks, especially in the most "reflective" cluster. This approach, in which students do not choose between fear and enthusiasm but acknowledge the complexity and multidimensionality of AI impact, can be seen as a sign of developing digital maturity. This concept is discussed by Giunta [18] and Dahri et al. [25].
The overall absence of significant differences between students of different educational levels or gender suggests that attitudes toward AI are shaped not only by academic experience but rather by personal interaction with digital technologies, the media environment, and professional ambitions. This finding also aligns with the conclusions of Cramarenco et al. [15] and Song [17], who point to the insufficiently structured approaches to AI literacy in higher education. Despite high interest, the actual level of awareness and systematic education on AI remains fragmented. Moreover, student assessments are variable and context-dependent.
It is important to note that a number of findings [7; 12] directly link “AI capital” to increased employment prospects. In our sample, however, this relationship did not reach statistical significance. This may indicate either an insufficient level of AI competencies among students or a limited awareness of AI-related career advantages in the Ukrainian context. These findings highlight the need for targeted institutional support for the development of AI literacy within educational programs. They also emphasize the importance of integrating practical experience with tools such as ChatGPT and other AI apps into professionally oriented courses [25; 26].
In summary, the findings of this study allow for an important conclusion. Ukrainian students’ perception of AI as a factor of career (in)security is multidimensional, yet statistically unstable. This opens up space for further research involving more precise operationalization of key concepts, consideration of AI literacy levels, and the interdisciplinary nature of students’ training. At the same time, today’s youth demonstrate interest in AI, the capacity for critical thinking, and a clear need for targeted support. This underscores the urgency of designing an educational environment that fosters not only the ability to “work with AI” but also to engage with it critically and meaningfully in their professional development.
5. Conclusions
This study examined Ukrainian university students’ perceptions of ChatGPT (as a widely used generative AI tool) in relation to labor-market opportunities and threats as measured by two composite indices. Ukrainian university students primarily perceive ChatGPT as a potential opportunity, while also acknowledging risks associated with its perceived impact on the labor market. The constructed composite ChatGPT Opportunity Index and ChatGPT Threat Index indicate a moderately positive perception. Descriptively, the Opportunity Index tended to be higher than the Threat Index; however, inferential results indicate that associations with key background variables were negligible, and effect sizes were trivial. Therefore, the practical significance of between-group differences is limited in this sample. However, the considerable variability in responses points to heterogeneity in students’ views and highlights the need for a deeper analysis of the underlying factors shaping these perceptions.
The applied statistical tools allowed us to reject the hypotheses about the dependence of AI evaluations on education level, gender, or employment confidence. This suggests that attitudes toward AI are shaped not solely by academic status or personal confidence. More likely, they emerge as a result of a combination of individual experience, informational environment, and access to digital tools. The absence of statistically significant differences between respondent groups on these parameters may also reflect the relative novelty of the AI topic in educational programs. This, in turn, points to a lack of systematic integration of AI literacy into the educational process. In addition, the corresponding effect estimates were close to zero, and their confidence intervals included zero, which further argues against practically meaningful relationships in the present dataset.
Cluster analysis revealed three groups with distinct patterns of perceptions: Realists (characterized by moderate scores on both indices), Reflective Optimists (characterized by high scores on both indices), and Disengaged respondents (characterized by low engagement with both indices). Cluster analysis provided an exploratory segmentation of response patterns, which should be interpreted as descriptive groupings rather than stable population types.
Comparison of the findings with recent international studies leads to another important conclusion: despite the broader challenges of socio-economic instability, Ukrainian students demonstrate adaptability, cautious interest in AI, and a critical understanding of its role in their future careers. However, the lack of systematic support from educational institutions (in the form of courses, training, and career guidance) poses risks of unequal access to AI and the development of related competencies. This calls for targeted pedagogical and policy interventions.
Overall, the findings should be interpreted as exploratory. While the descriptive results highlight how respondents articulate opportunities and threats associated with ChatGPT, the inferential analyses yielded negligible associations and trivial effect sizes, which limit claims about practical significance. Future studies should employ designs that enhance external validity (e.g., broader institutional coverage and probability-informed recruitment, where feasible), include additional background variables (such as field of study and prior experience with AI tools), and implement reproducible preprocessing with retained excluded cases to facilitate missingness diagnostics and sensitivity analyses.
6. Future Research Directions
The results of this study open several avenues for further exploration of how students perceive AI in the context of their professional development.
It would be advisable to expand the sample by including respondents from different types of educational institutions (universities, colleges, technical schools) and academic disciplines (technical, humanities, social sciences, medicine). This would enhance the representativeness of the findings and enable cross-disciplinary comparisons, particularly regarding the influence of academic background on attitudes toward AI.
The use of mixed methods research appears to be a promising direction. Combining quantitative surveys with qualitative interviews, focus groups, or open-ended response analysis would allow for a deeper interpretation of students’ underlying motivations, beliefs, and emotional reactions concerning the impact of AI on their professional trajectories.
It is advisable to expand the range of variables by including students’ level of AI awareness, actual experience using AI tools, types of tasks involving AI, and the degree of readiness for reskilling. This approach would enable more precise modeling of the relationship between AI literacy, career attitudes, and confidence in the future.
A promising direction is to conduct longitudinal studies that would track the dynamics of students’ attitudes toward AI in relation to technological advancements, changes in educational programs, emerging market demands, and the acquisition of practical professional experience.
It is important to complement empirical data with evaluations of the effectiveness of educational interventions, such as courses or training programs aimed at developing AI competencies. Such research could address which learning formats are most effective in reducing anxiety, enhancing confidence, and fostering an ethical culture of interaction with AI.
Overall, future studies should focus on developing evidence-based strategies to prepare students for living and working in an AI-driven economy. These strategies must consider individual, social, and educational factors that influence readiness for adaptation and growth.
7. Limitations
Despite the obtained results, the study has several limitations that should be considered when interpreting the findings.
The sample was formed based on voluntary questionnaire responses from students of Ukrainian higher education institutions. Although the number of complete responses (n=354) is sufficient for basic statistical analysis, the sample is not representative in terms of regions, academic disciplines, or types of institutions. Additionally, it does not provide an even distribution among bachelor’s, master’s, and doctoral students. These factors limit the generalizability of the results to the entire student population of Ukraine.
An additional limitation concerns the handling of missing data. Because complete-case analysis was implemented during manual screening and excluded records were not preserved separately, we could not evaluate whether missingness was systematic; thus, some degree of selection bias may be present.
A further limitation is language-related measurement error. The survey instrument was administered in English without a formal translation/validation process for the Ukrainian subsample, which may affect item comprehension and response comparability. Consequently, the reported relationships should be interpreted cautiously, as true associations may be underestimated.
Due to the use of an already structured international questionnaire (Global ChatGPT Student Survey), it was not possible to include variables related to students’ level of AI awareness, practical experience with AI tools, or the types of tasks in which they applied AI. The absence of such indicators limits the analytical depth in interpreting students’ motivations and cognitive models regarding their attitudes toward AI.
The study excluded responses with incomplete data through listwise deletion, meaning that questionnaires with missing values in any of the selected items for the indices were omitted. This approach may have resulted in a loss of variability and introduced some sample bias, for example, excluding students less inclined to complete lengthy surveys or those less engaged with the topic of AI.
Several types of statistical analyses were employed. These included descriptive statistics, Spearman’s correlation, ANOVA, and cluster analysis. However, all analyses were based on quantitative Likert-scale ratings. This means the study primarily captures general attitudes but does not allow for deeper analysis of underlying motives, meaningmaking processes, or culturally conditioned aspects of AI perception. The absence of qualitative methods (such as interviews or focus groups) limits the understanding of the deeper mechanisms shaping attitudes toward AI.
The study did not examine changes in students’ attitudes toward AI over time. In other words, it has a crosssectional rather than panel or longitudinal design. This limits the ability to draw conclusions about causal relationships between experience, education, and AI evaluations.
Given these limitations, the results should be viewed as an empirical basis for further research. Future studies should focus on in-depth, comparative, and interdisciplinary investigation of young people’s attitudes toward AI in educational and professional contexts.
Author Contributions Statement
Olena Semenikhina – Conceptualization, Methodology, and Supervision: Proposed research ideas, Constructed the overall framework, and supervised project execution; Formal Analysis, Visualization, and Statistical Analysis: Performed in-depth analysis of experimental results, prepared performance charts, and ensured the statistical robustness of the evaluation; Writing – Review and Editing, and Project Management: Reviewed and edited the manuscript.
Drushlyak Marina – Data Curation and Software Implementation: Handled data acquisition, dataset preprocessing, and implementing the research model; Writing – Drafted the initial manuscript, contributed to the literature survey, and documented the technical background of the study; Writing – Review and Editing, and Project Management: Reviewed and edited the manuscript, ensured clarity and coherence, and helped coordinate project milestones and deadlines.
All authors have read and agreed to the published version of the manuscript.
Conflict of Interest Statement
The authors declare no conflicts of interest.
Funding Declaration
The authors received no specific funding for this study.
Data Availability Statement
This study analyzed publicly available datasets. The results obtained and datasets can be found here: , accessed on 22 March 2026.
Ethical Declarations
The authors should declare the following: all research procedures involving human participants complied with ethical standards and the provisions of the Ethical Guidelines for Educational Research by European Educational Research Association (EERA).
Acknowledgments
We sincerely thank the experts for their professional evaluation and valuable recommendations, which have contributed to improving the quality of the experiment and the reliability of its results.
Declaration of Generative AI in Scholarly Writing
During the preparation of this work, the authors used AI in order to translate the manuscript. After using this tool, the authors reviewed and edited the content as needed and take full responsibility for the final version of the publication.
Abbreviations
The following abbreviations are used in this manuscript:
AI - Artificial Intelligence
ANOVA – Analysis of Variance
ChatGPT – Chat Generative Pre-trained Transformer
IFNMU – Ivano-Frankivsk National Medical University
SSPU – Sumy State Pedagogical University named after A. S. Makarenko
