The state and developmental trends of fruit and berry market in the north-western regions of Russia

Author: Selin Mikhail Vasilyevich, Uskov Vladimir Sergeyevich
Journal: Economic and Social Changes: Facts, Trends, Forecast @volnc-esc-en
Section: Branch-wise and regional economy
Article in issue: 2 (20) т.5, 2012.
Free access
The article emphasizes the importance of increased consumption of fruit and berry products to the standards, which are recommended by medicine in order to improve public health. It analyzes the modern developmental trends of fruit and berry market in the North-West Federal District and considers the main directions of this market development that cover the state support and regulation of this market, its pricing and competition progress.
Fruit and berry market, consumption level, supply and demand factors, organizational and economic mechanisms
Short address: https://sciup.org/147223345
IDR: 147223345 | UDC: 634.1(470.2)
Text of the scientific article The state and developmental trends of fruit and berry market in the north-western regions of Russia
Fruit and berry subcomplex is an important factor in providing health care and longevity for the population and in the solution of demographic problems. However, the level of fruit and berry consumption is below medical standards in our country. This fact influences the nourishment of a human organism with vitamins and other regulators of metabolic processes. According to the Scientific Research Institute of Nutrition of the Russian Academy of Medical Sciences, 80 – 90% of the Russians incur a deficiency of vitamin C, 40 – 60% of people have vitamins А, В1, В2, В6level reduced.
Rational nutrition should be improved by the increase in the share of fresh fruit and berries as natural bioactive substances.
Therefore, fruit and berry complex was developed actively in Soviet times. In the period from 1930 till 1960 specialized enterprises with major investments, especially in machinery, were being run up, fruit and berry nursery gardens were being expanded, zonal institutions for the selection and technology of fruit plants were being established. As a result, the area of orchards and berry plantations was being expanded continuously [4]. The multiple measures to promote household and collective gardening in the 1970 – 1980s contributed to those processes.
However, the development of cultivated gardening in the northern regions was hindered by severe climatic conditions. But it was progressed by the development of winter-hardy varieties.
However, there were a few gardening farms in the northern regions. Only 0.2% of the total volume of local fruit and berries are produced by the agricultural organizations located in the North-West Federal District. The main part of fruit and berry production in the northern regions is concentrated in the private plots of the population (table 1) .
Recently there is a reduction of the areas of fruit and berry plantations in most regions of the North-West Federal District, as well as in the whole country (table 2) .
There is a 3-fold reduction of such areas in the Arkhangelsk and Pskov Oblasts. They have been almost halved in the Leningrad Oblast, while this region has remained the largest in the District gardening areas – 9.4 thousand hectares. In 2010 there were large areas of fruit and berry planting in the Kaliningrad Oblast (4.6 thousand hectares), the Pskov Oblast (3.7 thousand hectares) and the Vologda Oblast (3.0 thousand hectares), i.e. in the regions located in the western and southern parts of the District.
The data of All-Russia agricultural census 2006 show the species composition of the northern gardens. Fruit plantations cover two-thirds of them and one third of these areas are berry fields. The Leningrad, Arkhangelsk and Vologda Oblasts have the largest areas of cultivated berry fields in the North-West Federal District. More than a half of berry fields are located here. The prevailing crops include currants, strawberries, raspberries and gooseberries (table 3) .
The amount of berrying and fruiting has been stabilized in most regions of the NorthWest Federal District due to the efforts of gardeners in the land cultivation, the expanded use of fertilizers and the development of new varieties. Moreover, the gross fruit and berry yield in the district increased by 6% in 2010 as compared with 2000 (table 4) .
Table 1. Fruit and berry production pattern in the regions of the North-West Federal District (the share in the total production volume of all types of farms, %) [11]
|
Region |
Agricultural organizations |
Households of the population |
Peasant (farm) households |
|||
|
2005 |
2010 |
2005 |
2010 |
2005 |
2010 |
|
|
Republic of Karelia |
1.2 |
0.3 |
96.7 |
99.4 |
2.1 |
0.3 |
|
Republic of Komi |
0.0 |
0.0 |
100 |
100 |
- |
0.0 |
|
Arkhangelsk Oblast |
- |
0.0 |
100 |
100 |
- |
- |
|
Vologda Oblast |
1.4 |
1.5 |
98.6 |
98.5 |
- |
- |
|
Kaliningrad Oblast |
0.1 |
0.0 |
99.9 |
100 |
- |
0.0 |
|
Leningrad Oblast |
0.4 |
0.1 |
99.6 |
99.9 |
0.0 |
0.0 |
|
Murmansk Oblast |
0.0 |
0.5 |
100 |
99.5 |
0.0 |
- |
|
Novgorod Oblast |
- |
- |
100 |
100 |
- |
- |
|
Pskov Oblast |
3.1 |
1.0 |
96.3 |
99.0 |
0.7 |
- |
|
In the NWFD, on average |
0.8 |
0.2 |
99.1 |
99.8 |
0.1 |
0.0 |
|
For reference: Russian Federation |
20.7 |
15.0 |
78.4 |
82.8 |
0.9 |
2.2 |
Table 2. The area of fruit and berry plantations on the farms of all categories in the regions of the North-West Federal District, thsd. hectares [11]
|
Region |
Year |
2010 to 2000, % |
||||
|
2000 |
2003 |
2005 |
2008 |
2010 |
||
|
Republic of Karelia |
0.5 |
0.6 |
0.7 |
0.7 |
0.7 |
140.0 |
|
Republic of Komi |
0.9 |
0.9 |
0.8 |
0.7 |
0.7 |
77.8 |
|
Arkhangelsk Oblast |
2.6 |
2.4 |
2.2 |
1.8 |
1.7 |
65.4 |
|
Vologda Oblast |
3.6 |
3.3 |
3.1 |
3.0 |
3.0 |
83.3 |
|
Kaliningrad Oblast |
4.2 |
3.9 |
4.5 |
4.4 |
4.6 |
109.5 |
|
Leningrad Oblast |
16.8 |
13,9 |
11.0 |
9.5 |
9.4 |
56.0 |
|
Murmansk Oblast |
0.3 |
0.4 |
0.4 |
0.3 |
0.3 |
100.0 |
|
Novgorod Oblast |
2.7 |
2.3 |
2.1 |
2.0 |
2.0 |
74.1 |
|
Pskov Oblast |
5.3 |
4.6 |
4.2 |
3.8 |
3.7 |
69.8 |
|
In the NWFD, on average |
36.8 |
32.3 |
28.8 |
26.2 |
26.1 |
70.9 |
|
For reference: Russian Federation |
767.4 |
669.7 |
598.0 |
533.1 |
517.7 |
67.5 |
Table 3. The areas of fruit and berry plantations on the farms of all categories in the regions of the NorthWest Federal District (according to the results of All-Russia agricultural census 2006), hectares [3]
|
Region |
Berry fields, total |
Wild strawberries |
Raspberries, blackberries |
Currants |
Gooseberries |
Black chokeberries |
Seabuckthorn |
Other |
|
Leningrad Oblast |
3202.4 |
1345.9 |
654.3 |
581.1 |
238.7 |
264.7 |
74.1 |
43.5 |
|
Arkhangelsk Oblast |
1781.9 |
243.6 |
242.9 |
784.9 |
222.5 |
90.2 |
36.2 |
161.5 |
|
Vologda Oblast |
1286.0 |
296.1 |
204.0 |
402.2 |
147.3 |
140.2 |
55.0 |
41.3 |
|
Republic of Komi |
745.0 |
227.5 |
101.7 |
213.3 |
84.1 |
48.6 |
6.4 |
63.5 |
|
Kaliningrad Oblast |
658.0 |
271.1 |
152.7 |
136.1 |
60.3 |
27.0 |
8.8 |
2.0 |
|
Pskov Oblast |
625.3 |
217.9 |
96.7 |
180.9 |
65.8 |
46.5 |
13.4 |
4.2 |
|
Novgorod Oblast |
524.5 |
207.3 |
78.2 |
125.7 |
50.7 |
46.3 |
12.3 |
4.0 |
|
Republic of Karelia |
456.5 |
179.7 |
58.0 |
106.3 |
46.5 |
46.6 |
6.6 |
12.8 |
|
Murmansk Oblast |
454.0 |
47.1 |
13.7 |
383.1 |
5.5 |
1.0 |
0.1 |
3.5 |
|
Total in the NWFD |
10110.2 |
3197.0 |
1704.8 |
2972.0 |
943.8 |
729.2 |
221.3 |
342.1 |
Thus, there is no stability everywhere. For example, fruit and berry yield, as well as the gardening areas, decreased by 17% in the Vologda Oblast for the period from 2000 to 2010.
However, the main source of fruit and berry delivery to the NWFD consumer market includes their supply by mercantile businesses. The withdrawal of the state monopoly from foreign trade has allowed to increase the volume of imported fruit and berries in the recent years1. According to the Federal State Statistic Service, 90 – 95% of fruit and berries consumption is covered by the imported products in most regions of the North-West Federal District (the share of imported fruit and berries amounts to 62% only in the Kaliningrad Oblast).
Table 4. Gross fruit and berry yield on the farms of all categories in the regions of the North-West Federal District, thsd. tons [11]
|
Region |
Year |
2010 to 2000, % |
||||
|
2000 |
2003 |
2005 |
2008 |
2010 |
||
|
Republic of Karelia |
0.7 |
0.6 |
1.2 |
2.9 |
2.7 |
385,7 |
|
Republic of Komi |
1.7 |
4.6 |
5.3 |
6.1 |
2.7 |
158,8 |
|
Arkhangelsk Oblast |
4.8 |
8.8 |
7.4 |
7.4 |
5.7 |
118,8 |
|
Vologda Oblast |
9.2 |
10.6 |
12.1 |
6.2 |
7.6 |
82.6 |
|
Kaliningrad Oblast |
7.3 |
3.0 |
12.7 |
55.0 |
56.5 |
774.0 |
|
Leningrad Oblast |
82.5 |
37.7 |
71.9 |
47.4 |
53.4 |
64.7 |
|
Murmansk Oblast |
1.8 |
1.1 |
1.0 |
0.5 |
0.6 |
33.3 |
|
Novgorod Oblast |
9.9 |
13.7 |
17.0 |
17.5 |
15.0 |
151.5 |
|
Pskov Oblast |
15.3 |
11.0 |
21.1 |
14.8 |
7.4 |
48.4 |
|
Total in the NWFD |
143.1 |
91.1 |
149.8 |
157.7 |
151.6 |
105.9 |
|
For reference: Russian Federation |
2690.0 |
2444.6 |
2403.8 |
2400.6 |
2148.9 |
79,9 |
Table 5. Annual fruit and berry consumption in the regions of The North-West Federal District, kg per capita [8]
|
Region |
2006 |
2007 |
2008 |
2009 |
2010 |
2010 to 2006, % |
Per capita consumption in 2010, % |
|
|
to minimum rate (80 kg/pers.) |
to optimal rate (120 kg/pers.) |
|||||||
|
Kaliningrad Oblast |
54 |
58 |
65 |
64 |
70 |
129.6 |
87.5 |
58.3 |
|
Vologda Oblast |
57 |
59 |
65 |
61 |
66 |
115.8 |
82.5 |
55.0 |
|
Murmansk Oblast |
51 |
55 |
60 |
60 |
65 |
127.5 |
81.3 |
54.2 |
|
St. Petersburg |
48 |
53 |
59 |
59 |
61 |
127.1 |
76.3 |
50.8 |
|
Arkhangelsk Oblast |
50 |
54 |
59 |
59 |
61 |
122.0 |
76.3 |
50.8 |
|
Novgorod Oblast |
44 |
43 |
53 |
54 |
57 |
129.5 |
71.3 |
47.5 |
|
Leningrad Oblast |
45 |
50 |
53 |
52 |
57 |
126.7 |
71.3 |
47.5 |
|
Republic of Komi |
37 |
39 |
47 |
49 |
50 |
135.1 |
62.5 |
41.7 |
|
Republic of Karelia |
39 |
42 |
42 |
44 |
47 |
120.5 |
58.8 |
39.2 |
|
Pskov Oblast |
41 |
44 |
46 |
45 |
45 |
109.8 |
56.3 |
37.5 |
|
In the NWFD, on average |
47 |
51 |
57 |
56 |
59 |
125.5 |
73.8 |
49.2 |
|
In the RF, on average |
48 |
51 |
54 |
56 |
58 |
120.8 |
72.5 |
48.3 |
According to our calculations, the population consumed more than 1.2 million tons of imported fruits and berries in 2010 in the North-West Federal District [8].
Per capita fruit and berries consumption has increased in the regions of the North-West Federal District due to the growth of imported products. It increased by more than 25% for the period from 2006 to 2010 (table 5) . Per capita fruit and berries consumption amounted to 59 kg in the North-West Federal District in 2010. It was even slightly higher than the national average fruit and berry consumption. However, this level is still only 74% of the minimum rate; it is only 48% in the share of optimum consumption.
The price level is the most important factor that influences the current level of consumption. According to the Federal State Statis-tics Service, there was 1.7-fold rise in prices for stone fruits, 1.6-fold rise in prices for seed fruits and 2.8 rise in prices for berries (table 6) .
There is a continuous rise in purchasing prices for imported products. The rise in retail prices for fruit surpasses the rise in prices for foodstuffs in whole. For example, the retail price for apples was 24 rubles per kilogram in the Vologda Oblast in 2000, and it increased by 2.5 times and amounted to 64 rubles on average in 2010. The selling price for bananas increased from 17.4 to 48.2 rubles per kilogram or by 2.8 times for this period (fig. 1) .
Table 6. Price index numbers of fruit and berry production in the Russian Federation, in % to the previous year [9]
|
Types of products |
2005 |
2006 |
2007 |
2008 |
2009 |
2010 |
2010 to 2005, % |
|
Stone fruits |
118.8 |
111.4 |
101.4 |
125.2 |
116.7 |
104.0 |
171.6 |
|
Seed fruits |
127.7 |
126.3 |
110.2 |
115.5 |
104.5 |
95.0 |
159.6 |
|
Berries |
113.1 |
127.9 |
124.4 |
121.4 |
130.2 |
111.7 |
280.9 |
|
Grapes |
98.1 |
122.3 |
136.6 |
103.5 |
96.7 |
99.8 |
166.9 |
Figure 1. Average consumer prices for some products in the Vologda Oblast at the end of the year, rubles per one kilogram [12]
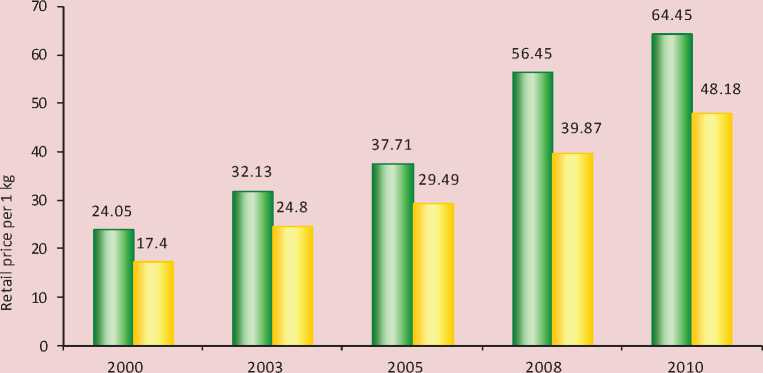
□ Apples □ Bananas
The prices cause significant differences in fruit and berry consumption by the population groups with different incomes. So, according to the results of budget surveys conducted in the Vologda Oblast in 2010, the fruit and berry consumption amounted to 25 kg per a member of the family in the first decile group (people, who have the lowest incomes) and it was 88 kg (3.5-fold higher) in the tenth group (people, who have the highest incomes).
The cost of annual fruit and berry consumption amounted to 1359 rubles in the group with the lowest incomes and 5252 rubles (3.9-fold higher) in the group with the highest incomes (table 7) .
It should be noted that there is the following per capita fruit and berry consumption in the families with children aged under 16: 62 kg in single-child families, 51 kg in two-child families and only 43 kg in three-child families. There is a similar trend in other regions of the North-West Federal District.
Thus, the development of fruit and berry market in the regions of the North-West Federal District and its reaching the volumes, which provide the optimum level of fruit and berries consumption, are limited with respect to both demand and supply.
The demand is limited by low incomes of most people and rapid-growing retail prices for fruit and berries. The supply in this market is becoming more dependent on the rising costs of market fruit and berry resources (especially, imported).
Table 7. The amount and cost of fruit and berries, consumed by the households of different standards of well-being in the Vologda Oblast, 2010.
|
Households |
Average consumption in the families surveyed |
Including in ten percentage groups of the population |
|||||||||
|
1 |
2 |
3 |
4 |
5 |
6 |
7 |
8 |
9 |
10 |
||
|
The amount of fruit and berry consumption, kg |
|||||||||||
|
Total households: |
67 |
25 |
34 |
48 |
60 |
71 |
78 |
87 |
83 |
86 |
88 |
|
Urban |
70 |
28 |
33 |
49 |
58 |
74 |
87 |
97 |
86 |
89 |
92 |
|
Rural |
61 |
21 |
38 |
47 |
63 |
63 |
58 |
67 |
76 |
80 |
80 |
|
The cost of consumed fruit and berries, rub. per a member of the family |
|||||||||||
|
Total households: |
4084 |
1359 |
1914 |
2820 |
3547 |
4072 |
4867 |
5780 |
5251 |
5191 |
5252 |
|
Urban |
4116 |
1483 |
1721 |
2598 |
3238 |
4115 |
5232 |
6253 |
5268 |
5183 |
5380 |
|
Rural |
4004 |
1072 |
2342 |
3299 |
4235 |
3979 |
3951 |
4725 |
5213 |
5208 |
5021 |
|
Source: Food consumption in socio-economic population groups in the Vologda Oblast (based on a sample survey of household budgets). Vologda: Vologdastat, 2011. |
|||||||||||
The supply is also limited by a low level of local fruit and berry production. It should be stressed that the growth of local resources are hindered by rising costs of fertilizers for the owners of garden plots, increased passenger and transport fares.
Almost everywhere there is no organized direct purchasing of garden products in the cooperatives and associations.
In order to use effectively the intensive development reserves of local fruit and berry production in the northern regions, it’s necessary to have an active government support, which consists in the following steps:
– ensuring regular monitoring and analysis of the situation in the gardening and country farms;
– developing regional target programs and projects for the development and support of gardening in the region;
– improving the system of banking and other types of individual lending of personal rural households;
– developing a system of benefits and discounts in specialized stores selling seeds, plants and gardening equipment;
– arranging public activities and events (fairs, competitions, festivals, exhibitions, scientific conferences, round tables, etc.) aimed at the popularization of gardening and country households;
– promoting the integration between gardening and country households into the systems of social consumer societies;
– organizing the clear purchase of fruit and berries surplus with the population.
The most important way to increase the population’s provision with fruit and berries in the regions of the North-West Federal District is the collection and processing of wild berries, a biological reserve of which is much more than the yield of cultivated berries.
According to forest management data, the biological reserve of wild berries in the Vologda Oblast amounts to 56 thousand tons, including 37 thousand tons of cranberries, 11.2 thousand tons of cowberries and 7.8 thousand tons of blueberries2.
A consumer’s co-operation was the main organization for these products laying-in during a long period of time. It had a branched chain of collecting centers in all regions.
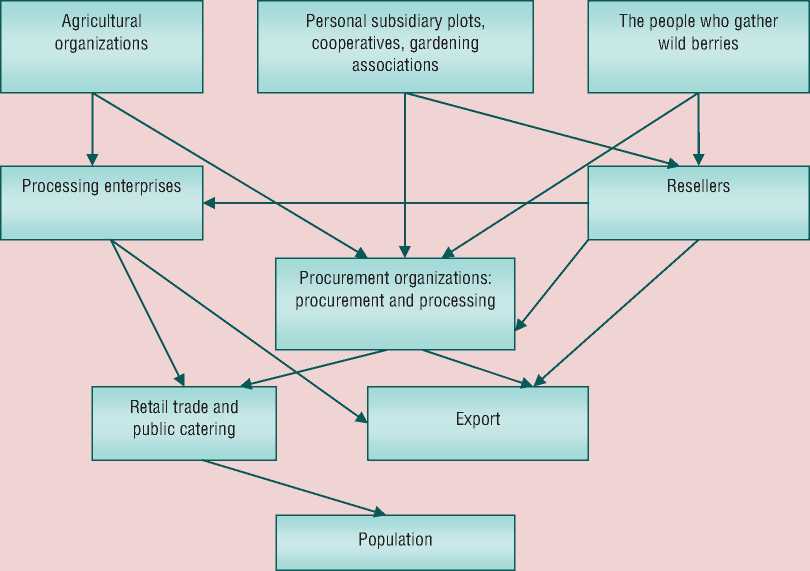
Figure 2. Organizational and economic chain of cultivated and wild berries movement
In 1991 the Vologda consumers’ association bought 3.8 thousand tons of cranberries and cowberries from the population. A significant part of this production was realized in the domestic and foreign markets. However, the system of consumer’s co-operation was destroyed. In 2010 the cooperatives bought only 11 tons of berries. Moreover, today there are a lot of private companies and buyers in the wild berry market, who work with exporters and metropolitan retailers. Vologda Berry LLC has been operating in our region since 2003. Processing capacity of this enterprise is created in the Ust-Kubinsky District. The main method of berry processing here is a shock freezing in low temperature cells (up to -45 °), followed by a long-term storage at - 25 °. This enterprise laid in two tons of berries in the Vologda Oblast in 2007 – 2008. Judging from the published materials, its effectiveness is increased step by step [6]. Vologda Plan for Forest Food Products LLC is also developed progressively.
The experience in the use of wild berry reserves is also accumulated in other regions of the North-West Federal District. Marketing activities aimed at expanding the share of berry products in the domestic and foreign markets is an important aspect in this case.
Figure 2 shows a diagram of the organizational and economic chain of cultivated and wild berries movement. This chain, in our opinion, will improve the efficiency of local berry reserves.
As for the growth rates and the sales of fruit and berries imported by the region, the following dynamics can be predicted here. Russia’s accession to the WTO will reduce customs duties on imported products, which will create an objective opportunity to reduce prices in the regional consumer markets and increase the population’s demand for these products. But this opportunity will depend greatly on the degree of trade competitiveness in Russia, the improvement of antimonopoly law and the actual implementation of measures to combat corruption in the economy.
Let’s hope that the policy proclaimed by the current authorities will be effective. Then the development of fruit and berry market will reach the results providing the fruit and berry consumption level, ensuring the promotion of public health in Russia and improving the living quality of our people.
References The state and developmental trends of fruit and berry market in the north-western regions of Russia
- On the development of agriculture. Federal Law of the Russian Federation № 264-FL. Adopted by a Decree of the State Duma as of 22.12.2006. Available at: www. consultant.ru.
- Ivanov V.A. Sustainable agricultural sector development of the North zone: state, factors, directions. Economic and social change: facts, trends and forecasts. 2012. No. 1. P. 51-68.
- The results of All-Russia agricultural census 2006. Available at: http://www.gks.ru/news/perepis2006/T4/t4k1.pdf
- Kolesnikov V.A. Orcharding. Moscow, 1966.
- Medvedev S.M. The concept of fruit and berry subcomplex management. Available at: http://vak.ed.gov.ru/common/img/uploaded/files/vak/announcements/economich/2009/26-10/MedvedevSM.DOC
- Nesterov A. Berry certificate. Business and government. 2011. No. 6. P. 22.
- Panteleyeva O.I. Organizational and economic foundations of the functioning and development of the berry market in the Kostroma Oblast. Kostroma, 1997.
- The consumption of staple foods. Available at: http://www.gks.ru/wps/wcm/connect/rosstat/rosstatsite/main/publishing/catalog/statisticJournals/doc_1286360627828
- Russian Statistical Yearbook. 2010. Stat. Col. Moscow: Rosstat, 2011.
- Ryzhkova S.M. The development of fruit and berry market. Available at: http://www.vniiesh.ru/documents/document_4968_авт-т%20Рыжковой.doc
- Agriculture, hunting and forestry in Russia. 2011. Stat. Col. Moscow: Rosstat, 2011.
- Statistical Yearbook of the Vologda Oblast 2010. Stat. Col. Vologda: Vologdastat, 2011.
- Skrynnik E.B. The development strategy for the medium term crop production. Available at: http://www.bioethanol.ru/bioethanol/news/strategija_razvitija_rastenievodstva_na_srednesrochnuju_perspektivu/
- Trends and problems in the development of the region: research papers in 3 volumes. Vol. I: Formation and development strategy of the market economy. Vologda: VSCC CEMI PAS, 2005.
- Uskov V.S. Agriculture in the Vologda Oblast and the directions of its governmental support. Problems of development of territories. 2011. No. 1. P. 36-41.
- Chekavinsky A.N. The acceleration of scientific and technical progress as a strategic task of agricultural development in the region. Problems of development of territories. 2011. No. 2. P. 25-31.
- Food consumption in socio-economic population groups in the Vologda Oblast (based on a sample survey of household budgets). Vologda: Vologdastat, 2011
