The territorial examination of the income status of the population in Hungary

Author: Czabadai Lilla Ldorfain, Topa Zoltn, Ldorfai Gyrgy
Journal: Региональная экономика. Юг России @re-volsu
Section: Фундаментальные исследования пространственной экономики
Article in issue: 2 (20), 2018.
Free access
The question that what kind of factors could influence the income status of a region have been involving the researchers for a long time. Using GDP or regional GDP by themselves is no longer satisfying to determine the development level of a region. In our study we tried to collect basic data which were well representing the chosen topic, furthermore which were easily available and interpretable on smaller (for example district or settlement) territorial levels. In our research, we intended to examine which factors could affect the income status of a region. Within this framework we did our investigations in the programming period 2007-2013 because of the accessibility of data collection. We compared the sum of different subsidies, local taxes and the gross value added to the region’s income status. We illustrate our results on GIS maps at district level in order to show the present situation about the territorial differences in Hungary. By the help of the used methodology and the created maps we aimed to answer our preliminary hypothesis. According to them the received supports, the taxes paid by local people and the gross value added generated by local enterprises are showing a strong correlation with the formation of the Hungarian populations’ income status.
Income, gross value added, development, methodology, indicator, territorial differences, competitiveness, district
Short address: https://sciup.org/149131248
IDR: 149131248 | UDC: 330.564.2 | DOI: 10.15688/re.volsu.2018.2.1
Оценка доходов населения Венгрии: территориальный аспект
Вопрос, какие факторы могут повлиять на доходы населения региона, сохраняет свою актуальность. Использования показателей ВВП или ВРП уже не достаточно для определения уровня развития региона. В своем исследовании авторы попытались проанализировать базу данных, отражающих эту проблему и охватывающих население региона (или поселения) территориальной организации хозяйства. В статье изучены основные факторы, существенно влияющие на уровень доходов населения конкретных регионов Венгрии, исследован процесс составления программ их социально-экономического развития за 2007- 2013 гг., исходя из доступности тех или иных данных. Авторами осуществлен компаративный анализ таких данных, как суммы предоставляемых субсидий, местные налоги, а также валовая добавленная стоимость в рамках дохода регионов. Полученные результаты проиллюстрированы на ГИС-картах на уровне районов для того, чтобы показать степень и глубину территориальных различий, подтверждающих или отрицающих предварительную гипотезу. Согласно полученным данным, сравнение сумм полученных субсидий, налогов, уплаченных местными жителями, а также объем валовой добавленной стоимости доказывает существование значительной корреляции этих показателей с уровнем дохода населения разных регионов Венгрии.
Text of the scientific article The territorial examination of the income status of the population in Hungary
DOI:
Introduction. The topic of the population’s income level has been discussed by many Hungarian and foreign scholars as well. The income level of the population plays an important role in making economic, financial, political and rural development decisions; therefore, the data required for its investigation is collected regularly and accurately by the central government. In Hungary, it is collected by the Hungarian Central Statistical Office (HCSO); some of its international counterparts are the United States Census Bureau in the USA, the Office for National Statistics (ONS) in the United Kingdom, the Statistisches Bundesamt (Destatis) in Germany. They collect data about the income levels of their respective countries. For European- and international level analyses the European Committee (Eurostat) and the OECD offer the most user-friendly and organised country- (and sometimes regional) level datasets, which are available for users. The most common indicator related to income levels in the abovementioned statistical systems is the household income level.
However, it is not sufficient to analyse only the households if we are to conduct a research from economic- and rural development approaches. Regional analyses must take into account many historical, economic and social theories and factors related to the topic of the investigation. When analysing the income levels, we must discuss the origin of differences between settlements (and settlement types), the urbanisation processes, competitiveness, business location theories, well-being, employment, social processes (migration), or even the effects of government support [9].
The unique characteristics of the Hungarian settlement network were established approximately in the 1860s. The urbanisation wave, thanks to the industrial revolution, resulted in only the capital city’s growth, both in qualitative and quantitative sense. There have been many plans and laws from the 1960s to balance out the strongly dominant role of
Budapest, which resulted in the appearance and strengthening of many larger and medium-sized rural towns. This relative deconcentration process caused the capital city’s population to decline, and the appearance of agglomeration areas close to larger cities and towns [4].
The notion of relieving cities and designing suburban areas appeared in many countries in Europe after the industrial revolution, in order to reorganise cities in a way that their functions are taken more into account [12], and also to create idyllic suburban areas [7]. After the suburbanisation, desurbanisation and relative deconcentration processes in Hungary and in Europe as a whole, we can observe a new phenomenon: the urbanisation of the globalised world, which marks the beginning of a new concentration process [5; 20]. The new urban systems meant the concentration of global capital in larger cities and the increase of population number (and the appearance of metropolis) [2; 16].
In Hungary, the Economic Crisis also directed the economic and social processes in the agglomerations of Budapest and the rural cities towards a new type of concentration. Thanks to the changes in income levels, less and less people move to the suburban areas. Parallel to that, the number of people leaving those areas has increased. Increasing concentration can be observed during investigating income- and education levels and the language skills as well, because people with higher incomes and better education tend to live in the centres of cities. Its reason originates from economic history. The decreasing role of agriculture and the increasing role of services should be mentioned, thus job opportunities concentrate in urban areas [13; 17].
Regionally differentiated population suggests regionally unequal income distribution. It is observable on an international level; that is why the European Union attempts to support convergence countries and regions by providing different subsidies, hoping that they would catch up with more developed countries.
The development levels of countries are measured by their GNI, while regions are measured by using GDP [22]. Experts have been debating for decades about the usage and content of GDP, as an indicator measuring economic development [10]. It is clear that it properly represents income levels; however, it cannot be applied for measuring competitiveness or social welfare, due to its lacking nature [19].
Social Progress Index, published in 2015, is a suitable alternative to measure well-being [3; 14]. It investigates many indicators (e.g. ones related to basic services, health-care and human rights) within three categories (basic human needs, the bases of well-being and opportunities), which are beyond indicators illustrating economic development. The content of the index was changed (expanded) in 2016; therefore, now it examines even more countries with more indicators [18].
The increasing R&D spending and the expansion of innovation is generally more common in regions where we can find institutions of higher educations, or the concentration of companies (business clusters, business incubators, etc.). Companies provide 80–90 % of the jobs in the developing countries; furthermore, they produce approximately 60 % of the GDP. These proportions are very similar in Hungary, because the territorial inequalities (resulted by the first large wave of urbanisation) increased after the political transition in 1989–1990. The seven statistical regions created as a requirement for the accession to the EU do not cover homogenous territories, and that is one of the reasons why the development level of the capital city distorts the development data of the Central-Hungarian region in a positive way (Budapest produces approximately 40 % of the Hungarian GDP / Due to the differences in development, the county assembly voted in favour of separating Pest and Budapest in 2016.) [11]. In this case, despite the criticism mentioned before, GDP is a very meaningful indicator; Budapest would belong to the 25 bestperforming regions in the European Union. The high level of regional disparities is well-shown by the fact, that four regions out of the seven belong to the 20 poorest regions of the EU: Northern-Hungary, Northern Great Plain, Southern Great Plain, Southern Transdanubia [21].
The economic development and income level of a region can be indicated by illustrating the purchasing power of the local population. A company dealing with regional data collection and processing called GeoX Kft. created a map about the purchasing power of the Hungarian settlements with more than 20 000 inhabitants (fig. 1). The Települési Vásárlóerő Adatbázis (Settlements Purchasing Power Database) contains and applies basic data and calculated indicators for the income situation (income from work, social income, calculated gross and net income) and for consumption spending (e.g. food, clothing, home maintenance, transportation, health care, education, etc.) per capita, in Hungarian Forint (HUF / 1 € = 310 HUF, Hungarian National Bank exchange (mid) rate, January, 2017 ) for every settlement, in a unified way [6].
This paper discusses an index created by utilising knowledge from literature review and own experience, which is, similarly to the settlement level purchasing power, able to illustrate the income potential of Hungarian districts in a graphical way.
Materials and methods. One of the bases of our research is that income levels show correlation with many different factors. We would like to discuss the existence of these correlations not only theoretically – as we did in the introduction, but also by using analytic methodology.
As a first step, we chose datasets based on literature and on our own experience, and then they were selected based on their relevancy to the research topic. After the data-gathering process, the result was a dataset consisting of 30 indicators, which were collected from all years between 2007 and 2013. Due to the lack of data we experienced in the case of some indicators, the analysed time period was decreased to the years between 2009 and 2013. The chosen territorial unit for our investigation was the LAU-2 level (district, in Hungary). Our decision was encouraged by our wish to prove the applicability of our methodology and the need to establish an information system to support it. As a result of our efforts, we collected 30 (standardised) indicators for 175 districts and for 5 years, which is equivalent to 27,000 data analysed during the investigation.
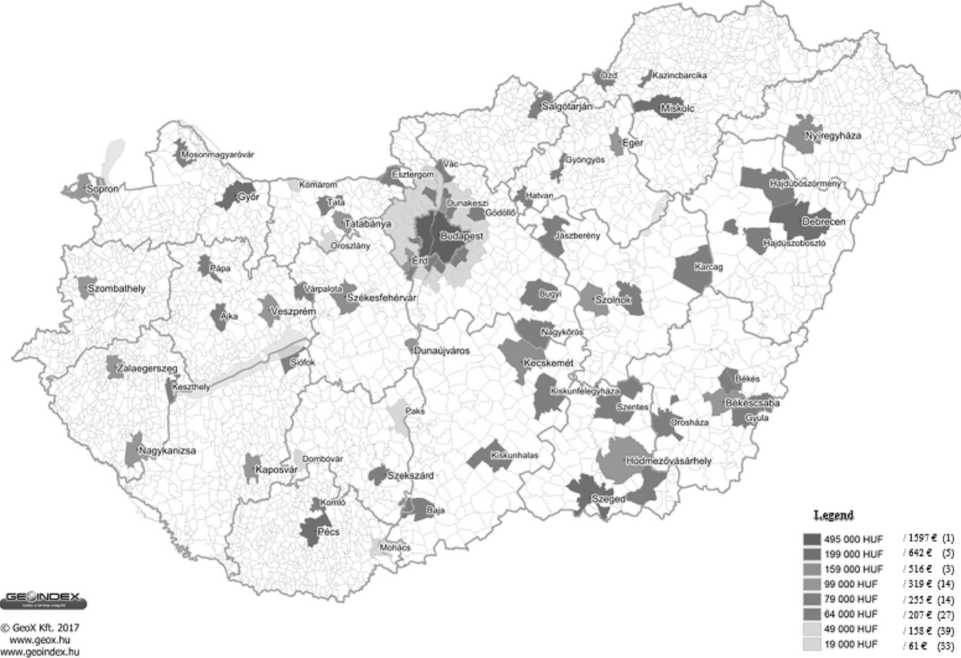
Fig. 1. Settlement level purchasing power 2017
Note. Source: [6].
After collecting the data, correlation analyses were conducted, focusing on the years investigated, in order to observe the relationship between income levels and other indicators (and if there are any, how strong they are), and to see whether the correlation can be observed in every year, or not.
Correlation analysis is the tool of analysing linear correlation between variables with high levels of measurement, and also to establish the existence, strength and direction of the correlation. During correlation analysis, in the case of dependent and independent variables, metric data can be used.
The value of the linear correlation (or Pearson’s coefficient, marked as: r ) is calculated as follows:
5" l(xt - х)(У, - у) r = n ,
^(«i - ^№1(У. - У)2
where x – marks the average of xi , and y – marks the average of yi [15].
The value of “r” is measured on a scale from -1 and + 1. The stronger the correlation between the variables is, the closer the absolute value of the correlation coefficient gets to the 1. When r = 0, the relationship between the investigated variables is noncorrelated, but it is not called independent; it means that there is no linear correlation between the two variables, but other type of relationship may be found between them. The direction marks not the direction of the dependent or independent variables, but the correlation’s direction. During correlation analysis, it cannot be determined that which is the dependent and which is the independent variable [15].
The possible values of the correlation coefficient were set according to the evaluation criteria of [15], illustrated in Table 1.
Based on the values of the correlation, the type of the linear relationship was categorised into a five-level scale, based on [8], which classification is illustrated by Table 2.
Since the direction of the relationship does not indicate the direction of dependent and independent variables, just the direction of the correlation, the classification of [8] was used.
In order to expand the research, an index was created during the correlation analysis from the data – indicators – showing strong and moderate stochastic correlation, to find out which indicators influenced the income levels in the districts. This index was called ‘Income Potential Index’. During the creation of this index a simple indexing method, the minmax normalisation, during which the indicators are weighted by their correlation values. During the minmax normalisation different indicators with different units of measure are transformed to a certain range (during which the distribution remains the same). The following formula was used:
, where the minx was the lowest, while maxx was the highest value of the indicator, and rx marked the correlation value of income levels and the selected indicator. The data gained by the analyses were illustrated on maps by using the QGIS software.
Note. The author’s own edition.
Results. The correlation analysis was carried out using Microsoft Excel. The results of the most important (moderate- or strongly stochastic) correlations are illustrated by Table 3. As it can be seen in the table, there were four strong ( local taxes, knowledge-intensive services, number of operating enterprises, the number of registered unemployed people) and five moderate (number of personal vehicles, medium high-tech processing industry, gross value added, high-tech processing industry, balance of migration) kinds of stochastic
-
Table 1
The possible values of the correlation coefficient
|
The value of r |
The direction and strength of the correlation |
|
Г = 1 |
Perfect positive correlation |
|
0.7 < г < 1 |
Strong positive correlation |
|
0.2 < г < 0.7 |
Moderate positive correlation |
|
0 <г < 0.2 |
Weak positive correlation |
|
г — 0 |
No linear correlation |
|
-0.2 < г < 0 |
Weak negative correlation |
|
-0.7 < г < -0.2 |
Moderate negative correlation |
|
-1 <г < -0.7 |
Strong negative correlation |
|
г = —1 |
Perfect negative correlation |
Note. The authors’ own editing based on: [15].
-
Table 2
The type of linear correlation between variables
|
The strength of the correlation |
The value of r |
|
There is no correlation between the variables |
-0.25. г < 0.25 |
|
Weak stochastic correlation |
-0.5 < г < -0.25 or 0.25 < г < 0.5 |
|
Moderate stochastic correlation |
—0.75 <г < -0.5 or0.5 <г< 0.75 |
|
Strong stochastic correlation |
-1 < г < -0.75 or0.75 <г<1 |
|
Perfect correlation |
г — —1 or г = 1 | |
Note. The authors’ own editing based on: [8].
-
Table 3
The values of coefficients resulted by the correlation analysis
|
Indicator / Year |
2009 |
2010 |
2011 |
2012 |
2013 |
|
Local taxes |
0.765 |
0.766 |
0.779 |
0.773 |
0.764 |
|
Knowledge-intensive services |
0.792 |
0.797 |
0.799 |
0.772 |
0.757 |
|
Number of operating enterprises |
0.804 |
0.786 |
0.796 |
0.768 |
0.751 |
|
Number of personal vehicles |
0.727 |
0.705 |
0.741 |
0.717 |
0.710 |
|
Medium high-tech processing industries |
0.670 |
0.631 |
0.682 |
0.693 |
0.695 |
|
Gross value added |
0.573 |
0.626 |
0.641 |
0.648 |
0.673 |
|
High-tech processing industry |
0.669 |
0.653 |
0.685 |
0.628 |
0.553 |
|
Balance of migration |
0.596 |
0.567 |
0.601 |
0.548 |
0.537 |
|
The number of registered unemployed people |
-0.799 |
-0.807 |
-0.803 |
-0.799 |
-0.761 |
Note. The authors’ own editing based on own analysis.
correlation was found between the income levels and the other 29 indicators.
As seen in the table, indicators show approximately the same level of stochastic relationship with income, with only small differences between them in different years. Therefore, we consider the basic hypothesis of our research proven; namely, that income levels show close correlation with many other indicators, and this correlation remains the same in later years.
Due to the fact that correlation analysis does not indicate the directions of the dependent and independent variables with positive or negatives signs of the correlation, the cause-effect relationship cannot be explored. Therefore, the authors tried to identify cause-effect relationships in case of the 9 indicators based on literature and own experience. As a result, 8 indicators were chosen as ‘causes’, meaning that they influence the income levels, and 1 indicator was chosen as an ‘effect’ (the number of personal vehicles, based on the assumption that increasing income levels result the growth of savings, which may result in purchasing new cars).
From the remaining 8 indicators we received normalised data weighted by their correlation value for district levels, by using the methodology discussed above. The results are illustrated on maps for every investigated year (fig. 2). Based on the methodology the values could be varied on a scale from 0–100,
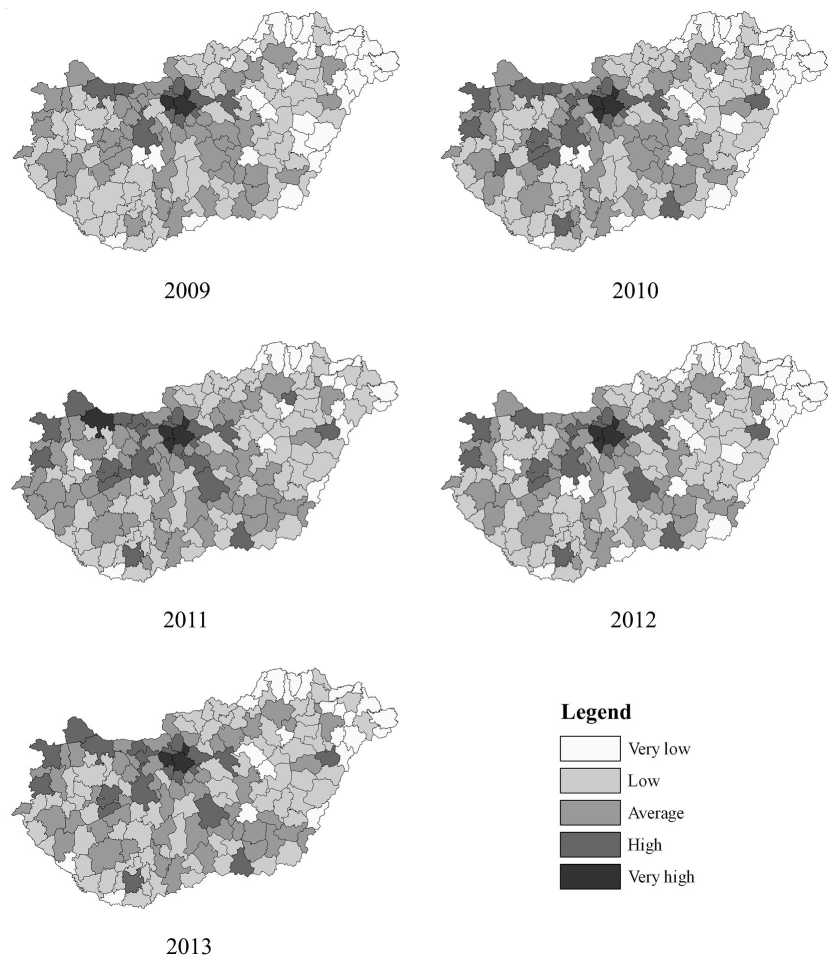
Fig. 2. The trends of the Income Potential Index throughout the investigated years
Note. The authors’ own editing based on own analysis by using QGIS.
and these values can be categorised into five groups (tab. 4).
Table 4
The categorisation of normalised data weighted by correlation values
|
Colour code |
Name |
Value |
|
Very low |
0-14.99 |
|
|
Low |
15-29.99 |
|
|
Average |
30-44.99 |
|
|
High |
45-59.99 |
|
|
Very high |
60-100 |
Note. The authors’ own editing based on own analysis.
Many common points were discovered during the comparison of the facts found in the literature and the results of the analysis. By examining the maps, we could see that the district level Income Potential Index showed changes from year to year. It was found, after investigating the dataset, that there significantly positive changes were in 15 districts, positive change in 78, slight change in 70, negative change in 10 and significantly negative change in 2 districts in the inviligated time period. The investigation found the districts with the worst income potential in Northern-Hungary, while the best ones in the three Transdanubian regions and in Central-Hungary. There was 77 index point difference between Budakeszi district, the one with the best values / District in Central-Hungary region / and the Cigánd district, the one with the worst values / District in Northern-Hungary region . This result well illustrates the fact that there are significant regional differences in Hungary regarding to the factors affecting income levels. We drew the following conclusions by analysing the maps and the datasets behind them:
-
• It is clear that Budapest (the capital city) and its agglomeration is the area with the absolutely highest income potential. Along with other districts with very high potentials ( Budakeszi, Dunakeszi, Érd ) and high potential districts ( Szentendre, Pilisvörösvár, Szigetszentmiklós, Gödöllő, Vecsés ) nearby, they form a very significant economic centre.
-
• By analysing the data, we can find that the Budapest – Győr – Vienna development axis generates significant income generating potential. Beside Budapest and its agglomeration, the districts of this area indicate the highest Income Potential Index.
-
• When investigating the maps and the motorway network of Hungary, we could see that
the districts with the highest income potential are almost the same as the districts situate along the motorways starting from Budapest.
-
• We can find districts with high Income Potential Index scattered, which have towns with county seat rights ( half of the towns with county seat rights belong to this category: the districts of Debrecen-, Érd-, Győr-, Kecskemét-, Pécs-, Sopron-, Szeged-, Székesfehérvár-, Szombathely-, Tatabánya, Veszprém ). Some of these received extra support to balance out Budapest, while others have industrial parks that contributed to their high potentials.
-
• The Lake Balaton and its surrounding area has high and moderate Income Potential Index, which is most likely resulted by the fact that the region is a top tourist destination in Hungary. Furthermore, a main transportation route, the M7 motorway can also be found in the region.
-
• The district level clusters of the most lagging settlements , which have been investigated in many cases in Hungary, can also be easily found on the maps. These areas can be found mainly along the north-eastern and also at the south-eastern borders. These are the areas which lost their centres after World War I.
Conclusion / Discussion. Based on the literature review and the results of the investigation discussed in this paper we can conclude that traditional income-related territorial differences still exist in Hungary. We can observe both and an Urban-Rural disparity as well. Also, the prominent role of Budapest still shows, as it is the most developed economic centre in Hungary. On the positive note, the regions with larger rural towns all show high income potential, which means that a certain ‘spread’ effect can be observed in those areas. Our study found that income potential is very high in those areas, where we could find many operating enterprises, generating high amounts of local taxes (which contributes to the high income per capita). It is a novel aspect of the research that we found the presence of knowledge-intensive services and high-tech processing industry did influence the income levels of regions. To sum it up, we can establish that the index formed from 8 indicators proved to be appropriate for analysing the income potential of certain regions and to determine the main factors affecting income levels.
A CKNO WLED GEMENTS в Supported BY the ÚNKP-17-3 New National
MINISTRY ,
Excellence Program of the Ministry of Human Capacities.
References The territorial examination of the income status of the population in Hungary
- Annoni P., Kozovska K. EU Regional Competitiveness Index 2010, European Commission Joint Research Centre. Luxembourg, Office of the European Union Publ., 2010, pp. 28-47.
- Castells M. La question urbaine, Transleted by Alan Sheridan in 1977. London, Edward Amold Ltd. Publ., 1972. 493 p.
- Csath M. A regionális fejlettség mérése társadalmigazdasági mutatók alapján. Pest megyei esettanulmány . Csath M. (szerk.). Regionális versenyképességi tanulmányok . Budapest, NKE Szolgáltató Nonprofit Kft. , 2016, pp. 73-107.
- Enyedi Gy. Az urbanizációs ciklus és a magyar településhálózat átalakulása, Értekezések-emlékezések . Budapest, Akadémiai Kiadó , 1984, pp. 14-19.
- Enyedi Gy. Városi világ . Budapest, Akadémiai Kiadó , 2012. 186 p.
- GeoX Térinformatikai Kft. . Budapest, GeoIndex -Settlements purchasing power database, 2017. URL: http://www.geoindex.hu/wp-content/uploads/100x100-vasarloerotelepulesek-2017.png.
- Howard E. Garden cities of To-morrow. London, Swan Sonnenschein & Co. Ltd. Publ., 1902. 195 p.
- Huzsvai L., Vincze Sz. SPSS-könyv . Budapest, Seneca Books Kiadó , 2012. 154 p.
- Káposzta J., et al. Efficiency of Hungarian regions in using the development funds for touristic purposes. Regional Economy. South of Russia, 2014, no. 4 (6), pp. 33-39.
- Káposzta J., Nagy H. Gross Domestic Product as an indicator of regions’ competitiveness for plant-soil interrelations. Cereal Research Communications, 2008, vol. 36. 5. Supplement, Budapest, Akadémiai Kiadó, 2008, pp. 2039-2042.
- Káposzta J., Nagy H. Status Report about the Progess of the Visegrad Countries in Relation to Europe 2020 Targets. European Spatial Research and Policy, 2015, vol. 22, no. 1, pp. 81-99 DOI: 10.1515/esrp-2015-0018
- Le Corbusier. Towards a New Architecture (Vers une Architecture), Translated from the thirteenth edition and with an Introduction by Frederick Etchells. New York, Dover Publications Inc. Publ., 1986. 318 p.
- Péli L., Neszmélyi Gy. Territorial Differences of Rural Cities and the Development of Transport Infrastructure in Hungary. Romanian Review of Regional Studies: Journal of the Centre for Regional Geography, 2015, no. 11 (2), pp. 69-84.
- Porter M., et al. Social Progress Index 2015. Washington, Social Progress Imperative Publ., 2015. 158 p.
- Sajtos L., Mitev A. SPSS kutatási és adatelemzési kézikönyv . Budapest, Alinea Kiadó , 2007, pp. 203-214.
- Sassen S. The Global City. New York, London, Toky, Princeton University Press Publ., 1991, pp. 22-34.
- Schuchmann J., Váradi Zs. A magyar nagyvárostérségek társadalmi-demográfiai szerkezete . Szirmai Viktória (szerk.). A területi egyenlőtlenségektől a társadalmi jól-lét felé . Székesfehérvár, Kodolányi János Főiskola , 2015, pp. 111-130.
- Stern S., et al. Social Progress Index 2016. Washington, Social Progress Imperative Publ., 2016. 41 p.
- Stiglitz, et al. Mismeasuring Our Lives: Why GDP Doesn’t Add Up. e-report. Report by the Commission on the measurement of Economic Performance and Social Progress Publ., 2010. URL: http://library.bsl.org.au/jspui/bitstream/1/1267/1/Measurement_of_economic_performance_and_social_progress.pdf
- Szirmai V., ed.Urban Sprawl in Europe: Similarities or Differences? Budapest, Aula Publ., 2011. 280 p.
- Tóth R. magyarországi kis-és közepes vállalkozások regionális különbségei in: Csath M. (szerk.): Regionális versenyképességi tanulmányok . Budapest, NKE Szolgáltató Nonprofit Kft. , 2016, pp. 143-179.
- Which regions are affected? European Comission. Regional Policy -Inforegio 2015. URL: http://ec.europa.eu/regional_policy/archive/policy/region/index_en.htm.
