The trend of non-communicable and cardio-vascular diseases mortality in India

Author: Sona K.V., V. Vaithianathan
Journal: Science, Education and Innovations in the Context of Modern Problems @imcra
Article in issue: 2 vol.5, 2022.
Free access
“Health for All” is a cherished goal of all governments the world over. Good well-being is a fundamental pre-essential which contributes altogether both to the development in labour efficiency and human asset advancement. Cardio-vascular Diseases (CVD) tends to be the world’s leading cause of mortality, although there are major differences among rich and poor countries. The goal of this paper is to analyse the percentage contribution of the 8 major cause’s categories of mortality in the period 2000 to 2018 and the trend of Non-communicable Diseases (NCD) and CVD mortality rates in India. Standard Deviation, Coefficient of Variance and Disparity Ratio tools are used by the researcher to anlyse the year- wise fluctuations in CVD related mortality. Pulmonary circulation diseases, as well as other types of CVD and ischemic heart disease, are the leading causes of death. CVD is the leading cause of morbidity and mortality in India, and it also contributes to a significant economic problem. The return on investment for services encouraging healthier lifestyles and preventing, treating, and managing Congenital heart defects CHD in India has been determined to be cost-effective. There is an urgent need to establish primordial, primary, and secondary preventive methods.
Cardiovascular Disease, Causes of Death, CVD Mortality, Disparity Ratio, CHD in India
Short address: https://sciup.org/16010153
IDR: 16010153
Text of the scientific article The trend of non-communicable and cardio-vascular diseases mortality in India
According to the World Health Organization (WHO), NCDs such as CVD are now the leading cause of death and disability worldwide. According to the Global Status Report, NCDs will claim nearly 52 million lives worldwide by 2030. As per the WHO, NCDs kill 38 million people worldwide each year. In 2016, an estimated 179 million people died from CVDs, accounting for 31% of all global deaths. This report emphasised the importance of the government implementing policy and cost-effective interventions for the prevention and control of major NCDs. A NCD may be a medical condition or disease that is non-transmissible. NCDs or chronic diseases are those diseases that progress slowly and afflict the patient for a long duration. The four commonest NCDs are CVDs, Cancer, Chronic Respiratory Disease and Diabetes. In worldwide level, CVD are the main source of mortality, guaranteeing very nearly 18 million lives yearly. CVD is one of the leading causes of death in India. The rise in the burden of CVD in developed countries occurred over several decades as a result of a long period of epidemiological transition. Because of the rapid pace of economic development in India, epidemiological changes have occurred in a much shorter time frame. As a result, CVD has become the leading cause of death in India.
Statement of the Problem
The expansion in constant NCD cases is a worldwide issue on numerous levels, and that we can just expect higher than the passing rate brought about by NCDs and CVDs. With an ever-increasing number of individuals getting influenced, our world-wide productivity is likewise getting whitherever, skilled medical aid, people suffering from CVDs and loss their valuable healthy years of lives. The treatment cost is practically twofold for CVDs when contrasted with different conditions and illnesses. The burden of CVDs and resultants mortality is due to increment except if enormous efforts are made to avoid and monitor CVDs and their risk factors. CVDs influence numerous individuals in middle age, significantly reducing the income and savings of people and their families affected. The socio-economic growth of societies and nations is threatened by reduced wages and out of pocket healthcare costs.
Objectives
-
> To examine the trend of NCD and CVD mortality in India.
-
> To study about the year-wise disparities of Mortality rates in India.
Methodology
The study is focused on secondary data from different reports and statistics that have been compiled. The investigator aims to examine the year-wise disparities in causes of mortality from CVD in this article. The researcher used statistical methods such as Standard deviation, Variance coefficient and Disability ratio to examine year-wise differences in terms of causes of mortality parameters of the death group.
Review of Literature
Santos (2020) reported the full range of cost items (e.g., including morbidity and death losses of productivity, informal healthcare and early pensions) have been reported and can significantly influence economic efficiency studies in CVD prevention policies, which is why it is important to investigate the various patterns of CVD cost prevention.
Abdul Aziz (2019) identified that at the turn of the century, CVDs became India's major cause of death. This epidemiological trend has the major effect of increasing the prevalence of CVDs and CVD risk factors in India. Approximately 54.5 million persons were reported to 34 p have CVDs in India in 2016. CVDs currently represent one in four fatalities in India, with more than 80% of the burden due to ischemic cardiovascular disease and stroke. During their most affluent years, these diseases often affect patients, with catastrophic social and economic implications.
Prabhakaran (2016) explained that CVDs have been the leading cause of death in India, often occurring during a person’s most prosperous years. The epidemiological transformation is taking place differently in various regions of India due to a wide variety of economic developments. The growing burden of CVD and its adverse effects for persons, families and communities need immediate attention.
Gupta et.al (2016) indicated that cardiovascular epidemiology has been identified as a major public health issue in India. It also causes enormous financial burdens. Return on investment in healthy living, prevention, treatment and management of CVD has been found to be economically cost efficient. Primary, primary and secondary prevention techniques must be promoted urgently.
Banerjee et.al (2018) described that the trends in CVD burden and risk variables compared to the United States in the United States in India. It also presents possible explanations for these differences and strategies to improve the behaviours, systems and policies of cardiovascular health in India.
Burden of NCD and CVD
NCDs like CVD have become the world's largest cause for morbidity and death (WHO). Around CVD died in 2016, over 17.7 million individuals, or for 30% of total fatalities. Of these fatalities, 7,2 million were heart disease susceptible and 5,7 million were stroke related. Approximately 80% of these deaths were reported in nations of low and moderate income. If current trends are allowed to continue, CVD would kill an expected 23.6 million people by 2030 (mainly from heart attacks and strokes).
NCD's plan is to claim around 52 million lives worldwide by 2030, according to the Global Status Report. Five of the primary NCDs: diabetes, CVD, cancers, chronic respiratory and mental disorders is the main cause of around 77% of disease in the European region (WHO). According to the WHO, NCDs or chronic diseases are killed by 38 million global individuals each year by cancer, heart conditions, breathing conditions and diabetes. CVD is causing a quarter of all death. Heart and stroke are the most common cause of more than 80 percent of CVD deaths. The worldwide burden of death analyses indicates that the standardized age CVD death rate in India is 272 per 100,000 people, up from the global average of 235 per 1,000,000. Particular concern is expressed in certain characteristics of CVD epidemic in India, including their quick increase in disease, early onset of disease and high death rates.
Table No.1: Global Burden of NCD and CVD(in thousands)
|
Years |
NCD |
CVD |
Percent Share of CVD in NCD |
|
2000 |
31391125 |
14424607 |
45.95 |
|
2005 |
33606210 |
15388435 |
45.79 |
|
2010 |
36405327 |
16623701 |
45.66 |
|
2015 |
39544157 |
17689163 |
44.73 |
Source:
The table No.1 explores that the causes of death, by NCDs and CVDs. NCDs death rate 31391125 to 39544157 increased by 2000 to 2015 periods. CVD caused death rate also increased by 14424607 to 17689163 during 2000. During 2000 to 2015 periods 8153032 were died in NCDs and 3264556 were died with CVDs. And this difference shows that the out of NCDs 40.04 percent deaths due to CVDs. The percent share of CVDs in NCDs shows that the out of NCDs about 46 percent death caused CVDs. The overall table shows that the NCD and CVD are the leading causes of death in worldwide and India also. So, the Government takes precautions to tackle this problem and control this problem.
Figure No. 1: Number of Deaths Attributed to NCDs, by Type of Disease (India)
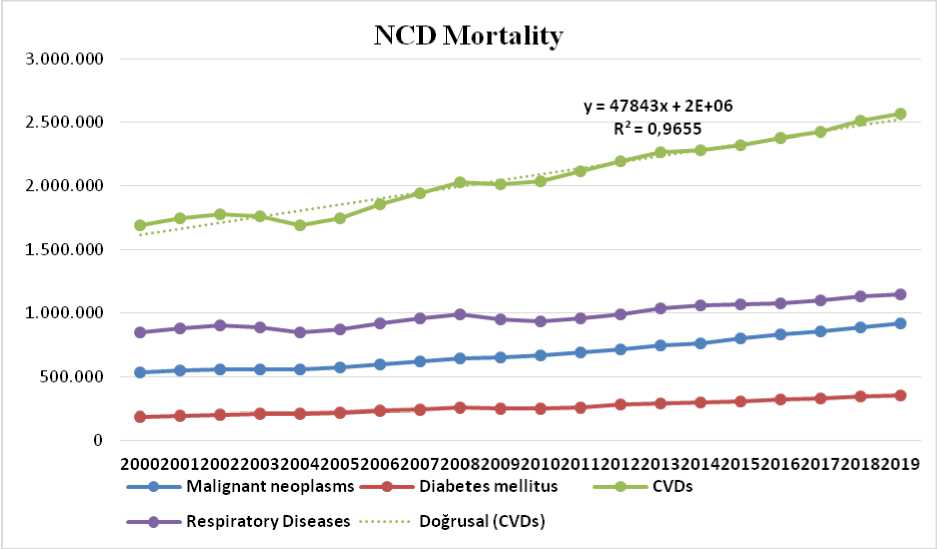
Types of NCD mortality linear trend equation is Y= 47843x+ 2E+ 06, which means there is a one unit change in x 1 there is a 47843 unit change in a value of Y variable. The overall data indicates that there is a tremendously increasing trend in the types of NCD mortality of year by year. Burden of NCD types indicates that the CVD burden is the highest causes of NCD mortality and followed by Respiratory diseases, Malignant neoplasms and diabetes are the main causes of Mortality in India. The R2 value of CVD is 0.97, which is good means all the data points are properly correlated with each other and output of the forecasting will be more accurate. This figure highlighted that there are any effective healthcare programmes or monitoring/awareness schemes specially for CVDs under taken by the Government on future onwards then only we can control the increasing trend of CVD.
CVD in Indian Scenario
CVD is the main cause of death in India. CVD affects Indians at least ten years before and at their most active midsize years compared with persons of European ancestors. For example, just 23% of CVD fatalities in western countries occur before the age of 70, compared to 52% in India. "WHO calculated that India would lose $237 billion over a ten-year period (20052015) as a result of the present load on the CVD.
The report reveals the need for urgent action. It mentioned that all governments must commit to and set national CVD goals this year and introduce policies and cost-effective measures to avoid and monitor major CVDs. As CVD occurs in India in the most productive years of the person, the country is expected to experience economic contraction. Studies have also shown that death due to CVD in persons aged 35-64 is maximum in India. Besides the health burden on the citizen, CVD also puts a socio-economic burden on the state. Further, these illnesses arise in adults during their most productive years, there is an indirect economic cost to the tax payer. The WHO study places the national income loss due to CVD at USD 237 billion by 2015.
By 2025, India would be the world's largest cause of diabetes and cardiovascular diseases and India will be the largest source of mortality and disability. CVD accounted for 27% of all deaths in India in 1998, and was 227/100,000 gross mortality. The prevalence and death rates of CVD differ widely among the Indian countries. CVD death rates vary from the states of Nagaland, Meghalaya, Himachal Pradesh and Sikkim in the southern Himalayan states to 360- 430/ 100000 in Andhra Pradesh, Tamil Nadu, Punjab and Goa. The incidence of CAD and CVD death in Kerala is significantly greater. The spatial disparities in CVD mortality in India are significant.
In India, there are major geographical differences in CVD mortality. Significant differences in CVD mortality between Indian states are due to differences in dietary consumption of fats, milk, sugar, and green leafy vegetables, as well as the prevalence of obesity. In 2010, nearly 47 million Indians had coronary artery disease (CAD), with an estimated 2.3 million dying from the disease, compared to 404000 in the United States. In India, the incidence of CAD has increased by 300 percent or more in the last 40 years, and it is now increasing at a rate of 5 to 6% per year.
Table No.2: India’s Leading Cause Groups of Mortality
|
Year |
Leading Causes of Death |
|||||||||
|
1 |
2 |
3 |
4 |
5 |
6 |
7 |
8 |
9 |
Total |
|
|
2000 |
24.3 |
7.0 |
15.7 |
7.8 |
3.6 |
3.3 |
11.3 |
14.2 |
12.8 |
100 |
|
2001 |
27.5 |
8.9 |
14.6 |
6.9 |
3.7 |
2.9 |
11.6 |
10.8 |
13.1 |
100 |
|
2002 |
27.5 |
9.0 |
14.2 |
7.4 |
3.7 |
3.2 |
11.3 |
10.1 |
13.6 |
100 |
|
2003 |
26.6 |
9.6 |
14.4 |
6.9 |
3.9 |
3.6 |
10.8 |
10.5 |
13.7 |
100 |
|
2004 |
27.1 |
8.3 |
14.5 |
6.9 |
4.4 |
3.6 |
9.7 |
11.7 |
13.8 |
100 |
|
2005 |
27.5 |
8.7 |
14.7 |
6.6 |
4.3 |
3.8 |
9.3 |
11.7 |
13.3 |
100 |
|
2006 |
27.1 |
8.6 |
13.9 |
6.7 |
4.3 |
4.3 |
8.8 |
13.6 |
12.7 |
100 |
|
2007 |
26.9 |
8.2 |
13.8 |
7.4 |
4.3 |
3.8 |
9.2 |
13.8 |
12.5 |
100 |
|
2008 |
27.7 |
8.5 |
14.0 |
7.0 |
4.7 |
4.0 |
8.9 |
13.1 |
12.1 |
100 |
|
2009 |
30.6 |
8.6 |
12.8 |
7.2 |
4.6 |
4.2 |
7.3 |
12.8 |
12.0 |
100 |
|
2010 |
29.8 |
9.5 |
13.1 |
6.9 |
4.6 |
3.9 |
7.4 |
12.5 |
12.3 |
100 |
|
2011 |
28.9 |
9.2 |
12.5 |
7.4 |
5.4 |
4.0 |
7.8 |
12.4 |
12.5 |
100 |
|
2012 |
30.4 |
8.4 |
12.3 |
6.9 |
5.0 |
3.9 |
7.7 |
12.9 |
12.5 |
100 |
|
2013 |
29.0 |
8.3 |
12.1 |
8.1 |
5.1 |
3.7 |
7.5 |
13.3 |
12.0 |
100 |
|
2014 |
31.6 |
7.8 |
11.9 |
7.2 |
5.4 |
3.7 |
7.1 |
13.2 |
11.5 |
100 |
|
2015 |
33.2 |
9.0 |
11.0 |
6.6 |
5.3 |
4.0 |
6.2 |
12.2 |
12.0 |
100 |
|
2016 |
32.6 |
9.2 |
11.4 |
6.5 |
4.9 |
4.4 |
5.9 |
11.9 |
13.1 |
100 |
|
2017 |
34.0 |
9.2 |
10.4 |
5.8 |
6.4 |
5.3 |
5.8 |
10.1 |
13.9 |
100 |
|
2018 |
32.9 |
9.4 |
9.4 |
5.9 |
5.7 |
5.6 |
4.5 |
13.1 |
13.5 |
100 |
|
Mean |
29.22 |
8.71 |
12.98 |
6.95 |
4.7 |
3.96 |
8.32 |
12.31 |
12.78 |
100 |
|
Maxi |
34 |
9.6 |
15.7 |
8.1 |
6.4 |
5.6 |
11.6 |
14.2 |
13.9 |
- |
|
Mini |
24.3 |
7 |
9.4 |
5.8 |
3.6 |
2.9 |
4.5 |
10.1 |
11.5 |
- |
|
S.D |
2.69 |
0.64 |
1.67 |
0.56 |
0.74 |
0.64 |
2.04 |
1.23 |
0.72 |
0 |
|
C.V |
9.19 |
7.33 |
12.83 |
8.11 |
15.83 |
16.25 |
24.51 |
10.01 |
5.59 |
0 |
|
DR |
33.19 |
29.87 |
48.52 |
33.08 |
59.57 |
68.22 |
85.33 |
33.31 |
18.77 |
0 |
Source: MCC Reports
Figure No.2: Trend of Leading Major Causes of Death in India
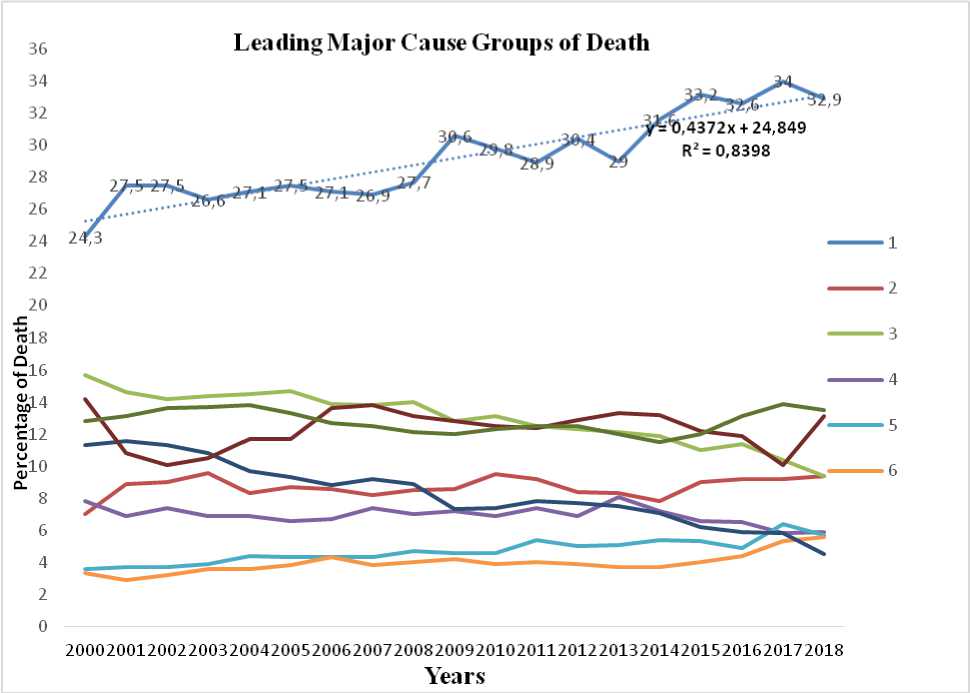
Table 1 and Figure 1 indicate the percentage distribution of eight major trigger categories of death from 2000 to 2018. According to the data, the community Disease of the circulatory system has been the leading cause of death since 2000.Its percentage of total deaths has registered a mixed trend over the years. However, it has declined by 1.1 per cent in 2018 as compared to the previous year 2017.Its proportion of total deaths has seen a mixed pattern over the years. In 2018, the proportion of deaths from this cause category increased by 8.6 percentage points as compared to 2000. The data shows that diseases of the circulatory system, or CVD, were the top leading causes of death in India, with a mean ranking of 29.22, and that the lowest mean or lowest causes of death were endocrine, dietary, and metabolic diseases. This table shows the leading major causes of death between 2000 and 2018, as well as the decadal rise. According to the MCCD results in Table 1, the year-wise inequalities in mortality in terms of coefficient of difference and disparity ratio are greatest in 40 p accident poisoning and some other effects of external cause’s mortality, with values of 24.51 and 85.33, respectively. And the highest Standard Deviation, Mean and Maximum mortality occurred by CVD. Causes of Neoplasm mortality has occurred minimum during the 2000 year. The graphical presentation and trend of leading cause groups of death from 2000 to 2018 are shown by the following figure.
Major Causes of Deaths in Circulatory System Diseases
Table No.3: Circulatory System Diseases-Distribution of Major Causes of Deaths
|
Yea r |
Causes of Deaths (CVD) |
||||||
|
1 |
2 |
3 |
4 |
5 |
6 |
7 |
|
|
201 1 |
Male |
62284(36.6 ) |
53867(31.7 ) |
27067(15. 9) |
19629(11. 5) |
7183(4.2 ) |
170030(10 0) |
|
Femal e |
40267(37.3 ) |
31654(29.3 ) |
16367(15. 1) |
14236(13. 2) |
5536(5.1 ) |
108060(10 0) |
|
|
Total |
102551(36. 9) |
85521(30.8 ) |
43434(15. 6) |
33865(12. 2) |
12719(4. 6) |
278090(10 0) |
|
|
201 2 |
Male |
77375(41.1 ) |
56134(29.8 ) |
30452(16. 2) |
18377(9.8 ) |
5990(3.2 ) |
188328(10 0) |
|
Femal e |
48238(41.4 ) |
32938(28.3 ) |
17462(15. 0) |
13118(11. 3) |
4673(4.0 ) |
116429(10 0) |
|
|
Total |
125613(41. 2) |
89072(29.2 ) |
47914(15. 7) |
31495(10. 3) |
10663(3. 5) |
304757(10 0) |
|
|
201 3 |
Male |
50273(30.7 ) |
45756(27.9 ) |
25956(15. 8) |
35691(21. 8) |
6130(3.7 ) |
163806(10 0) |
|
Femal e |
31017(29.5 ) |
26225(24.9 ) |
15737(15. 0) |
27669(26. 3) |
4608(4.4 ) |
105256(10 0) |
|
|
Total |
81290(30.2 ) |
71981(26.8 ) |
41693(15. 5) |
63360(23. 5) |
10738(4. 0) |
269062(10 0) |
|
|
201 4 |
Male |
87019(41.6 ) |
69300(33.1 ) |
28225(13. 5) |
18387(8.8 ) |
6261(3.0 ) |
209192(10 0) |
|
Femal e |
53359(41.6 ) |
41189(32.1 ) |
16035(12. 5) |
12576(9.8 ) |
5024(3.9 ) |
128183(10 0) |
|
|
Total |
140378(41. 6) |
110489(32. 7) |
44260(13. 1) |
30963(9.2 ) |
11285(3. 3) |
337375(10 0) |
|
|
201 5 |
Male |
108804(45. 1) |
66433(27.5 ) |
34284(14. 2) |
24981(10. 3) |
7006(2.9 ) |
241508(10 0) |
|
Femal e |
69234(45.8 ) |
39320(26.0 ) |
19672(13. 0) |
17538(11. 6) |
5499(3.6 ) |
151263(10 0) |
|
|
Total |
178038(45. 3) |
105753(26. 9) |
53956(13. 7) |
42519(10. 8) |
12505(3. 2) |
392771(10 0) |
|
|
201 6 |
Male |
116928(47. 6) |
57136(23.3 ) |
34070(13. 9) |
29024(11. 8) |
8319(3.4 ) |
245477(10 0) |
|
Femal e |
70344(48.5 ) |
31167(21.5 ) |
19493(13. 4) |
17549(12. 1) |
6571(4.5 ) |
145124(10 0) |
|
|
Total |
187272(47. 9) |
88303(22.6 ) |
53563(13. 7) |
46573(11. 9) |
14890(3. 8) |
390601(10 0) |
|
|
201 7 |
Male |
106168(36. 0) |
94782(32.1 ) |
42020(14. 2) |
43571(14. 8) |
8369(2.8 ) |
294910(10 0) |
|
Femal e |
62780(34.1 ) |
58475(31.7 ) |
29887(16. 2) |
26188(14. 2) |
6851(3.7 ) |
184181(10 0) |
|
|
Total |
168948(35. 3) |
153257(32. 0) |
71907(15. 0) |
69759(14. 6) |
15220(3. 2) |
479091(10 0) |
|
|
201 8 |
Male |
131960(44. 3) |
80037(26.9 ) |
44143(14. 8) |
33100(11. 1) |
8715(2.9 ) |
297955(10 0) |
|
Femal |
81784(45.2 |
43340(23.9 |
25807(14. |
22873(12. |
7165(4.0 |
180969(10 |
|
e |
) |
) |
3) |
6) |
) |
0) |
|
|
Total |
213744(44. 6) |
123377(25. 8) |
69950(14. 6) |
55973(11. 7) |
15880(3. 3) |
478924(10 0) |
|
|
Maxi |
213744 |
153257 |
71907 |
69759 |
15880 |
479091 |
|
|
Mini |
81290 |
71981 |
41693 |
30963 |
10663 |
269062 |
|
|
Mean |
149729.25 |
103469 |
53334.63 |
46813.38 |
12987.5 |
366334 |
|
|
Standard Deviation |
45129.73 |
25858.3 |
11751.74 |
14910.39 |
2092.06 |
83287.5 |
|
|
CV |
30.14 |
24.99 |
22.03 |
31.85 |
16.11 |
22.74 |
|
|
DR |
88.46 |
78.55 |
56.65 |
82.87 |
40.17 |
57.33 |
|
Source: MCC Reports
Note:1-Diseases of pulmonary circulation and other forms of heart diseases, 2-Ischemic heart diseases, 3-Cerebrovascular diseases, 4- Hypertensive diseases, 5-Others
DR.: Disparity Ratio (%) = [(Maximum Value-Minimum value)/Average value] *100, CV: Coefficient of Variation
Circulatory System Diseases is the highest-ranking global disease group, accounting for 32.9 percent of total medically accredited mortality. It accounts for 33.1 percent and 32.6 percent of male and female suicides, respectively, of their total medically prescribed mortality. The following table explains the distribution of the major components of CVD.
-
> Maximum value obtained by the causes of CVD- illnesses of the respiratory
circulation and other forms of CVD mortality is 213744 (44.6%) during 2018.
-
> The minimum value is 10663 due to other types of CVD during 2012.
-
> Highest mean and the standard deviation is 149729.25 and 45129.73 respectively,
this registered mortality due to the causes of illnesses of the respiratory circulation and other forms of heart problems.
-
> Co-efficient of variation highest value got by the causes of hypertensive diseases.
-
> The disparity ratio highest value occurred due to the causes of the respiratory
circulation and other forms of heart ailments.
Risk Factors of NCDs and CVDs
Globally, NCDs and CVDs account for a significant portion of the disease burden. Many of the risk factors are lifestyle-related and thus controllable. Physical inactivity, a lack of fruits and vegetables, a large diet of fast food, and excessive cholesterol are the leading causes of cardiovascular disease and several malignancies. Obesity and overweight can cause metabolic abnormalities and increase the risk of NCDs such as heart disease and type 2diabetes. To address the issue, three primary techniques are proposed: evaluate the need and advocate for action; design national policies, strategies, and plans for prevention and care; and promote and execute community participation in preventive and care. NCDs are preventable with current knowledge; treatments are efficient and cost-effective.
Prevalence estimates are useful in increasing awareness within the population of diseases with severe morbidity and mortality, like CVD, and in communicating risk information to individuals as well as sub groups, and in encouraging people to suggest lifestyle modifications or interventions. This contributes to the classification of individuals and populations as high risk and low risk for CVD. Every physical disorder or personal behaviour that increases the odds of developing a particular illness is referred to as a risk factor.
Extremely unhealthy diet, physical inactivity, tobacco use, and excessive alcohol use are the most important lifestyle risk factors for heart disease and stroke. Individuals can experience the effects of behavioural risk factors such as high blood pressure, high blood glucose, high blood lipids, and being overweight or obese. There are several major determinants of social, economic, and cultural change, including globalisation, urbanisation, and population ageing. Poverty, stress, and genetic factors are also CVD risk factors. Modifiable risk factors affect CAD and its risk factors in a range of environments, and these risk factors can be decreased using simple techniques. Many of these preventive interventions rely on legislation, health sector involvement, health education, and basic quality assurance programmes aimed at strengthening secondary prevention. It must also be used for primary and preventive avoidance.
Conclusion
NCDs and CVDs are major challenges for public health in the twenty-first century, not only in terms of human suffering but also in terms of the country's socioeconomic development. CVD is a major public health issue. Despite significant disparities between rich and poor countries, CVD remains the world's leading cause of death. CVD is a major cause of illness, disability, and death worldwide, accounting for roughly one-third of all deaths, resulting in an increase in personal and community healthcare costs. To address this important and serious issue, a competent plan is required. However, CVD is one of the foremost causes of mortality and morbidity worldwide. It also carries a major economic expense. The costeffectiveness of initiatives to promote healthier lifestyles as well as to prevent, handle, and maintain CHD in India has been measured. There is a pressing need to promote primordial, middle, and secondary preventive methods. Population-wide attempts to minimize risk factors across a variety of economic, educational and policy initiatives and services will result in future reductions in medical and other direct costs, as well as indirectly enhanced health.
